Download to read offline

![k|fljlwsljZn]if0f
!_ahf/ ;f/f+z -kf}if@, @)&@ ;Ddsf]_
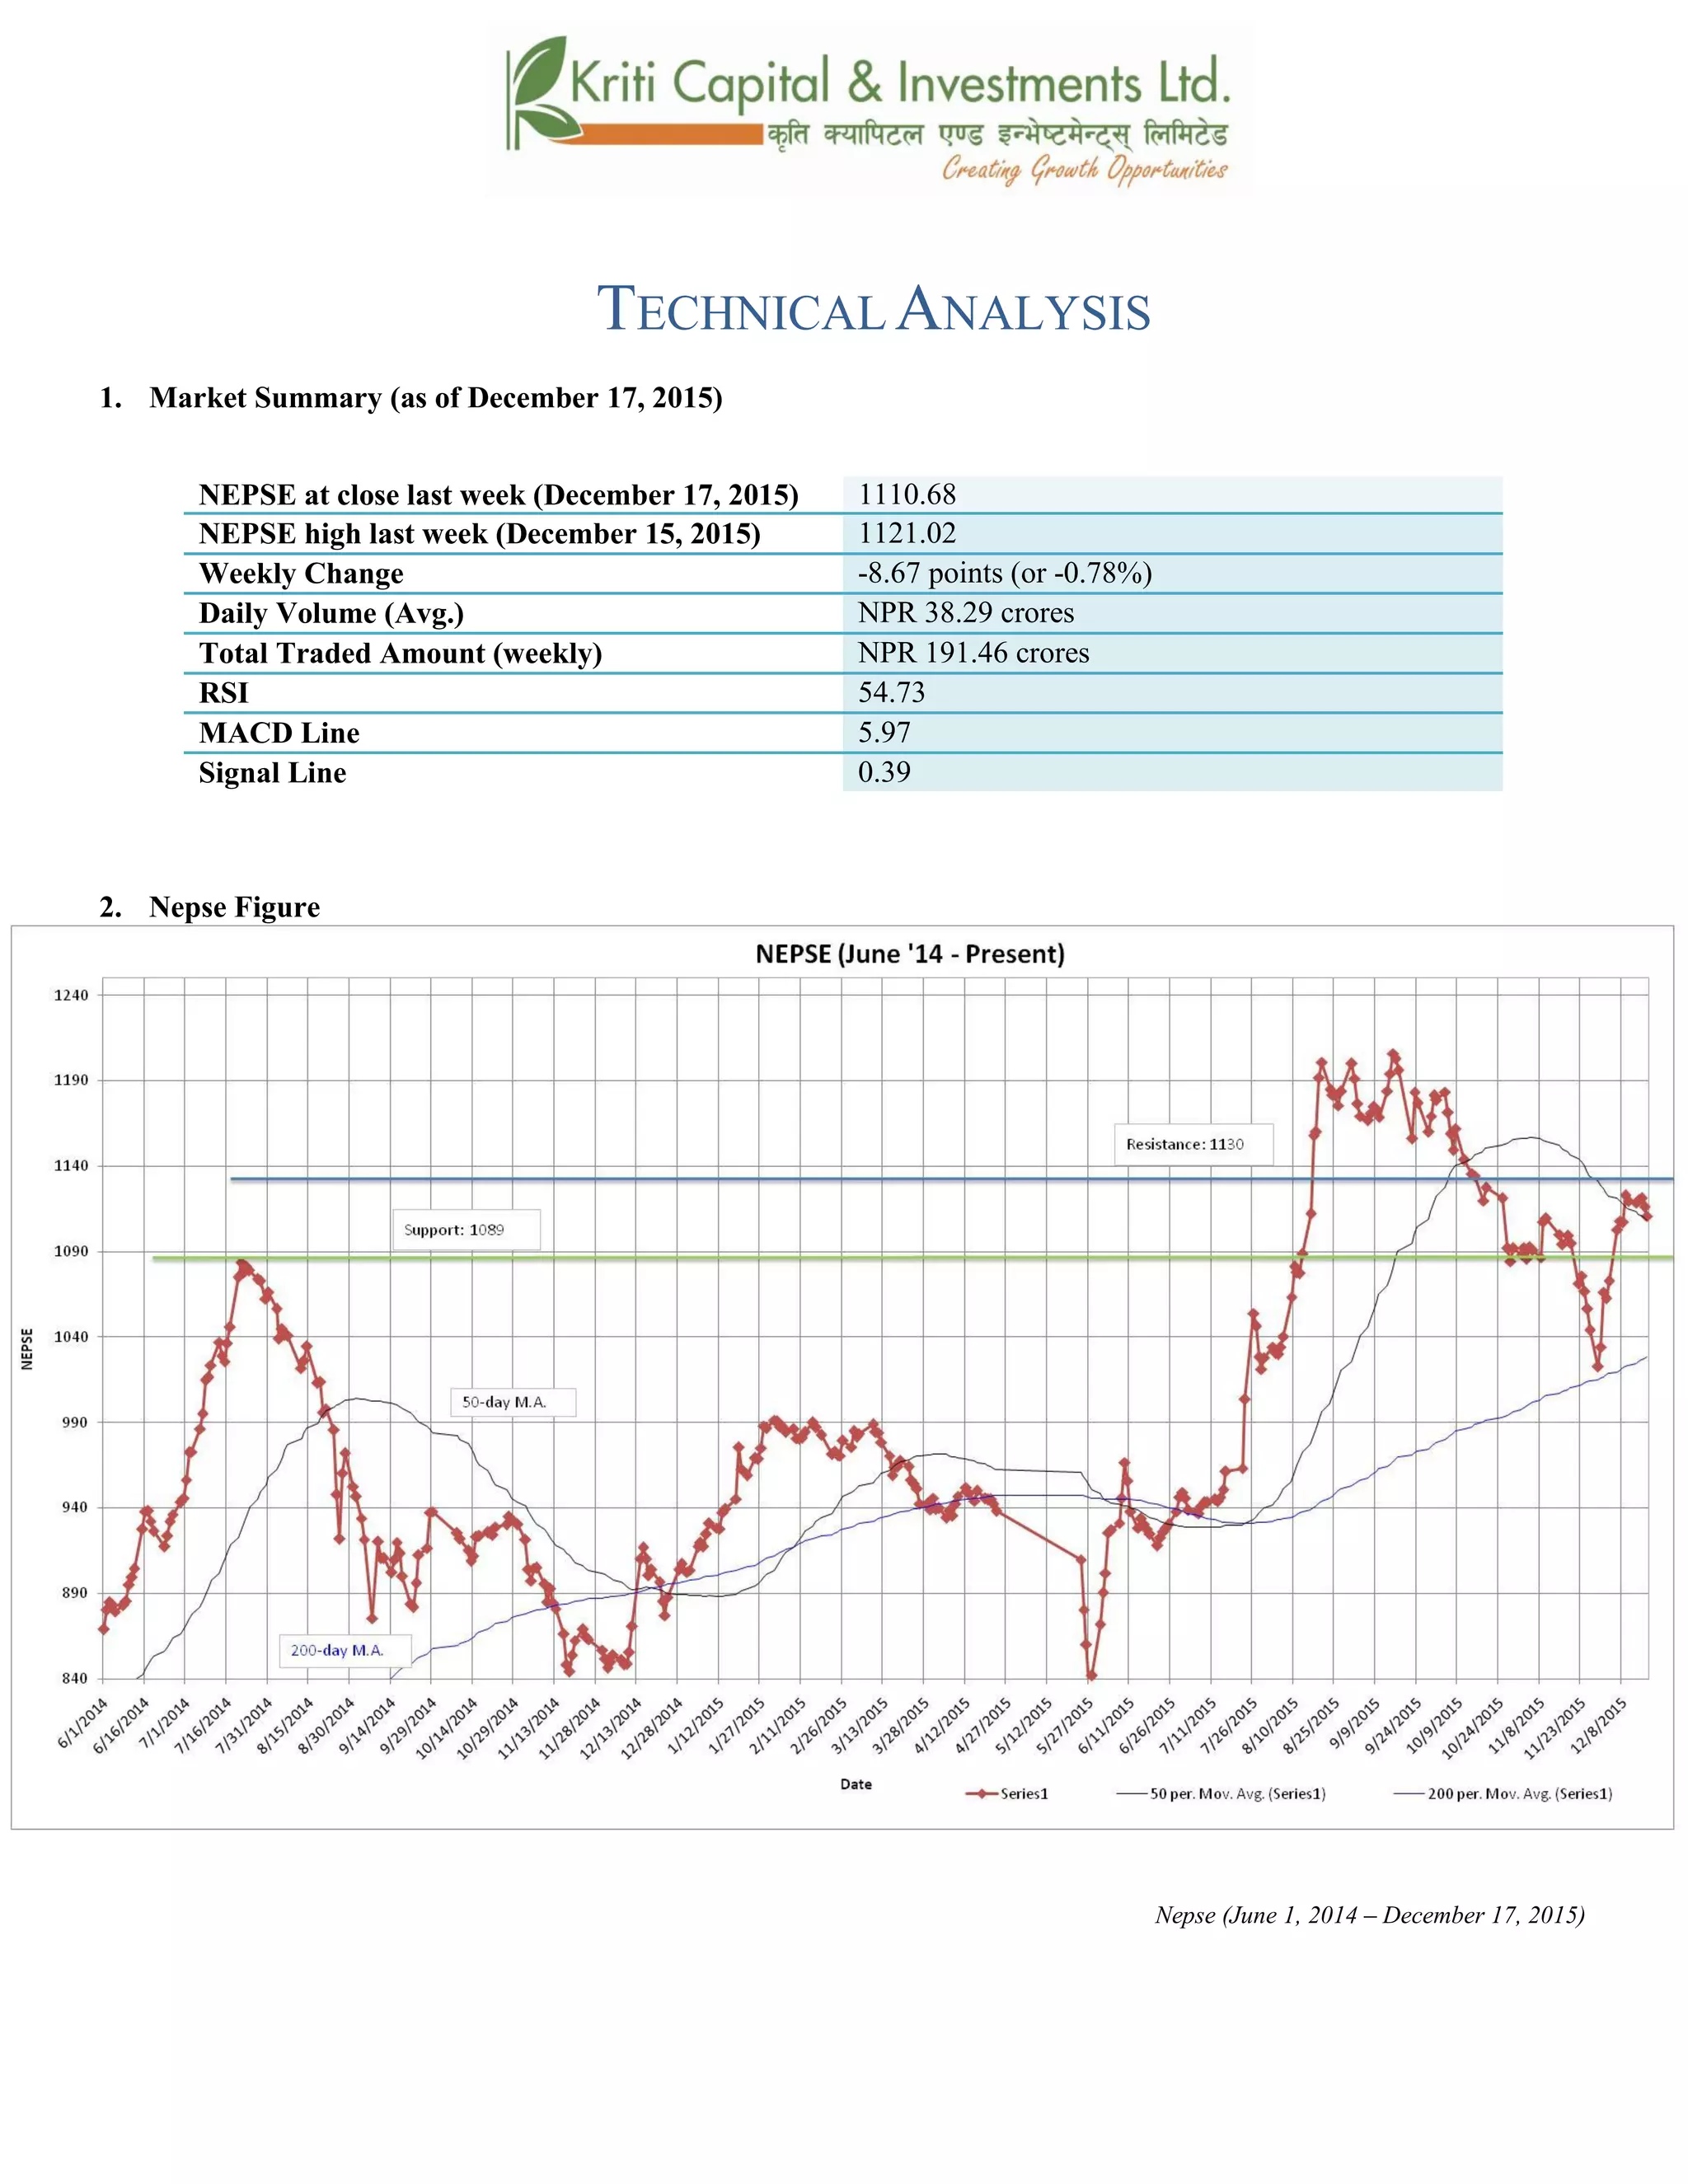
aGb cªs -kf}if@, @)&@_ !!!)=^*
pRr cªs -uPsf] ;ftf_ !!@!=)@
;fKtflxs kl/jt{g –*=^& -–)=&*k|ltzt_
b}lgscf};t Jofkf/ ¿=#*=@(s/f]8
s'n ;fKtflxsJofkf/ ¿ !(!=$^ s/f]8
cf/P;cfO{ %$=&#
PdP;L8L %=(&
l;UgnnfO{g )=#(
@_ ahf/ k|j[lt
Nepse (June 1, 2014 – December 17, 2015)](https://image.slidesharecdn.com/nepsetechnicalanalysisdecember13-december172015-151221061600/85/Nepse-Technical-Analysis-December-13-December-17-2015-5-320.jpg)
![#_ 6]«G8 ljZn]if0f
uPsf] ;ftf g]K;] kl/;"rsdfs]xLlu/fj6 b]lvof] . kl/;"rsn] *=^&cªsu'dfof] . uPsf] ;ftf kl/;"rsdf
/fhgLltsl:yltssf] c;/ vf;} b]lvPg . xfnsf]cj:yfdfclxn] klg kl/;"rs %) lbg] d'leËPe/]h
eGbfdflyrln/x]sf] cj:yf /x]sf] 5h;n] ;du|dfahf/sf] l:yltdf clxn] klg s]xLdfqfdfa'lnz 6]«G8 /x]sf]
;+s]t ub{5 . %) lbg] tyf @)) lbg] d'leËPe/]h Ps csf{sf] glhscfPsf] cj:yfn] ahf/dfcl:y/tf
s]xLsdePsf] ;+s]t ub{5 . ;fy} ahf/dfOG:of]/]G; If]qdfk"FhL a[l4 x'g ;Sg] ;dfrf/n] ;f] If]qdfsfdug]{
sDkgLx?sf] z]o/ lsGgnufgLstf{x? dfemxf]8afhL b]lvof] / n3'ljQ ljsf; a}+sx?
tkm{klgnufgLstfx?sf] hf]z lgs} g} b]vfk/] .
$_ 6]jftyfk|lt/f]w cªs
glhssf] 6]jfcªs !)*(
6]jfcªs @ !)@)
glhssf] k|lt/f]w cªs !!#)
xfnsf] cj:yf g]K;] kl/;"rsglhssf] 6]jfcªstyfk|lt/f]w cªssf] aLrdfrln/x]sf] l:Ylt /xof] . OG:of]/]G;
If]q tyf n3'ljQ If]qdf b]lvPsf] pT;fx ;Fu} kl/;"rsdf ;fO{8j]h d'ed]G6 b]lvof] . clxn] klgb]zsf]
/fhgLlts l:yltdf s]xL ;'wf/ b]lvPdf g]K;] kl/;"rsn] cfkmgf] k|lt/f]w cªssf] l;dfx? Kff/ ug{ ;Sg]
;+Defjgfalnof] 5 .
%_ g]K;] 6]«G8 ;"rs
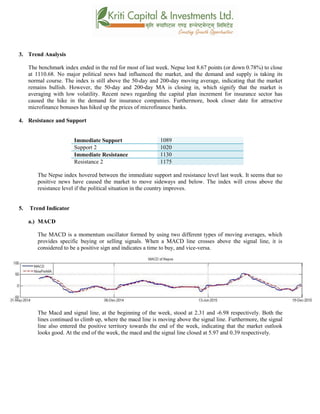
s_ d'leª Pe/]hsGeh]{G; 8fOeh]{G; -PdP;L8L_
PdP;L8Ldf b'O{ cf]6f /]vf x'G5g, h;df Pp6fn] ahf/sf] lbzf kl/jt{gsf] ;+s]t u5{ eg] csf]{n] ahf/sf]
k|j[lQ -6«]08_ b]vfpg] u5{ . olb PdP;L8L /]vfn] l;Ung /]vfnfO{ tnaf6 dfly sf6]dfo;nfO{ ;sf/fTds
;+s]tsf ?kdflnO{G5 / o;n] z]o/x? lsGg] ;+s]t ub{5 .
uPsf] ;ftf z'?sf] lbgdf PdP;L8L nfO{g l;UngnfO{gs|dzM@=#!tyf –^=(*cªsdf /x]sf] lyof] .
b'j} nfO{gx? dflylt/ nDsg] s|dhf/L /xof] h;sf] kmn:j?k PdP;L8L nfO{g l;UgnnfO{g eGbfdfly
/x]sf] cj:yf /xof] . ;fy} l;UgnnfO{g ;d]t C0ffTds If]qnfO{ 5f8L dflycfPsf] cj:yfn]
;du|dfahf/sf] l:ylt /fd|f] /x]sf] ;+s]t ub{5 . ;ftfsf] cGtodf PdP;L8L tyfl;UngnfO{g s|dzM
%=(&tyf)=#(sf] l:yltdf /xguof] .](https://image.slidesharecdn.com/nepsetechnicalanalysisdecember13-december172015-151221061600/85/Nepse-Technical-Analysis-December-13-December-17-2015-6-320.jpg)
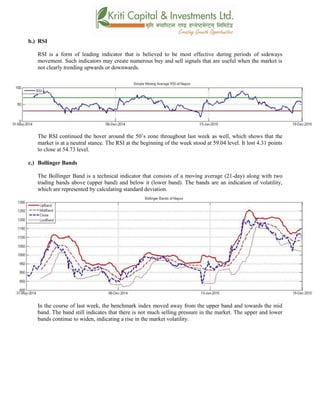
![v_ l/n]l6j :6«]Gy OG8]S; -cf/P;cfO{_
cf/P;cfO{ k|fljlwsljZn]if0fsf] o:tf] cf}hf/ xf], h;nfO{ Pstlkm{ ?kdfrln/x]sf] ahf/dfJofkf/ /0fgLlt
agfpg a9L pkof]uL dflgG5 . To;}u/L, o;n] ahf/dfvl/b / ljlqmsf] :ki6 ;+s]t b]vfpg] u5{ .
uPsf] ;ftfsf]w]/} h;f] lbgx? cf/P;cfO{ %) cªssf] xf/fxf/L rln/x]sf] cj:yf /xof] h;n] ahf/ cf]e/
;]nsf] l:yltaf6 6f9fcfO{ Go6«ncj:yfdfkms]{sf] 5 . b]zsf] /fhgLlts l:yltdf cem} s]xL ;'wf/
b]lvPdfahf/ km]l/ dflyhfg ;Sg] ;+Defjgfalnof] /xof] . ;ftfsf] cGTolt/ $=#!cªssf] lu/fj6 ;Fu}
cf/P;cfO{ %$=&#cªsdfaGbeof] .
u_ af]lnªu/ Aof08
af]lnªu/ Aof08 Ps k|fljlwsljZn]if0f ;"rsxf] h;df @!–lbg] d'leËPe/]hsf ;fyb'O{ Aof08 -Pp6f
dfly_ / Pp6f tn_ x'G5g . lo Aof08x?n] cl:y/tfsf] ;+s]t ub{5g, h'g :6fG88{ 8]leP;g u0fgf
u/]/ kQfnufO{G5 .
g]K;] kl/;"rsuPsf] ;ftfpkNnf] Jof08nfO{ 5f8L dWo Jof08 glhscfPsf] cj:yf /xof] . xfnsf]
cj:yfdf a]Rg] xf]8afhLdf s]xLsdLcfPsf] ;+s]t ub{5 . ;fy} pkNnf] tyftNnf] Jof08 aLr a9g
uPsf] b'/Ln] ;d]t xfnsf] cj:yfdfcl:y/tf s]xL a9]sf] ;+s]t ub{5 .](https://image.slidesharecdn.com/nepsetechnicalanalysisdecember13-december172015-151221061600/85/Nepse-Technical-Analysis-December-13-December-17-2015-7-320.jpg)
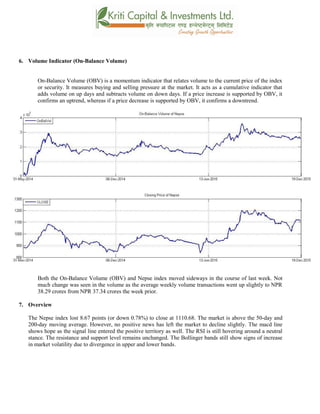
![;du{dfM
uPsf] ;ftf g]K;] kl/;"rsdf*=^&cªslu/fj6 dxz'; ul/of] . xfn kl/;"rs %) lbg] d'leËPe/]h
eGbfdflyrln/x]sf] cj:yfn] ahf/df km]l/ a'lnz 6]«G8 cfpg ;Sg] ;+Defjgf b]vf k/]sf] 5 . cem} klg
/fhgLltstxdf s]xL ;'wf/ gb]lvPsf] x'Fbfahf/ vf;} dflyhfg ;s]sf] l:ylt 5}g . PdP;L8L nfO{g ;Fu}
l;UgnnfO{g klg;sf/fTds If]q lt/ k|j]z u/]sf]n] ahf/df s]xLcfzfx? km]l/ b]lvPsf 5g .cf/P;cfO{n]
ahf/ cf]e/ ;]n l:yltnfO{ 5f8L Go"6«n cj:ydfkms]{sf] ;+s]t ub{5 . ;fy} af]lnªu/ Aof08n]
kl/;"rsdflyNnf] Jof08sf] glhsk'u]sf] cj:yfn] ahf/sf] cl:y/tf s]xL a9]sf] ;+s]t ub{5 .](https://image.slidesharecdn.com/nepsetechnicalanalysisdecember13-december172015-151221061600/85/Nepse-Technical-Analysis-December-13-December-17-2015-8-320.jpg)

The Nepse index closed down 0.78% last week at 1110.68 points. The market remains bullish as the index is above its 50-day and 200-day moving averages, however volatility has increased slightly as the moving averages are converging. The MACD and RSI indicators show the market outlook is stable, while resistance and support levels were unchanged. Trading volume was slightly higher than the previous week.


