Download to read offline


![k|fljlwsljZn]if0f
!_ahf/ ;f/f+z -ebf}(, @)&#;Ddsf]_
aGb cªs -ebf}(, @)&#_ !&#)=^@
pRr cªs -uPsf] ;ftf_ !&#)=^@
;fKtflxs kl/jt{g –$=$$ -–)=!(k|ltzt_
b}lgscf};t Jofkf/ ¿=*^=#&s/f]8
s'n ;fKtflxsJofkf/ ¿ #$%=%) s/f]8
cf/P;cfO{ $*=^&
PdP;L8L –!!=!%
l;UgnnfO{g )=)^
@_ ahf/ k|j[lt
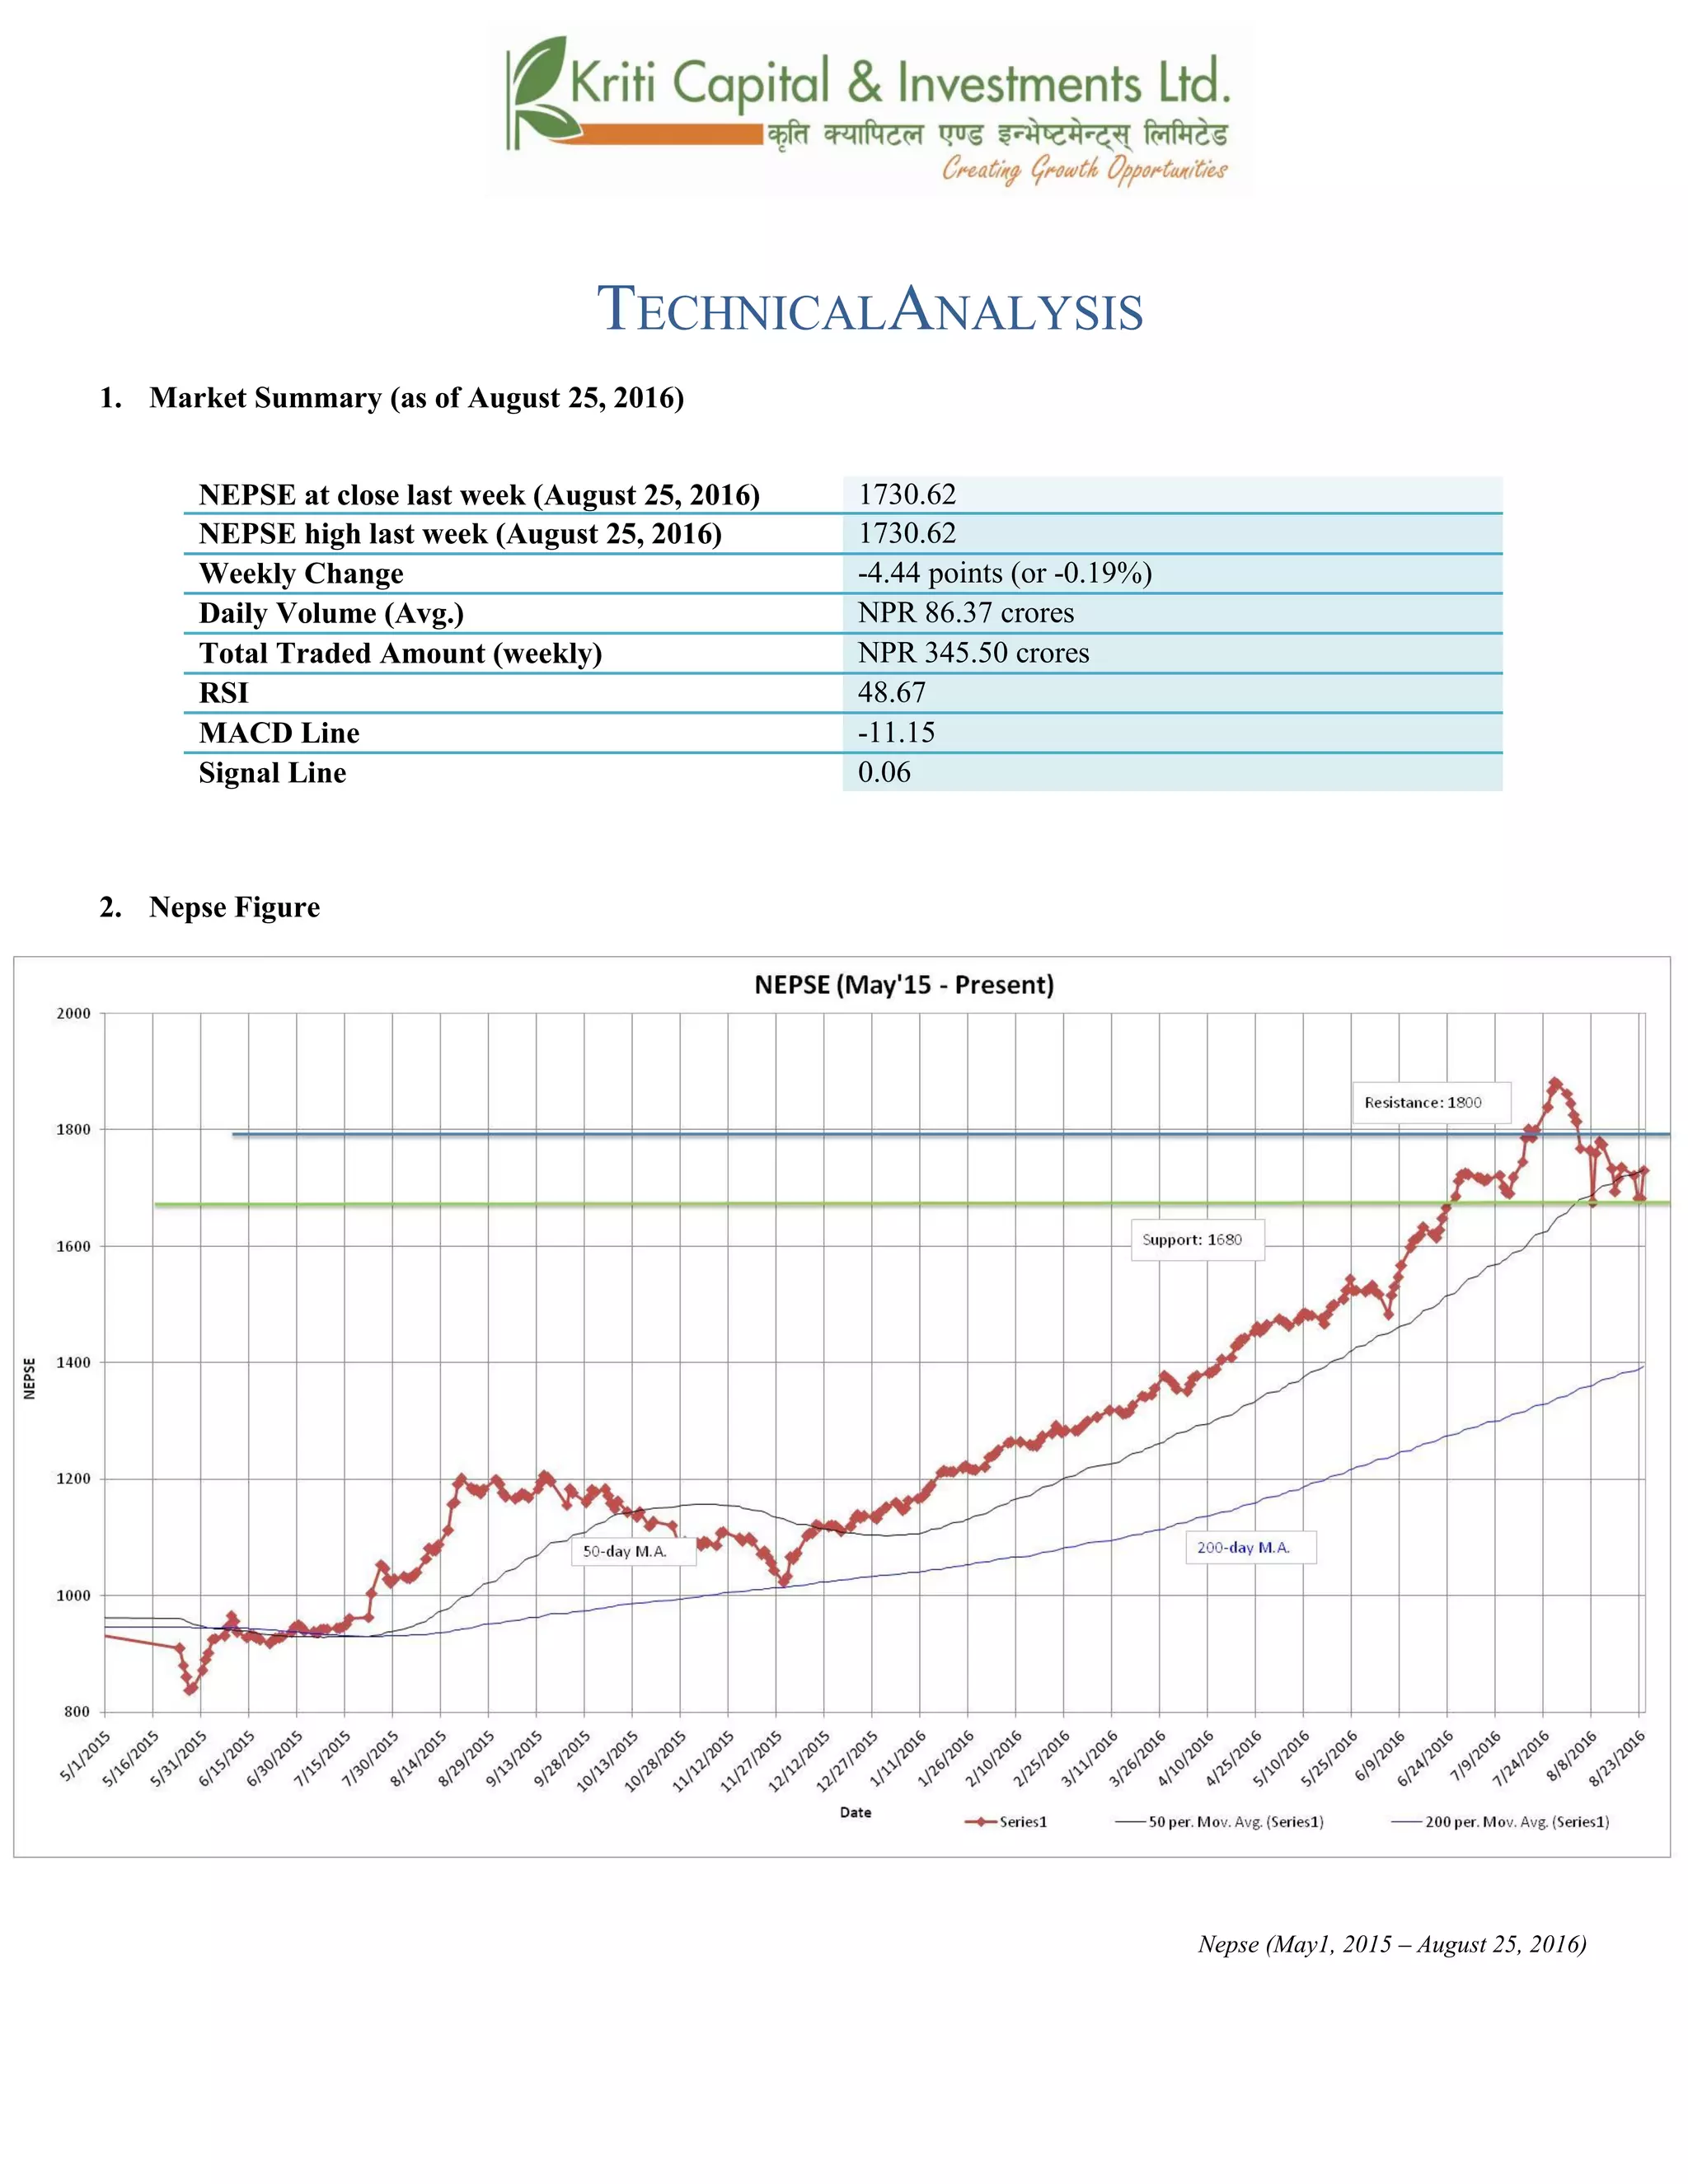
Nepse (May1, 2015 – August 25, 2016)](https://image.slidesharecdn.com/nepsetechnicalanalysis21august-25august2016-160830043617/85/Nepse-Technical-Analysis-21-August-25-August-2016-5-320.jpg)
![#_ 6]«G8 ljZn]if0f
uPsf] ;ftfg]K;] kl/;"rsdf$=$$cªssf] lu/fj6 b]lvof]h;sf] kmn:j?kahf/ !,&#)=^@cªsdfaGbeof] .
;ftfsf] w]/} h;f] lbg 36]sf] ahf/ ;ftfsf] clGtdlbg $*=&^ cªs a9]sf] cj:yf /xof] h;n] ahf/df
km]l/ s]xLlx;fan] a'lnz l:yltdf b]lvG5 . t/ ;du|dfclxn] klg kl/;"rs %) lbg] d'leËPe/]h tyf @))
lbg] d'leËeGbfdfly g} rln/x]sf] cj:yfn] ;du|dfahf/sf] l:ylt /fd|f] b]lvG5 . xfnsf] cj:yfdf %) lbg]
d'leËPe/]h Pp6f alnof] 6]jfcªssf] ?kdf b]lvPsf] 5 .
$_ 6]jftyfk|lt/f]w cªs
glhssf] 6]jfcªs !^*)
6]jfcªs @ !^))
glhssf] k|lt/f]w cªs !*))
uPsf] ;ftf g]K;] kl/;"rscfkmgf] glhssf] 6]jfcªs!&@#eGbftnuPsf] cj:yf /xof] . t/ ;f] 6]jfcªsnfO{
g]K;]n] t'?Gtk|fKt u/]sf] cj:yf /xof] . uPsf] ;ftf g]K;] kl/;"rsdflgs} g} cl:yt/tf b]lvof] . xfnsf]
nflugofF 6]jfcªstyfk|lt/f]w cªss|dzM !^*) tyf !*)) /x]sf] 5 .
%_ g]K;] 6]«G8 ;"rs
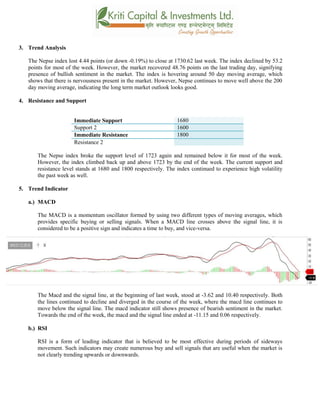
s_ d'leª Pe/]hsGeh]{G; 8fOeh]{G; -PdP;L8L_
PdP;L8Ldf b'O{ cf]6f /]vf x'G5g, h;df Pp6fn] ahf/sf] lbzf kl/jt{gsf] ;+s]t u5{ eg] csf]{n] ahf/sf]
k|j[lQ -6«]08_ b]vfpg] u5{ . olb PdP;L8L /]vfn] l;Ung /]vfnfO{ tnaf6 dfly sf6]dfo;nfO{ ;sf/fTds
;+s]tsf ?kdflnO{G5 / o;n] z]o/x? lsGg] ;+s]t ub{5 .
uPsf] ;ftfsf] z'?df PdP;L8L nfO{gtyfl;UgnnfO{g s|dzM–#=^@tyf!)=$!sf] l:yltdf /x]sf] lyof] . t/
;ftfsf] afFsLlbgx?df PdP;L8L nfO{g l;UgnnfO{g eGbftn g} /x]sf] cj:yf /x]sf] 5 h;n] xfnahf/
a'lnz 6]«G8df /x]sf] ;+s]t ub{5 / ;ftfsf] lu/fj6 ;Fu} PdP;L8L nfO{g C0ffTds If]qdfk|j]z u/]sf] 5 .
;ftfsf] cGTodf PdP;L8L nfO{g tyfl;UgnnfO{g s|dzM–!!=!%tyf)=)^sf] l:yltdf /x]sf] lyof] .](https://image.slidesharecdn.com/nepsetechnicalanalysis21august-25august2016-160830043617/85/Nepse-Technical-Analysis-21-August-25-August-2016-6-320.jpg)
![v_ l/n]l6j :6«]Gy OG8]S; -cf/P;cfO{_
cf/P;cfO{ k|fljlwsljZn]if0fsf] o:tf] cf}hf/ xf], h;nfO{ Pstlkm{ ?kdfrln/x]sf] ahf/dfJofkf/ /0fgLlt
agfpg a9L pkof]uL dflgG5 . To;}u/L, o;n] ahf/dfvl/b / ljlqmsf] :ki6 ;+s]t b]vfpg] u5{ .
cf/P;cfO{uPsf] ;ftfsf] z'?df$%=*)cªsdf/x]sf] lyof]tyf ;ftfsf] cGTolt/ cf/P;cfO{ $&=%#cªsdf
/xof].h;n] ahf/dfa]Rg]xf]8afhLsf] ;+s]t ub{5 . &) cªseGbflgs} tnem/]sf]] cf/P;cfO{ clxn] ahf/df
a]Rg] xf]8afhL a9]sf] ;+s]t ub{5 .
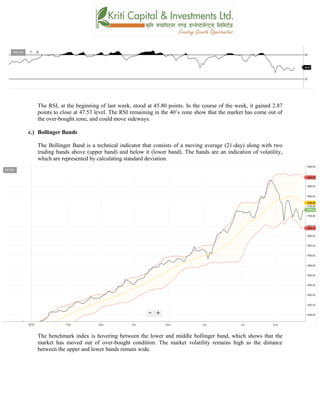
u_ af]lnªu/ Aof08
af]lnªu/ Aof08 Ps k|fljlwsljZn]if0f ;"rsxf] h;df @!–lbg] d'leËPe/]hsf ;fyb'O{ Aof08 -Pp6f
dfly_ / Pp6f tn_ x'G5g . lo Aof08x?n] cl:y/tfsf] ;+s]t ub{5g, h'g :6fG88{ 8]leP;g u0fgf
u/]/ kQfnufO{G5 .](https://image.slidesharecdn.com/nepsetechnicalanalysis21august-25august2016-160830043617/85/Nepse-Technical-Analysis-21-August-25-August-2016-7-320.jpg)
![g]K;] kl/;"rsuPsf] ;ftfpkNnf] Jof08eGbf k/ uPsf] cj:yfn] ahf/ cf]e/ a6 l:ylt af6 aflx/
cfPsf] ;+s]t ub{5 . pkNnf] tyftNnf] Jof08 aLrsf] b'/LdfcfPsf] a[l4n]cl:yt/tfeg] a9]sf] ;+s]t
ub{5 .
;du{dfM
uPsf] ;ftf g]K;] kl/;"rsdf$=$$cªssf] lu/fj6 b]lvof]h;sf] kmn:j?kahf/ !&#)=^@cªsdfaGbeof] .
clxn] klg kl/;"rs %) lbg] d'leËPe/]h tyf @)) lbg] d'leËeGbfdflyuO{/x]sf] cj:yfn] ahf/ ;sf/fTds
l:yltdf g} /x]sf] ;+s]t ub{5 . PdP;L8L nfO{gl;UgnnfO{g eGbftncfPsf]cj:yfn] ahf/dflsGg] xf]8afhLdf
sdLcfPsf] b]lvG5 . &) cªseGbflgs} tnem/]sf]] cf/P;cfO{n] ahf/ cf]e/ a6 l:yltaflx/ cfPsf] ;+s]t
ub{5 . pkNnf] tyftNnf] Jof08 aLrsf] b'/Ldfb]lvPsf] a[l4n] ahf/sf] cl:y/tfdfeg]a[l4 ePsf] ;+s]t ub{5
.xfnsf] cj:yfdfgofF 6]jfcªstyfk|lt/f]w cªs s||dzM !^*) tyf !*)) g} sfod /x]sf] 5 . ;du|df x]bf{
ahf/ laol/; l:yltdf /x]sf] ;+s]t ub{5 .](https://image.slidesharecdn.com/nepsetechnicalanalysis21august-25august2016-160830043617/85/Nepse-Technical-Analysis-21-August-25-August-2016-8-320.jpg)

- The Nepse index fell 0.19% last week to close at 1730.62 points, recovering from losses earlier in the week. - Short-term market sentiment appears nervous as the index hovers around the 50-day moving average, but the long-term outlook remains positive as it stays above the 200-day average. - Key support and resistance levels are now seen at 1680 and 1800 points respectively. - Technical indicators like MACD and RSI show the market has reduced buying pressure and come out of an overbought state, while volatility, as measured by bollinger bands, remains high.


