Download to read offline
![k|fljlwsljZn]if0f
!_ahf/ ;f/f+z -ebf}@, @)&#;Ddsf]_
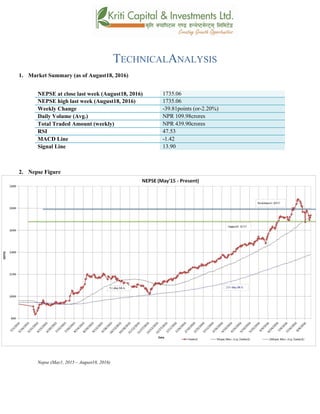
aGb cªs -ebf}@, @)&#_ !&#%=)^
pRr cªs -uPsf] ;ftf_ !&#%=)^
;fKtflxs kl/jt{g –#(=*! -–@=@)k|ltzt_
b}lgscf};t Jofkf/ ¿=!)(=(*s/f]8
s'n ;fKtflxsJofkf/ ¿ $#(=() s/f]8
cf/P;cfO{ $&=%#
PdP;L8L –!=$@
l;UgnnfO{g !#=()
@_ ahf/ k|j[lt
Nepse (May 1, 2015 – August 18, 2016)](https://image.slidesharecdn.com/nepsetechnicalanalysisaugust14-august182016-160823042809/85/Nepse-Technical-Analysis-August-14-August-18-2016-4-320.jpg)
![#_ 6]«G8 ljZn]if0f
uPsf] ;ftfg]K;] kl/;"rsdf#(=*!cªssf] lu/fj6 b]lvof]h;sf] kmn:j?kahf/ !,&#%=)^cªsdfaGbeof] .
uPsf] ;ftf g]K;] kl/;"rsdfef/L lu/fj6 b]lvof] h;nfO{ ljleGgnufgLstf{x?n] ;fdfGoahf/ s/]S;gsf]
;+1f lbP t/ g]K;]n] ;ftfsf] afFsLlbgx?df $)=@% cªs a6'Nof] . t/ ;du|dfclxn] klg kl/;"rs %) lbg]
d'leËPe/]h tyf @)) lbg] d'leËeGbfdfly g} rln/x]sf] cj:yfn] ;du|dfahf/sf] l:ylt /fd|f] b]lvG5
.xfnsf] cj:yfdf%) lbg] d'leËPe/]h Pp6f alnof] 6]jfcªssf] ?kdf b]lvPsf] 5 .
$_ 6]jftyfk|lt/f]w cªs
glhssf] 6]jfcªs !^()
6]jfcªs @ !&@#
glhssf] k|lt/f]w cªs !*))
uPsf] ;ftf g]K;] kl/;"rscfkmgf] glhssf] 6]jfcªs !&@# eGbftnuPsf] cj:yf /xof] . t/ ;f] 6]jfcªsnfO{
g]K;]n] t'?Gtk|fKt u/]sf] cj:yf /xof] . uPsf] ;ftf g]K;] kl/;"rsdflgs} g} cl:yt/tf b]lvof] . xfnsf]
nflugofF 6]jfcªstyfk|lt/f]w cªss|dzM !^() tyf !*)) /x]sf] 5 .
%_ g]K;] 6]«G8 ;"rs
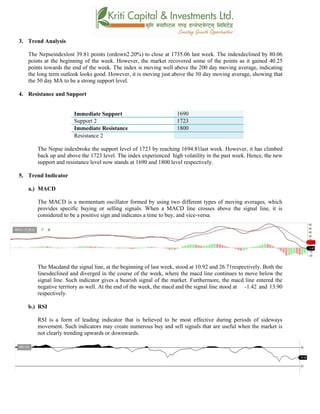
s_ d'leª Pe/]hsGeh]{G; 8fOeh]{G; -PdP;L8L_
PdP;L8Ldf b'O{ cf]6f /]vf x'G5g, h;df Pp6fn] ahf/sf] lbzf kl/jt{gsf] ;+s]t u5{ eg] csf]{n] ahf/sf]
k|j[lQ -6«]08_ b]vfpg] u5{ . olb PdP;L8L /]vfn] l;Ung /]vfnfO{ tnaf6 dfly sf6]dfo;nfO{ ;sf/fTds
;+s]tsf ?kdflnO{G5 / o;n] z]o/x? lsGg] ;+s]t ub{5 .
uPsf] ;ftfsf] z'?df PdP;L8L nfO{gtyfl;UgnnfO{g s|dzM!)=(@tyf@^=&!sf] l:yltdf /x]sf] lyof] . t/
;ftfsf] afFsLlbgx?dfPdP;L8L nfO{g l;UgnnfO{geGbftn g} /x]sf] cj:yf /x]sf] 5 h;n] xfnahf/
a'lnz 6]«G8df /x]sf] ;+s]t ub{5 / ;ftfsf] lu/fj6 ;Fu} PdP;L8L nfO{g C0ffTds If]qdfk|j]z u/]sf] 5 .
;ftfsf] cGTodf PdP;L8L nfO{g tyfl;UgnnfO{g s|dzM–!=$@tyf!#=()sf] l:yltdf /x]sf] lyof] .](https://image.slidesharecdn.com/nepsetechnicalanalysisaugust14-august182016-160823042809/85/Nepse-Technical-Analysis-August-14-August-18-2016-5-320.jpg)
![v_ l/n]l6j :6«]Gy OG8]S; -cf/P;cfO{_
cf/P;cfO{ k|fljlwsljZn]if0fsf] o:tf] cf}hf/ xf], h;nfO{ Pstlkm{ ?kdfrln/x]sf] ahf/dfJofkf/ /0fgLlt
agfpg a9L pkof]uL dflgG5 . To;}u/L, o;n] ahf/dfvl/b / ljlqmsf] :ki6 ;+s]t b]vfpg] u5{ .
cf/P;cfO{uPsf] ;ftfsf] z'?df$^=)^cªsdf/x]sf] lyof]tyf ;ftfsf] cGTolt/ cf/P;cfO{ $&=%#cªsdf
/xof].h;n] ahf/dfa]Rg]xf]8afhLsf] ;+s]t ub{5 . &) cªseGbflgs} tnem/]sf]] cf/P;cfO{ clxn] ahf/df
a]Rg] xf]8afhL a9]sf] ;+s]t ub{5 .
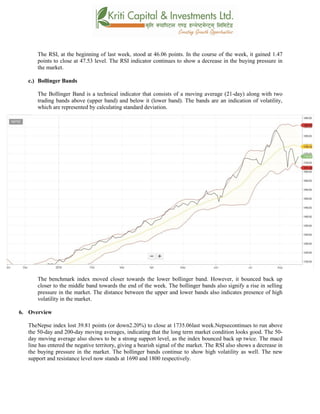
u_ af]lnªu/ Aof08
af]lnªu/ Aof08 Ps k|fljlwsljZn]if0f ;"rsxf] h;df @!–lbg] d'leËPe/]hsf ;fyb'O{ Aof08 -Pp6f
dfly_ / Pp6f tn_ x'G5g . lo Aof08x?n] cl:y/tfsf] ;+s]t ub{5g, h'g :6fG88{ 8]leP;g u0fgf
u/]/ kQfnufO{G5 .](https://image.slidesharecdn.com/nepsetechnicalanalysisaugust14-august182016-160823042809/85/Nepse-Technical-Analysis-August-14-August-18-2016-6-320.jpg)
![g]K;] kl/;"rsuPsf] ;ftfpkNnf] Jof08eGbf k/ uPsf] cj:yfn] ahf/ cf]e/ a6 l:ylt af6 aflx/
cfPsf] ;+s]t ub{5 . pkNnf] tyftNnf] Jof08 aLrsf] b'/LdfcfPsf] a[l4n]cl:yt/tfeg] a9]sf] ;+s]t
ub{5 .
;du{dfM
uPsf] ;ftf g]K;] kl/;"rsdf#(=*!cªssf] lu/fj6 b]lvof]h;sf] kmn:j?kahf/ !&#%=)^cªsdfaGbeof] .
clxn] klg kl/;"rs %) lbg] d'leËPe/]h tyf @)) lbg] d'leËeGbfdflyuO{/x]sf] cj:yfn] ahf/ ;sf/fTds
l:yltdf g} /x]sf] ;+s]t ub{5 . PdP;L8L nfO{gl;UgnnfO{g eGbftncfPsf]cj:yfn] ahf/dflsGg] xf]8afhLdf
sdLcfPsf] b]lvG5 . &) cªseGbflgs} tnem/]sf]] cf/P;cfO{n] ahf/ cf]e/ a6 l:yltaflx/ cfPsf] ;+s]t
ub{5 . pkNnf] tyftNnf] Jof08 aLrsf] b'/Ldfb]lvPsf] a[l4n] ahf/sf] cl:y/tfdfeg]a[l4 ePsf] ;+s]t ub{5
.xfnsf] cj:yfdfgofF 6]jfcªstyfk|lt/f]w cªs s||dzM !^() tyf !*)) g} sfod /x]sf] 5 . ;du|df x]bf{
ahf/ laol/; l:yltdf /x]sf] ;+s]t ub{5 .](https://image.slidesharecdn.com/nepsetechnicalanalysisaugust14-august182016-160823042809/85/Nepse-Technical-Analysis-August-14-August-18-2016-7-320.jpg)

The Nepse index lost 39.81 points (or 2.20%) last week to close at 1735.06. The index is above its 50-day and 200-day moving averages, indicating a positive long-term outlook. However, technical indicators like MACD, RSI, and Bollinger bands signal increased volatility and declining buying pressure in the market. The new support and resistance levels are 1690 and 1800 respectively. Overall, the market remains in a consolidation phase.


