Download to read offline
![k|fljlwsljZn]if0f
!_ahf/ ;f/f+z -;fpg@), @)&#;Ddsf]_
aGb cªs -;fpg@), @)&#_ !&^*=^)
pRr cªs -uPsf] ;ftf_ !*^@=&^
;fKtflxs kl/jt{g –!)(=## -–%=(%k|ltzt_
b}lgscf};t Jofkf/ ¿=!%^=!)s/f]8
s'n ;fKtflxsJofkf/ ¿ &*)=%! s/f]8
cf/P;cfO{ %)=$*
PdP;L8L $@=^*
l;UgnnfO{g %!=*@
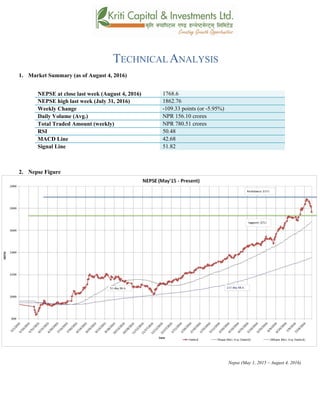
@_ ahf/ k|j[lt
Nepse (May 1, 2015 – August 4, 2016)](https://image.slidesharecdn.com/nepsetechnicalanalysisjuly31-august32016-160808043631/85/Nepse-Technical-Analysis-july-31-August-3-2016-4-320.jpg)
![#_ 6]«G8 ljZn]if0f
uPsf] ;ftfg]K;] kl/;"rsdf!)(=##cªssf] ef/L lu/fj6 b]lvof]h;sf] kmn:j?kahf/
!,&^*=^)cªsdfaGbeof] . ;/sf/ kl/jt{g sf] sf/0f nufgLstf{x? dfempT;fxdf s]xLsdLcfPsf] b]lvG5
. t/ ;du|dfclxn] klg kl/;"rs %) lbg] d'leËPe/]h tyf @)) lbg] d'leËeGbfdfly g} rln/x]sf] cj:yf
;du|dfahf/sf] l:ylt /fd|f] b]lvG5 .
$_ 6]jftyfk|lt/f]w cªs
glhssf] 6]jfcªs !&@#
6]jfcªs @ !^))
glhssf] k|lt/f]w cªs !())
uPsf] ;ftf g]K;] kl/;"rsn]cfkmgf} Oltxf; s} pRrcªs !**!=$% nfO{ 5f]O{ t/ em/]sf] cj:yf /xof] . t/
clxn] klggofFglhssf] k|lt/f]w cªs !()) tyf 6]jfcªs !&@# g} /x]sf] cj:yf /x]sf] 5 . g]K;]
kl/;"rsclxn] klgglhssf] 6]jfcªseGbfdfly g} /x]sf] x'Fbfahf/ km]l/ dflycfpg ;Sg] ;+Defjgfalnof] g}
b]lvG5 .
%_ g]K;] 6]«G8 ;"rs
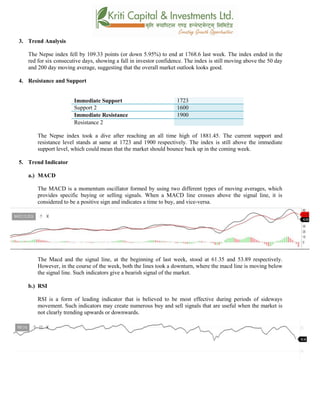
s_ d'leª Pe/]hsGeh]{G; 8fOeh]{G; -PdP;L8L_
PdP;L8Ldf b'O{ cf]6f /]vf x'G5g, h;df Pp6fn] ahf/sf] lbzf kl/jt{gsf] ;+s]t u5{ eg] csf]{n] ahf/sf]
k|j[lQ -6«]08_ b]vfpg] u5{ . olb PdP;L8L /]vfn] l;Ung /]vfnfO{ tnaf6 dfly sf6]dfo;nfO{ ;sf/fTds
;+s]tsf ?kdflnO{G5 / o;n] z]o/x? lsGg] ;+s]t ub{5 .
uPsf] ;ftfsf] z'?df PdP;L8L nfO{gtyfl;UgnnfO{g s|dzM^!=#%tyf%#=*(sf] l:yltdf /x]sf] lyof]t/
;ftfsf] afFsLlbgx?df b]lvPsf] ef/L lu/fj6 ;Fu} PdP;L8LnfO{g l;UgnnfO{g eGbftncfPsf] cj:yfn]
ahf/ laol/; l:yltdf cfPsf] ;+s]t ub{5 .](https://image.slidesharecdn.com/nepsetechnicalanalysisjuly31-august32016-160808043631/85/Nepse-Technical-Analysis-july-31-August-3-2016-5-320.jpg)
![v_ l/n]l6j :6«]Gy OG8]S; -cf/P;cfO{_
cf/P;cfO{ k|fljlwsljZn]if0fsf] o:tf] cf}hf/ xf], h;nfO{ Pstlkm{ ?kdfrln/x]sf] ahf/dfJofkf/ /0fgLlt
agfpg a9L pkof]uL dflgG5 . To;}u/L, o;n] ahf/dfvl/b / ljlqmsf] :ki6 ;+s]t b]vfpg] u5{ .
cf/P;cfO{uPsf] ;ftfsf] z'?df&&=$)cªsdf/x]sf] lyof]tyf ;ftfsf] cGTolt/ cf/P;cfO{ %)=$*cªsdf
/xof].h;n] ahf/dfa]Rg]xf]8afhLsf] ;+s]t ub{5 . &) cªseGbflgs} tnem/]sf]] cf/P;cfO{ clxn] ahf/df
a]Rg] xf]8afhL a9]sf] ;+s]t ub{5 .](https://image.slidesharecdn.com/nepsetechnicalanalysisjuly31-august32016-160808043631/85/Nepse-Technical-Analysis-july-31-August-3-2016-6-320.jpg)
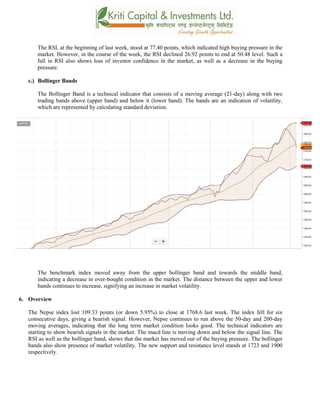
![u_ af]lnªu/ Aof08
af]lnªu/ Aof08 Ps k|fljlwsljZn]if0f ;"rsxf] h;df @!–lbg] d'leËPe/]hsf ;fyb'O{ Aof08 -Pp6f
dfly_ / Pp6f tn_ x'G5g . lo Aof08x?n] cl:y/tfsf] ;+s]t ub{5g, h'g :6fG88{ 8]leP;g u0fgf
u/]/ kQfnufO{G5 .
g]K;] kl/;"rsuPsf] ;ftfpkNnf] Jof08eGbf k/ uPsf] cj:yfn] ahf/ cf]e/ a6 l:ylt af6 aflx/
cfPsf] ;+s]t ub{5 . pkNnf] tyftNnf] Jof08 aLrsf] b'/LdfcfPsf] a[l4n] cl:yt/tfeg] a9]sf] ;+s]t
ub{5 .
;du{dfM
uPsf] ;ftf g]K;] kl/;"rsdf!)(=## cªssf] ef/L lu/fj6 b]lvof]h;sf] kmn:j?kahf/
!*^*=^cªsdfaGbeof] . clxn] klg kl/;"rs %) lbg] d'leËPe/]h tyf @)) lbg] d'leËeGbfdflyuO{/x]sf]
cj:yfn] ahf/ ;sf/fTds l:yltdf g} /x]sf] ;+s]t ub{5 . PdP;L8L nfO{gl;UgnnfO{g eGbftncfPsf]cj:yfn]
ahf/dflsGg] xf]8afhLdf sdLcfPsf] b]lvG5 . &) cªseGbflgs} tnem/]sf]] cf/P;cfO{n] ahf/ cf]e/ a6
l:yltaflx/ cfPsf] ;+s]t ub{5 . pkNnf] tyftNnf] Jof08 aLrsf] b'/L a9gfn] ahf/sf] cl:y/tfdfeg]a[l4
ePsf] ;+s]t ub{5 .xfnsf] cj:yfdfgofF 6]jfcªstyfk|lt/f]w cªs s||dzM !&@# tyf !()) g} sfod /x]sf] 5
. ;du|df x]bf{ ahf/ laol/; l:yltdf /x]sf] ;+s]t ub{5 .](https://image.slidesharecdn.com/nepsetechnicalanalysisjuly31-august32016-160808043631/85/Nepse-Technical-Analysis-july-31-August-3-2016-7-320.jpg)


1. The Nepse index fell 5.95% last week to close at 1768.6, falling for six consecutive days due to decreased investor confidence following a government change. However, the index remains above its 50-day and 200-day moving averages, suggesting an overall positive market outlook. 2. Technical indicators are now showing bearish signals, with the MACD line moving below the signal line and RSI declining to 50.48, indicating reduced buying pressure. Bollinger bands show the market moving out of overbought territory and increased volatility. 3. Immediate support and resistance levels for the index stand at 1723 and 1900 respectively, with the index currently above support. This suggests the market


