Download to read offline

![k|fljlwsljZn]if0f
!_ahf/ ;f/f+z -cfiff9 #), @)&#;Ddsf]_
aGb cªs -cfiff9 #), @)&#_ !&!*=!%
pRr cªs -uPsf] ;ftf_ !&@@=%#
;fKtflxs kl/jt{g @=$# -)=)#k|ltzt_
b}lgscf};t Jofkf/ ¿=!@!=!!s/f]8
s'n ;fKtflxsJofkf/ ¿ ^)%=%$ s/f]8
cf/P;cfO{ ^(=*#
PdP;L8L #^=^%
l;UgnnfO{g $#=$(
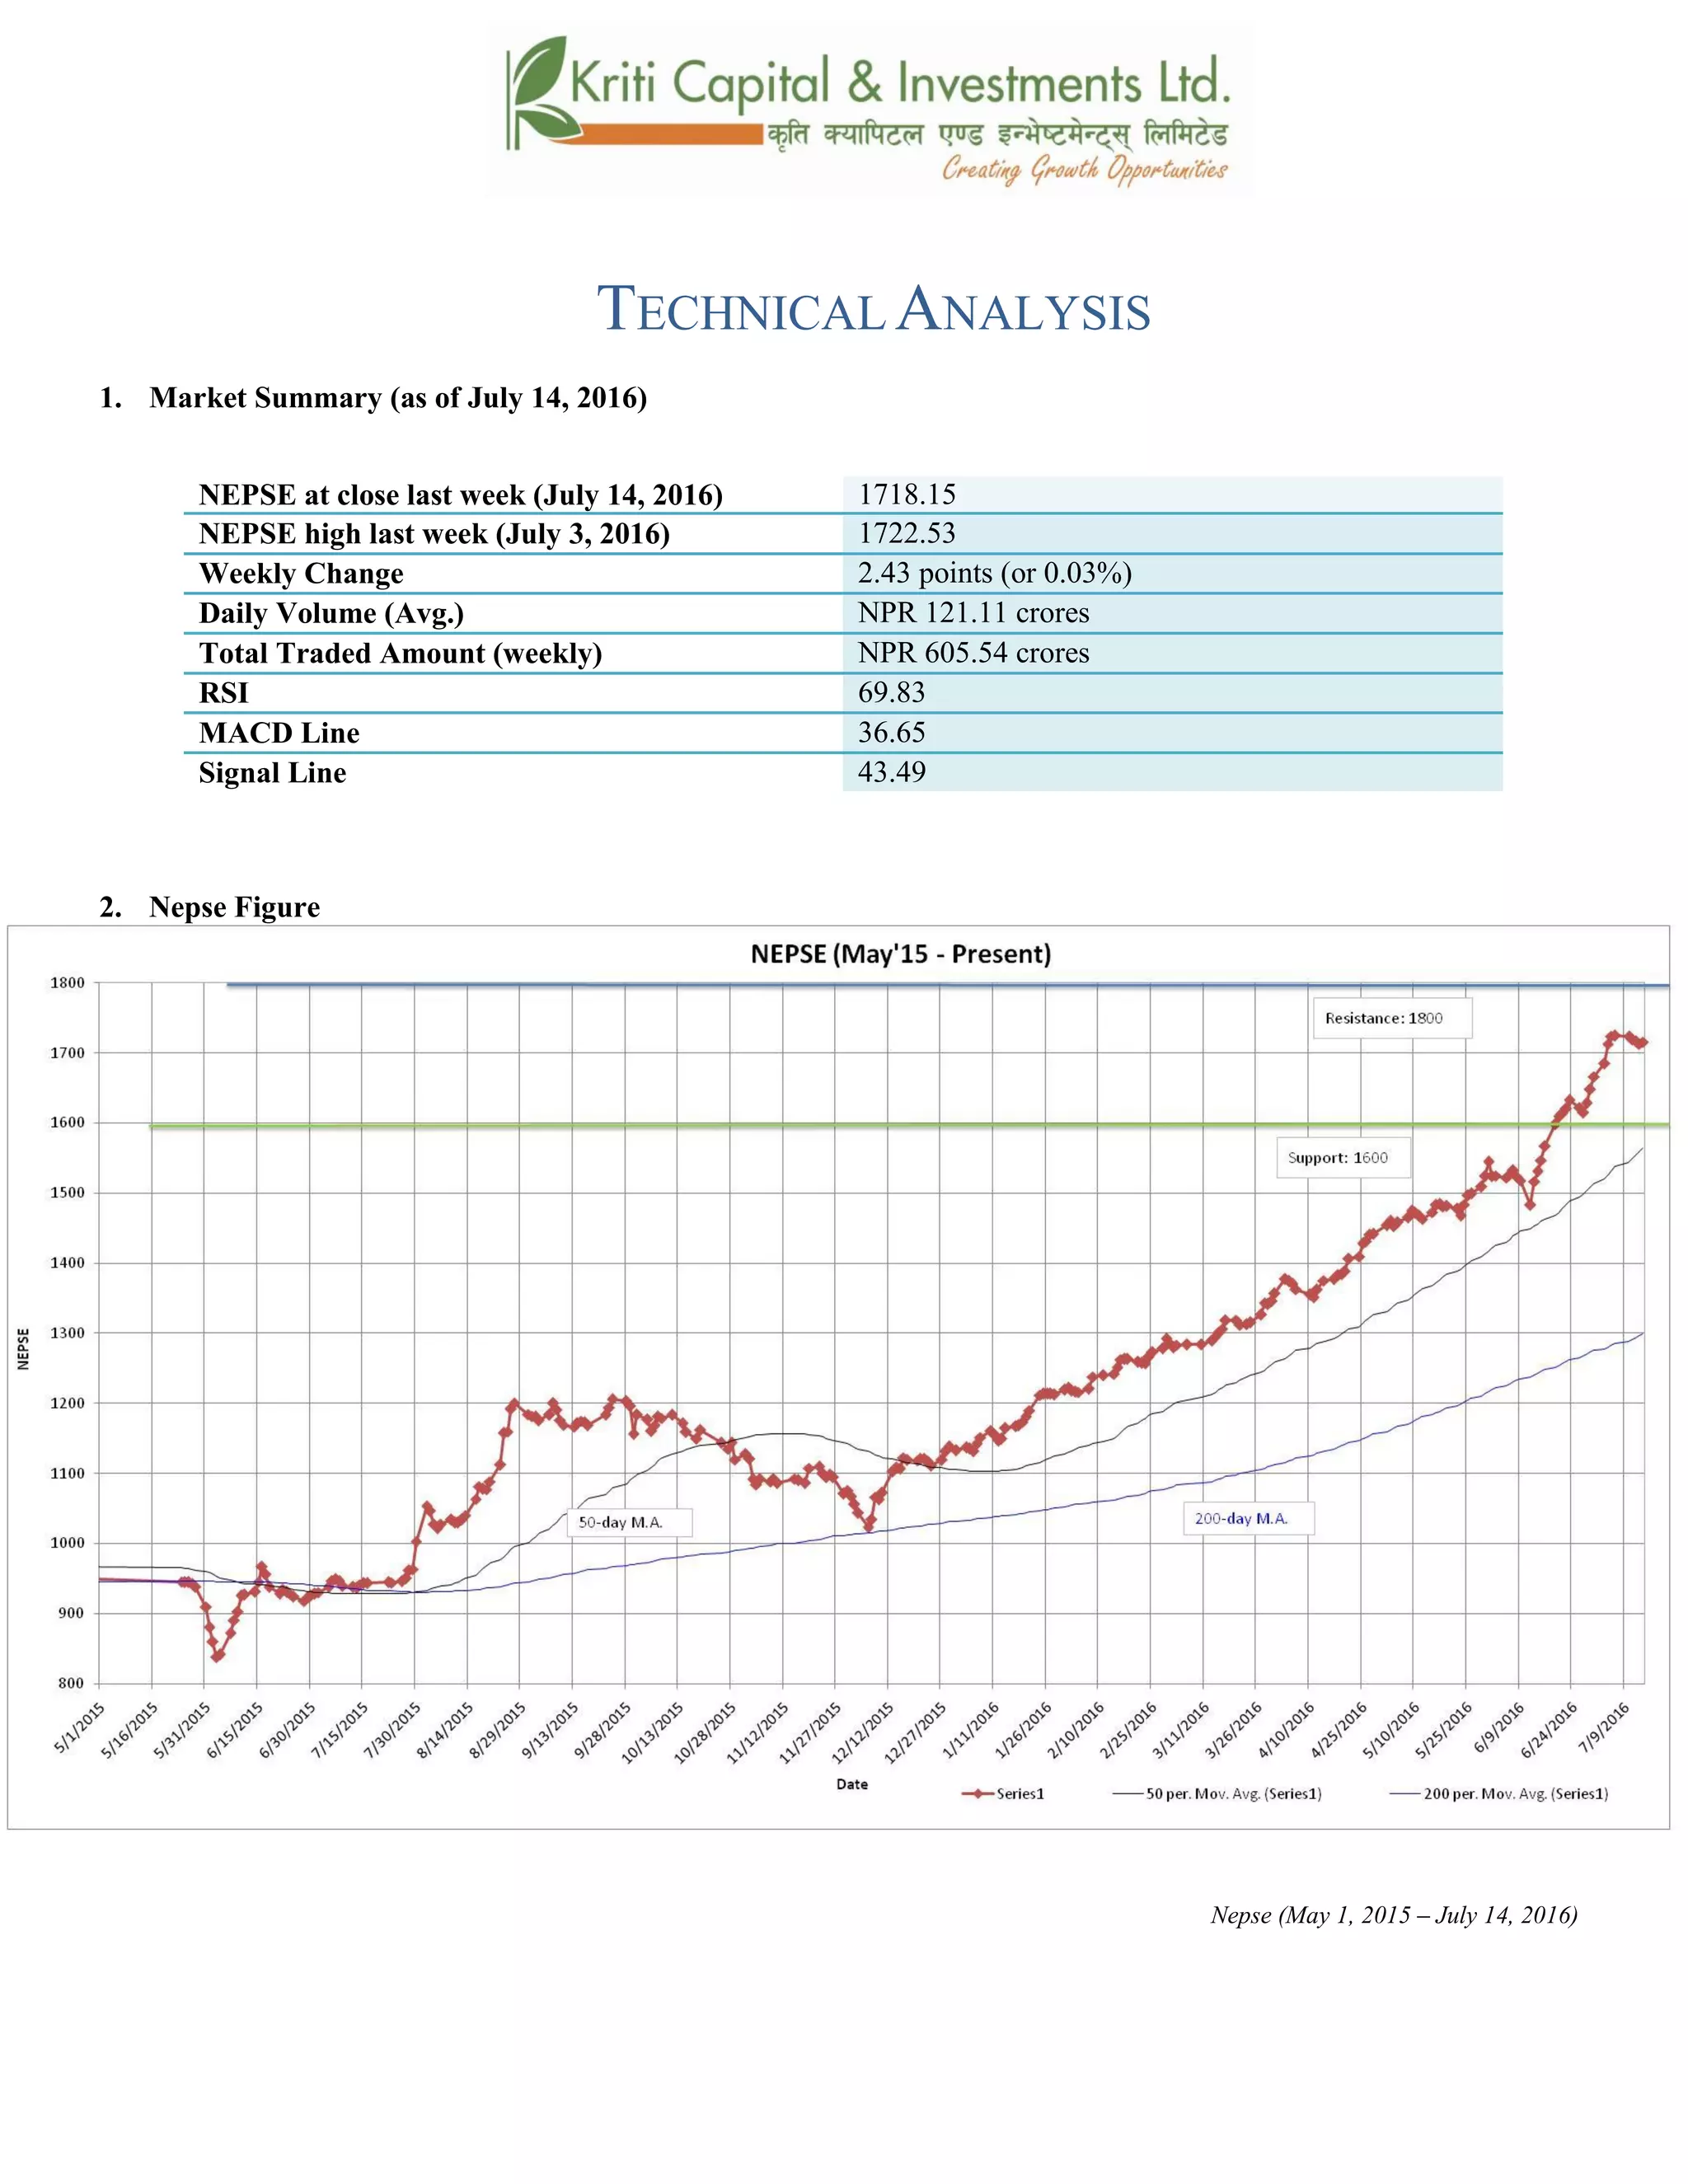
@_ ahf/ k|j[lt
Nepse (May 1, 2015 – July 14, 2016)](https://image.slidesharecdn.com/nepsetechnicalanalysisjuly10-july142016-160719050402/85/Nepse-Technical-Analysis-July-10-July-14-2016-5-320.jpg)
![#_ 6]«G8 ljZn]if0f
uPsf] ;ftfg]K;] kl/;"rsdf@=$#cªssf] a[l4 b]lvof]h;sf] kmn:j?kahf/ !&!*=!%cªsdfaGbeof] .
uPsf] ;ftfsf] lalxaf/sf] lbg g]kfn /fi6« a}+sn] hf/L u/]sf] df}lb|slgltsf] k"FhLahf/df ;f] lbgvf;} k|jfx
b]lvPg t/ /fhgLltstxdfePsf] kl/jt{gn] eg] Ps b'O{ lbg s]xLgsf/fTds c;/ eg] b]lvof] .
;du|dfclxn] klg kl/;"rs %) lbg] d'leËPe/]h tyf @)) lbg] d'leËeGbfdfly g} rln/x]sf] cj:yf
;du|dfahf/sf] l:ylt /fd|f] b]lvG5 / cfufdLlbgdfeg] /fhgLltstxdfx'g] kl/jt{gn] ahf/df s]xL c;/
eg] kSs} b]lvg] cg'dfgug{ ;lsG5 .
$_ 6]jftyfk|lt/f]w cªs
glhssf] 6]jfcªs !^))
6]jfcªs @ !$*#
glhssf] k|lt/f]w cªs !*))
uPsf] ;ftf g]K;] kl/;"rss]xLlu/fj6kZrft km]l/ ahf/ dflylt/ g} nlDsof] .casf] lbgdfeg] s]xL s/]S;geg]
b]lvg] ;Defjgfalnof] b]lvG5 . xfnglhssf] 6]jfcªstyfglhssf] k|lt/f]w cªss|dz M !^)) tyf
!*))/x]sf] 5 .
%_ g]K;] 6]«G8 ;"rs
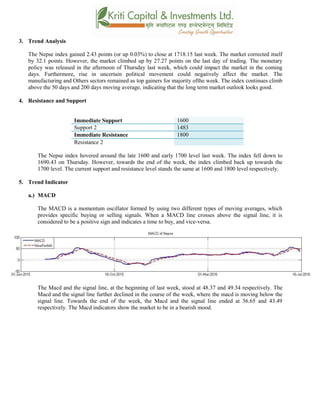
s_ d'leª Pe/]hsGeh]{G; 8fOeh]{G; -PdP;L8L_
PdP;L8Ldf b'O{ cf]6f /]vf x'G5g, h;df Pp6fn] ahf/sf] lbzf kl/jt{gsf] ;+s]t u5{ eg] csf]{n] ahf/sf]
k|j[lQ -6«]08_ b]vfpg] u5{ . olb PdP;L8L /]vfn] l;Ung /]vfnfO{ tnaf6 dfly sf6]dfo;nfO{ ;sf/fTds
;+s]tsf ?kdflnO{G5 / o;n] z]o/x? lsGg] ;+s]t ub{5 .
uPsf] ;ftfsf] z'?df PdP;L8L nfO{gtyfl;UgnnfO{g s|dzM$*=#&tyf$(=#$sf] l:yltdf /x]sf] lyof]/
;ftfsf] cGTodf PdP;L8L nfO{g tyfl;UgnnfO{g s|dzM#^=^%tyf$#=$( /x]sf]] lyof] . l;UgnnfO{g tyf
PdP;L8L nfO{gdf ;ftfsf] cGTodfcfPsf] s]xLlu/fj6n] ahf/dflaol/; 6]«G8sf] ;+s]t ub{5 .
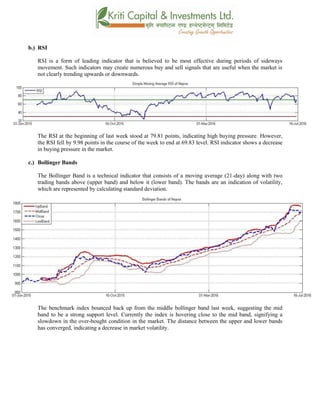
v_ l/n]l6j :6«]Gy OG8]S; -cf/P;cfO{_](https://image.slidesharecdn.com/nepsetechnicalanalysisjuly10-july142016-160719050402/85/Nepse-Technical-Analysis-July-10-July-14-2016-6-320.jpg)
![cf/P;cfO{ k|fljlwsljZn]if0fsf] o:tf] cf}hf/ xf], h;nfO{ Pstlkm{ ?kdfrln/x]sf] ahf/dfJofkf/ /0fgLlt
agfpg a9L pkof]uL dflgG5 . To;}u/L, o;n] ahf/dfvl/b / ljlqmsf] :ki6 ;+s]t b]vfpg] u5{ .
cf/P;cfO{uPsf] ;ftfsf] z'?df&(=*!cªsdf/x]sf] lyof] . t/ ;ftfsf] afFsLlbgx?df b]lvPsf] lu/fj6 ;Fu}
;ftfsf] cGTodf^(=*#cªsdfa;]sf] cf/P;cfO[{n] ahf/sf] lsGg] xf]8afhLdf s]xLsdLcfPsf] ;+s]t ub{5 .
u_ af]lnªu/ Aof08
af]lnªu/ Aof08 Ps k|fljlwsljZn]if0f ;"rsxf] h;df @!–lbg] d'leËPe/]hsf ;fyb'O{ Aof08 -Pp6f
dfly_ / Pp6f tn_ x'G5g . lo Aof08x?n] cl:y/tfsf] ;+s]t ub{5g, h'g :6fG88{ 8]leP;g u0fgf
u/]/ kQfnufO{G5 .
g]K;] kl/;"rsuPsf] ;ftfsf] pkNnf] Jof08nfO{ tncfO{ dWo Jof08sf] cf;kf; cfPsf] cj:yf /xof] .
clxn] klg Jof08n] 6]jfcªs ?kdfsfdul//x]sf] cj:yf /x]sf] 5 / pkNnf] tyftNnf] Jof08 aLrsf]
b'/LdfcfPsf] sdLn]cl:yt/tfdfeg] sdLcfPsf] ;+s]t ub{5 tyfahf/dflsGg] xf]8afhLdf ;d]t
sdLcfPsf] b]lvG5 .](https://image.slidesharecdn.com/nepsetechnicalanalysisjuly10-july142016-160719050402/85/Nepse-Technical-Analysis-July-10-July-14-2016-7-320.jpg)
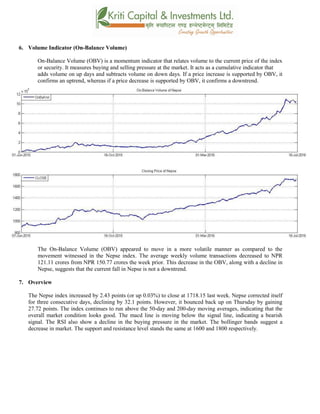
![;du{dfM
uPsf] ;ftf g]K;] kl/;"rsdf@=$#cªssf] a[l4 b]lvof]h;sf] kmn:j?kahf/ !&!*=!%cªsdfaGbeof] . clxn]
klg kl/;"rs %) lbg] d'leËPe/]h tyf @)) lbg] d'leËeGbfdflyuO{/x]sf] cj:yfn] ahf/ ;sf/fTds l:yltdf
g} /x]sf] ;+s]t ub{5 . PdP;L8L nfO{gdf s]xLlu/fj6 b]lvgfn] ahf/sf]a'lnz 6]«G8dfs]xLsdLcfPsf] ;+s]t ub{5
. &) cªseGbf s]xLcªsn] tnem/]sf] cf/P;cfO{n] ahf/sf] cf]e/ a6 l:yltdf s]xLsdLcfPsf] tyfpkNnf]
tyftNnf] Jof08 aLrsf] b'/LdfcfPsf] sdLn]ahf/sf] cl:y/tfklgsdLcfPsf] ;+s]t ub{5 .xfnsf] cj:yfdfgofF
6]jfcªstyfk|lt/f]w cªs s||dzM !^)) tyf !*)) g} sfod /x]sf] 5 .](https://image.slidesharecdn.com/nepsetechnicalanalysisjuly10-july142016-160719050402/85/Nepse-Technical-Analysis-July-10-July-14-2016-8-320.jpg)

The Nepse index gained 2.43 points last week to close at 1718.15. The RSI and MACD indicators show a decrease in buying pressure in the market. The index continues to trade above its 50-day and 200-day moving averages, suggesting an overall positive market condition. Support and resistance levels remain unchanged at 1600 and 1800 respectively.


