Download to read offline

![k|fljlwsljZn]if0f
!_ahf/ ;f/f+z -d+l;/(, @)&#;Ddsf]_
aGb cªs -d+l;/(, @)&#_ !%#$=)#
pRr cªs -uPsf] ;ftf_ !^)^=@(
;fKtflxs kl/jt{g –!@$=)% -–&=^^k|ltzt_
b}lgscf};t Jofkf/ ¿=!)!=#(s/f]8
s'n ;fKtflxsJofkf/ ¿ %)^=(( s/f]8
cf/P;cfO{ !$=&!
PdP;L8L –%$=&!
l;UgnnfO{g –#^=$@
@_ ahf/ k|j[lt
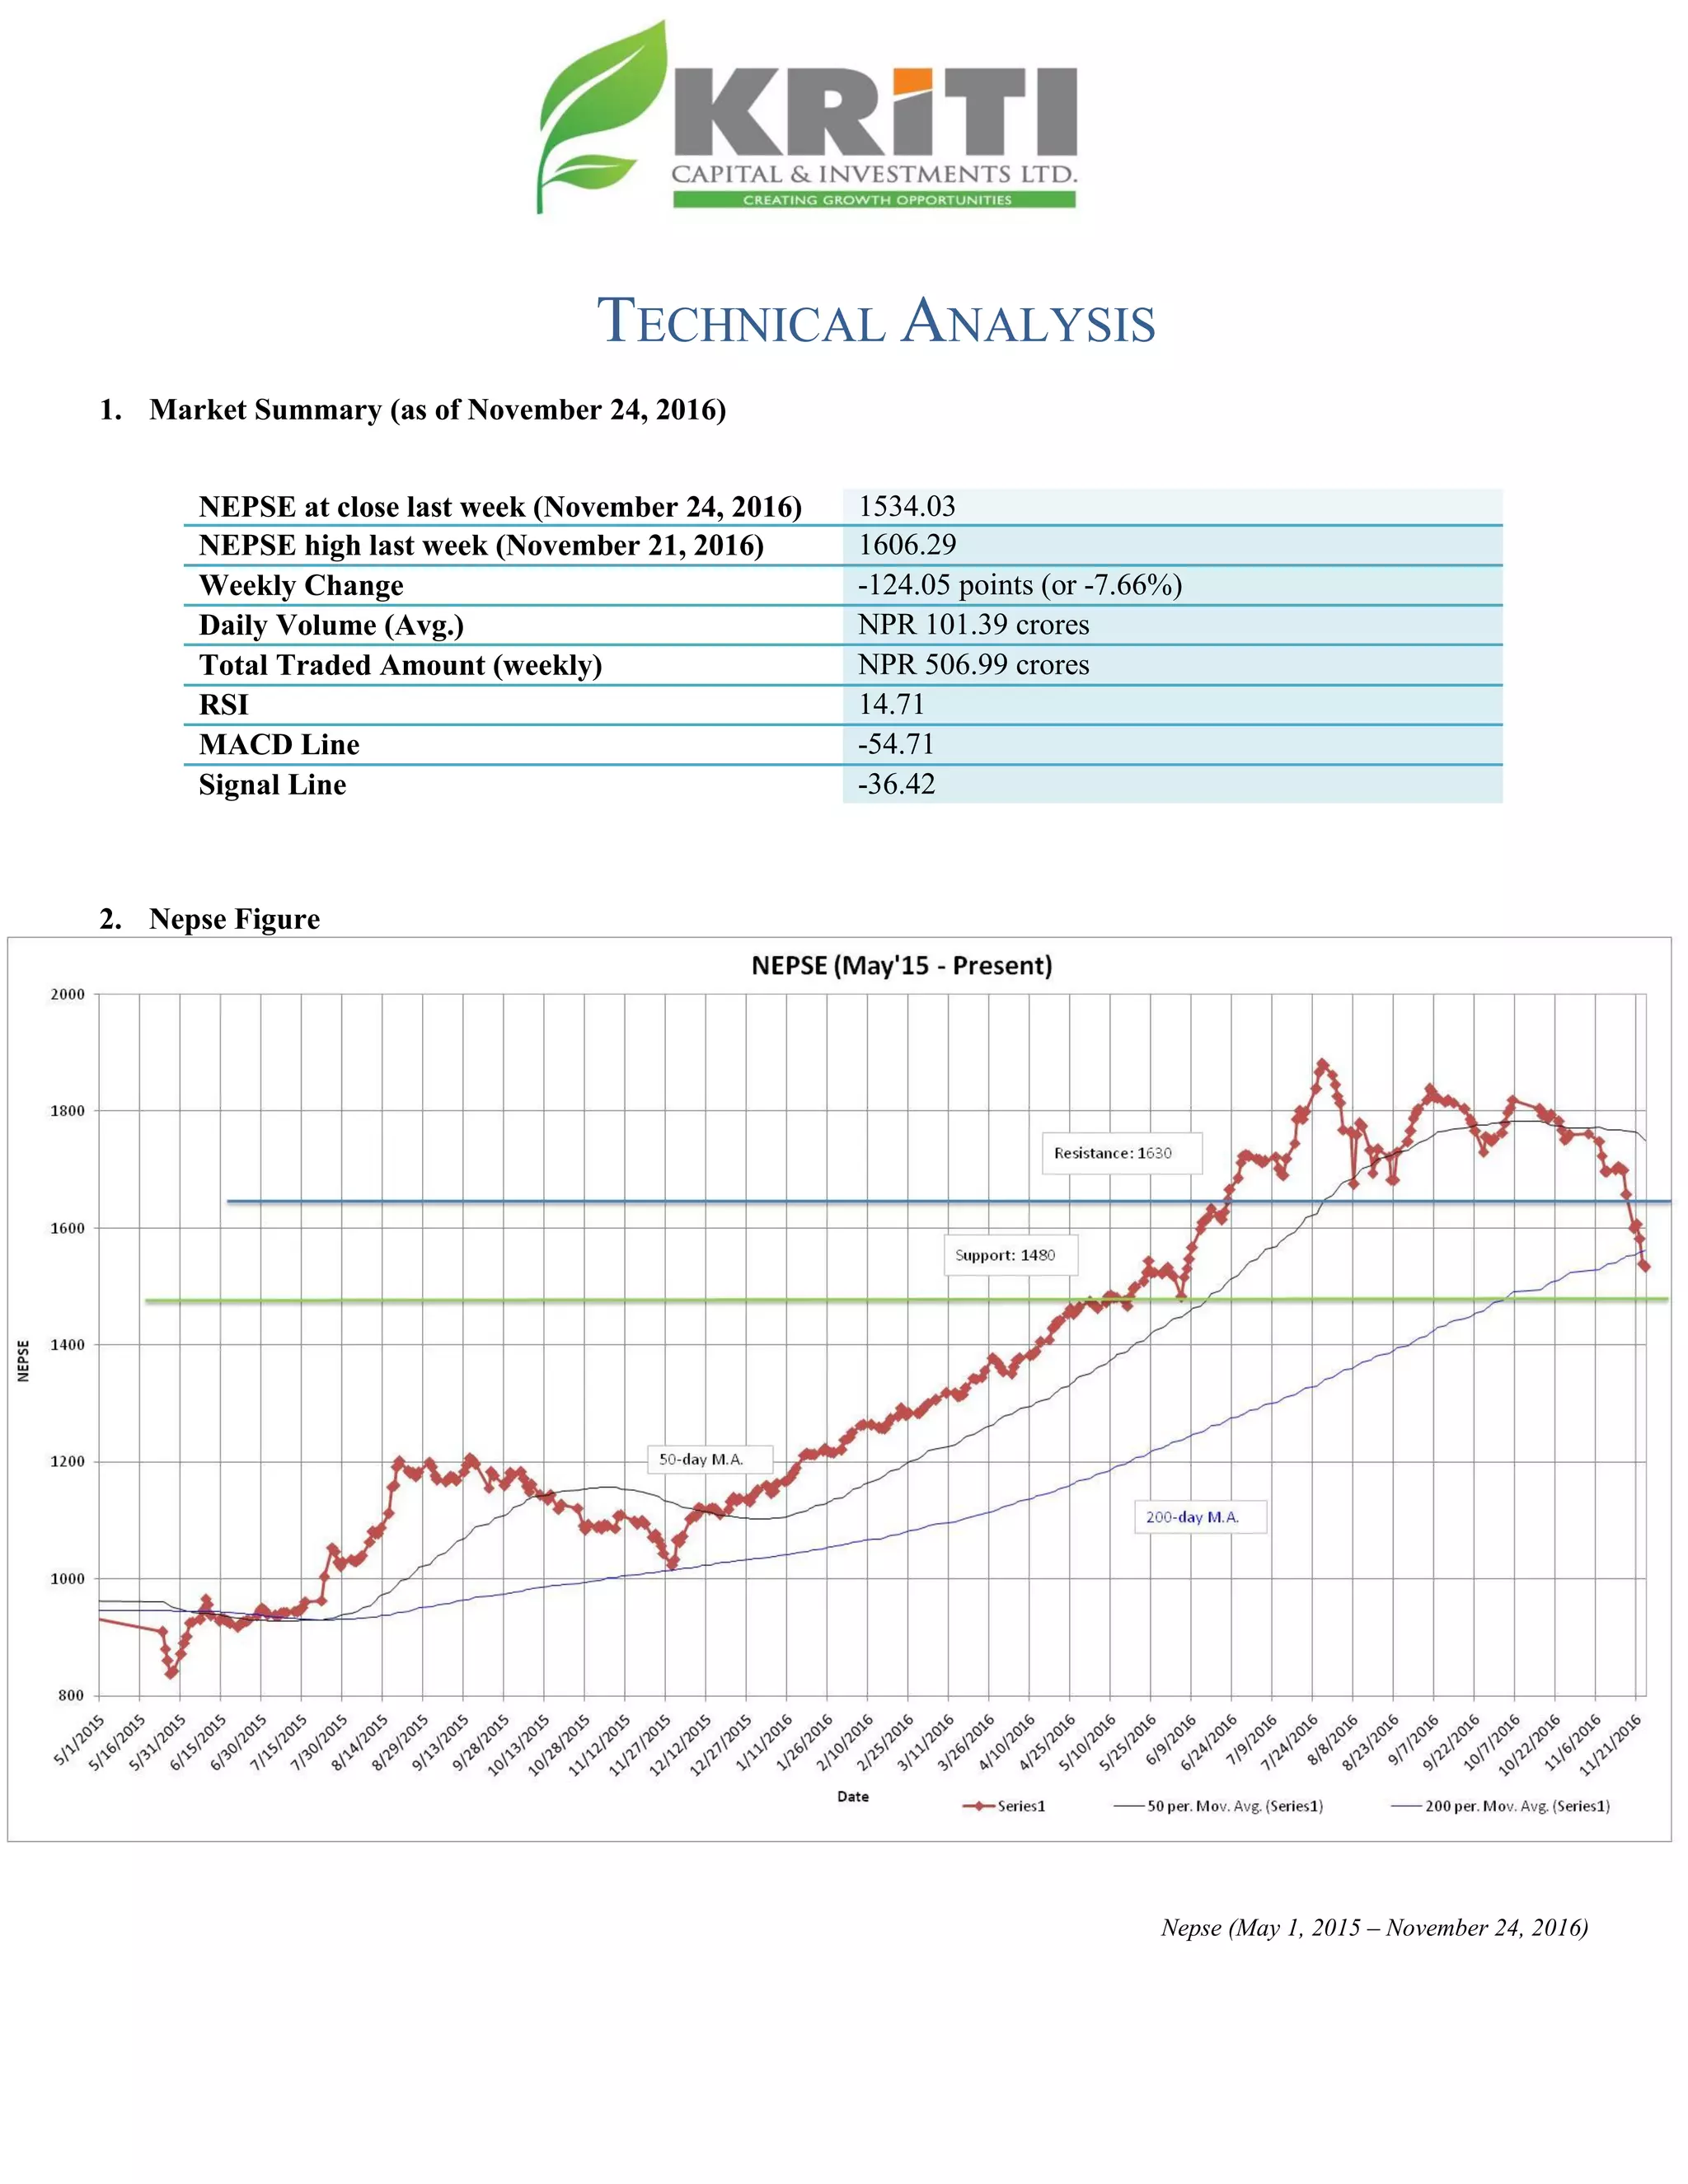
Nepse (May 1, 2015 – November 24, 2016)](https://image.slidesharecdn.com/nepsetechnicalanalysisnovember20-november242016-161129060028/85/Nepse-technical-analysis-november-20-november-24-2016-5-320.jpg)
![#_ 6]«G8 ljZn]if0f
uPsf] ;ftfg]K;] kl/;"rsdf!@$=)%cªssf] ef/L lu/fj6 b]lvof]h;sf] kmn:j?kahf/
!%#$=)#cªsdfaGbeof] .g]K;] kl/;"rsclxn@))lbg] d'leËPe/]heGbftncfPsf] cj:yfn] ahf/ clxn] k'/}
laol/;
6]«G8 /x]sf] b']lvG5 . ahf/df b]lvPsf] t/ntfsf] cefj / xfnef/t ;/sf/n] cfkmgf] !))) tyf %)) sf]
gf]6df nfPsf] k|ltaGwtyf /fhgLltstxdf b]lvPsf] cl:y/tfn] ubf{ nufgLstf{x?sf] dgf]an
s]xLtnem/]sf] b]lvG5 .cf};tsf/f]af/ /sdeg] a9]/ !)!=#( s/f]8df cfPsf] 5 .
$_ 6]jftyfk|lt/f]w cªs
glhssf] 6]jfcªs !$*)
6]jfcªs @ !#%)
glhssf] k|lt/f]w cªs !^#)
uPsf] ;ftf g]K;] kl/;"rsn] !^#%cªssf] 6]jfcªsnfO{ kf/ u/L tncfPsf] cj:yf /xof] . xfnsf] nflugofF
6]jfcªs !$*)tyfgofFk|lt/f]w cªs !^#) /x]sf] 5 . g]K;] kl/;"rsxfn@))lbg] d'leËPe/]h eGbftncfPsf]
cj:yfn] ahf/dflaol/; 6]«G8 /x]sf] b]lvG5 .
%_ g]K;] 6]«G8 ;"rs
s_ d'leª Pe/]hsGeh]{G; 8fOeh]{G; -PdP;L8L_
PdP;L8Ldf b'O{ cf]6f /]vf x'G5g, h;df Pp6fn] ahf/sf] lbzf kl/jt{gsf] ;+s]t u5{ eg] csf]{n] ahf/sf]
k|j[lQ -6«]08_ b]vfpg] u5{ . olb PdP;L8L /]vfn] l;Ung /]vfnfO{ tnaf6 dfly sf6]dfo;nfO{ ;sf/fTds
;+s]tsf ?kdflnO{G5 / o;n] z]o/x? lsGg] ;+s]t ub{5 .
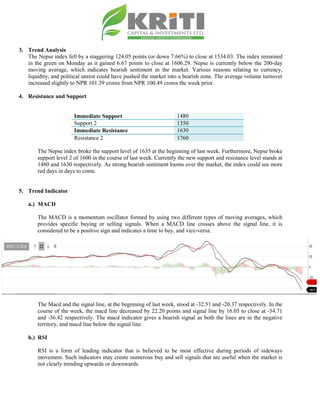
;ftfsf] z'?df PdP;L8L nfO{g tyfl;UgnnfO{g s|dzM–#@=%@tyf–@)=#&sf] l:yltdf /x]sf] lyof] .
PdP;L8LnfO{gtyfl;UgnnfO{gdfafFsLsflbgx?dflu/fj6 g} b]lvof] .xfnsf] nflu PdP;L8LnfO{g
tyfl;UgnnfO{g s|dz M –%$=&!tyf#^=$@ /x]sf] 5 / PdP;L8L nfO{g l;UgnnfO{g eGbftncfO{
C0ffTds If]qdf /x]sf] xF'bfahf/ laol/; l:yltdf b]lvG5 .](https://image.slidesharecdn.com/nepsetechnicalanalysisnovember20-november242016-161129060028/85/Nepse-technical-analysis-november-20-november-24-2016-6-320.jpg)
![v_ l/n]l6j :6«]Gy OG8]S; -cf/P;cfO{_
cf/P;cfO{ k|fljlwsljZn]if0fsf] o:tf] cf}hf/ xf], h;nfO{ Pstlkm{ ?kdfrln/x]sf] ahf/dfJofkf/ /0fgLlt
agfpg a9L pkof]uL dflgG5 . To;}u/L, o;n] ahf/dfvl/b / ljlqmsf] :ki6 ;+s]t b]vfpg] u5{ .
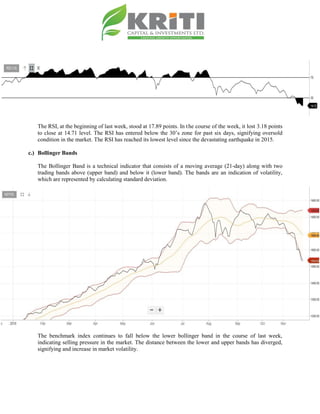
cf/P;cfO{uPsf] ;ftfsf] z'?df!&=*(cªsdf/x]sf] lyof]tyf ;ftfsf] cGTolt/ cf/P;cfO{ !$=&!cªsdf
/xof].#) cªseGbftnem/]sf] cf/P;cfO{n] cf]e/;f]N8 ahf/sf] l:Ylt b]vfp5 .xfncf/P;cfO{ @)!%
ljgfzsf/L k5f8L ;a} eGbftNnf] cªsdf /x]sf] 5 .
u_ af]lnªu/ Aof08
af]lnªu/ Aof08 Ps k|fljlwsljZn]if0f ;"rsxf] h;df @!–lbg] d'leËPe/]hsf ;fyb'O{ Aof08 -Pp6f dfly_ /
Pp6f tn_ x'G5g . lo Aof08x?n] cl:y/tfsf] ;+s]t ub{5g, h'g :6fG88{ 8]leP;g u0fgf u/]/ kQfnufO{G5 .](https://image.slidesharecdn.com/nepsetechnicalanalysisnovember20-november242016-161129060028/85/Nepse-technical-analysis-november-20-november-24-2016-7-320.jpg)
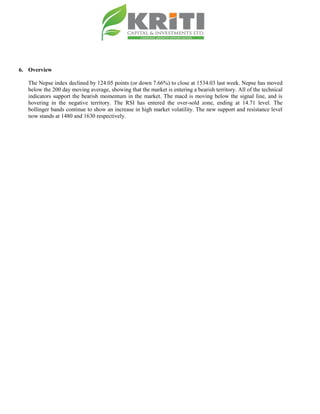
![g]K;] kl/;"rsuPsf] ;ftftNnf] Jof08 eGbftncfPsf]cj:yf /xof]h;n] ahf/ cf]e/ ;f]N8 l:yltdf /x]sf]
;+s]t ub{5 . pkNnf] tyftNnf] Jof08 aLrsf] b'/Ldf;d]t cfPsf] ab9f] b'/Ln]cl:yt/tfeg]] a9g] s|ddf /x]sf]
b]lvG5 .
;du{dfM
uPsf] ;ftf g]K;] kl/;"rsdf!@$=)%cªssf] lu/fj6 b]lvof]h;sf] kmn:j?kahf/ !%#$=)#cªsdfaGbeof] .
clxn] %)lbg] d'leËPe/]heGbftncfPsf] kl/;"rsn] ahf/dflaol/; l:ylt /x]sf] b]lvG5 . PdP;L8LnfO{gdf
b]lvPsf] lu/fj6n] eg]a]Rg]xf]8afhLdf w]/} a[l4 ePsf]b]lvG5 . #)cªseGbftncfPsf] cf/P;cfO{n] ahf/ k'/}
a]Rg] l:ylt df /x]sf] ;+s]t ub{5 .pkNnf] tyftNnf] Jof08 aLrsf] b'/Ldf;d]t cfPsf]a[l4n] ahf/sf]
cl:y/tfeg]a9g] s|ddf /x]sf] ;+s]t ub{5 .xfnsf] cj:yfdfgofF 6]jfcªstyfk|lt/f]w cªs s||dzM !$*)tyf
!^#)sfod /x]sf] 5 .](https://image.slidesharecdn.com/nepsetechnicalanalysisnovember20-november242016-161129060028/85/Nepse-technical-analysis-november-20-november-24-2016-8-320.jpg)

The Nepse index fell by 124 points last week closing at 1534, indicating bearish market sentiment. Technical indicators like MACD, RSI and Bollinger bands also show bearish signals, with MACD line below the signal line in negative territory and RSI at its lowest level since 2015. The new support and resistance levels are 1480 and 1630 respectively. Overall, technical analysis suggests the market will likely see more declines in the coming days.


