Download to read offline

![k|fljlwsljZn]if0f
!_ahf/ ;f/f+z -ebf}#), @)&#;Ddsf]_
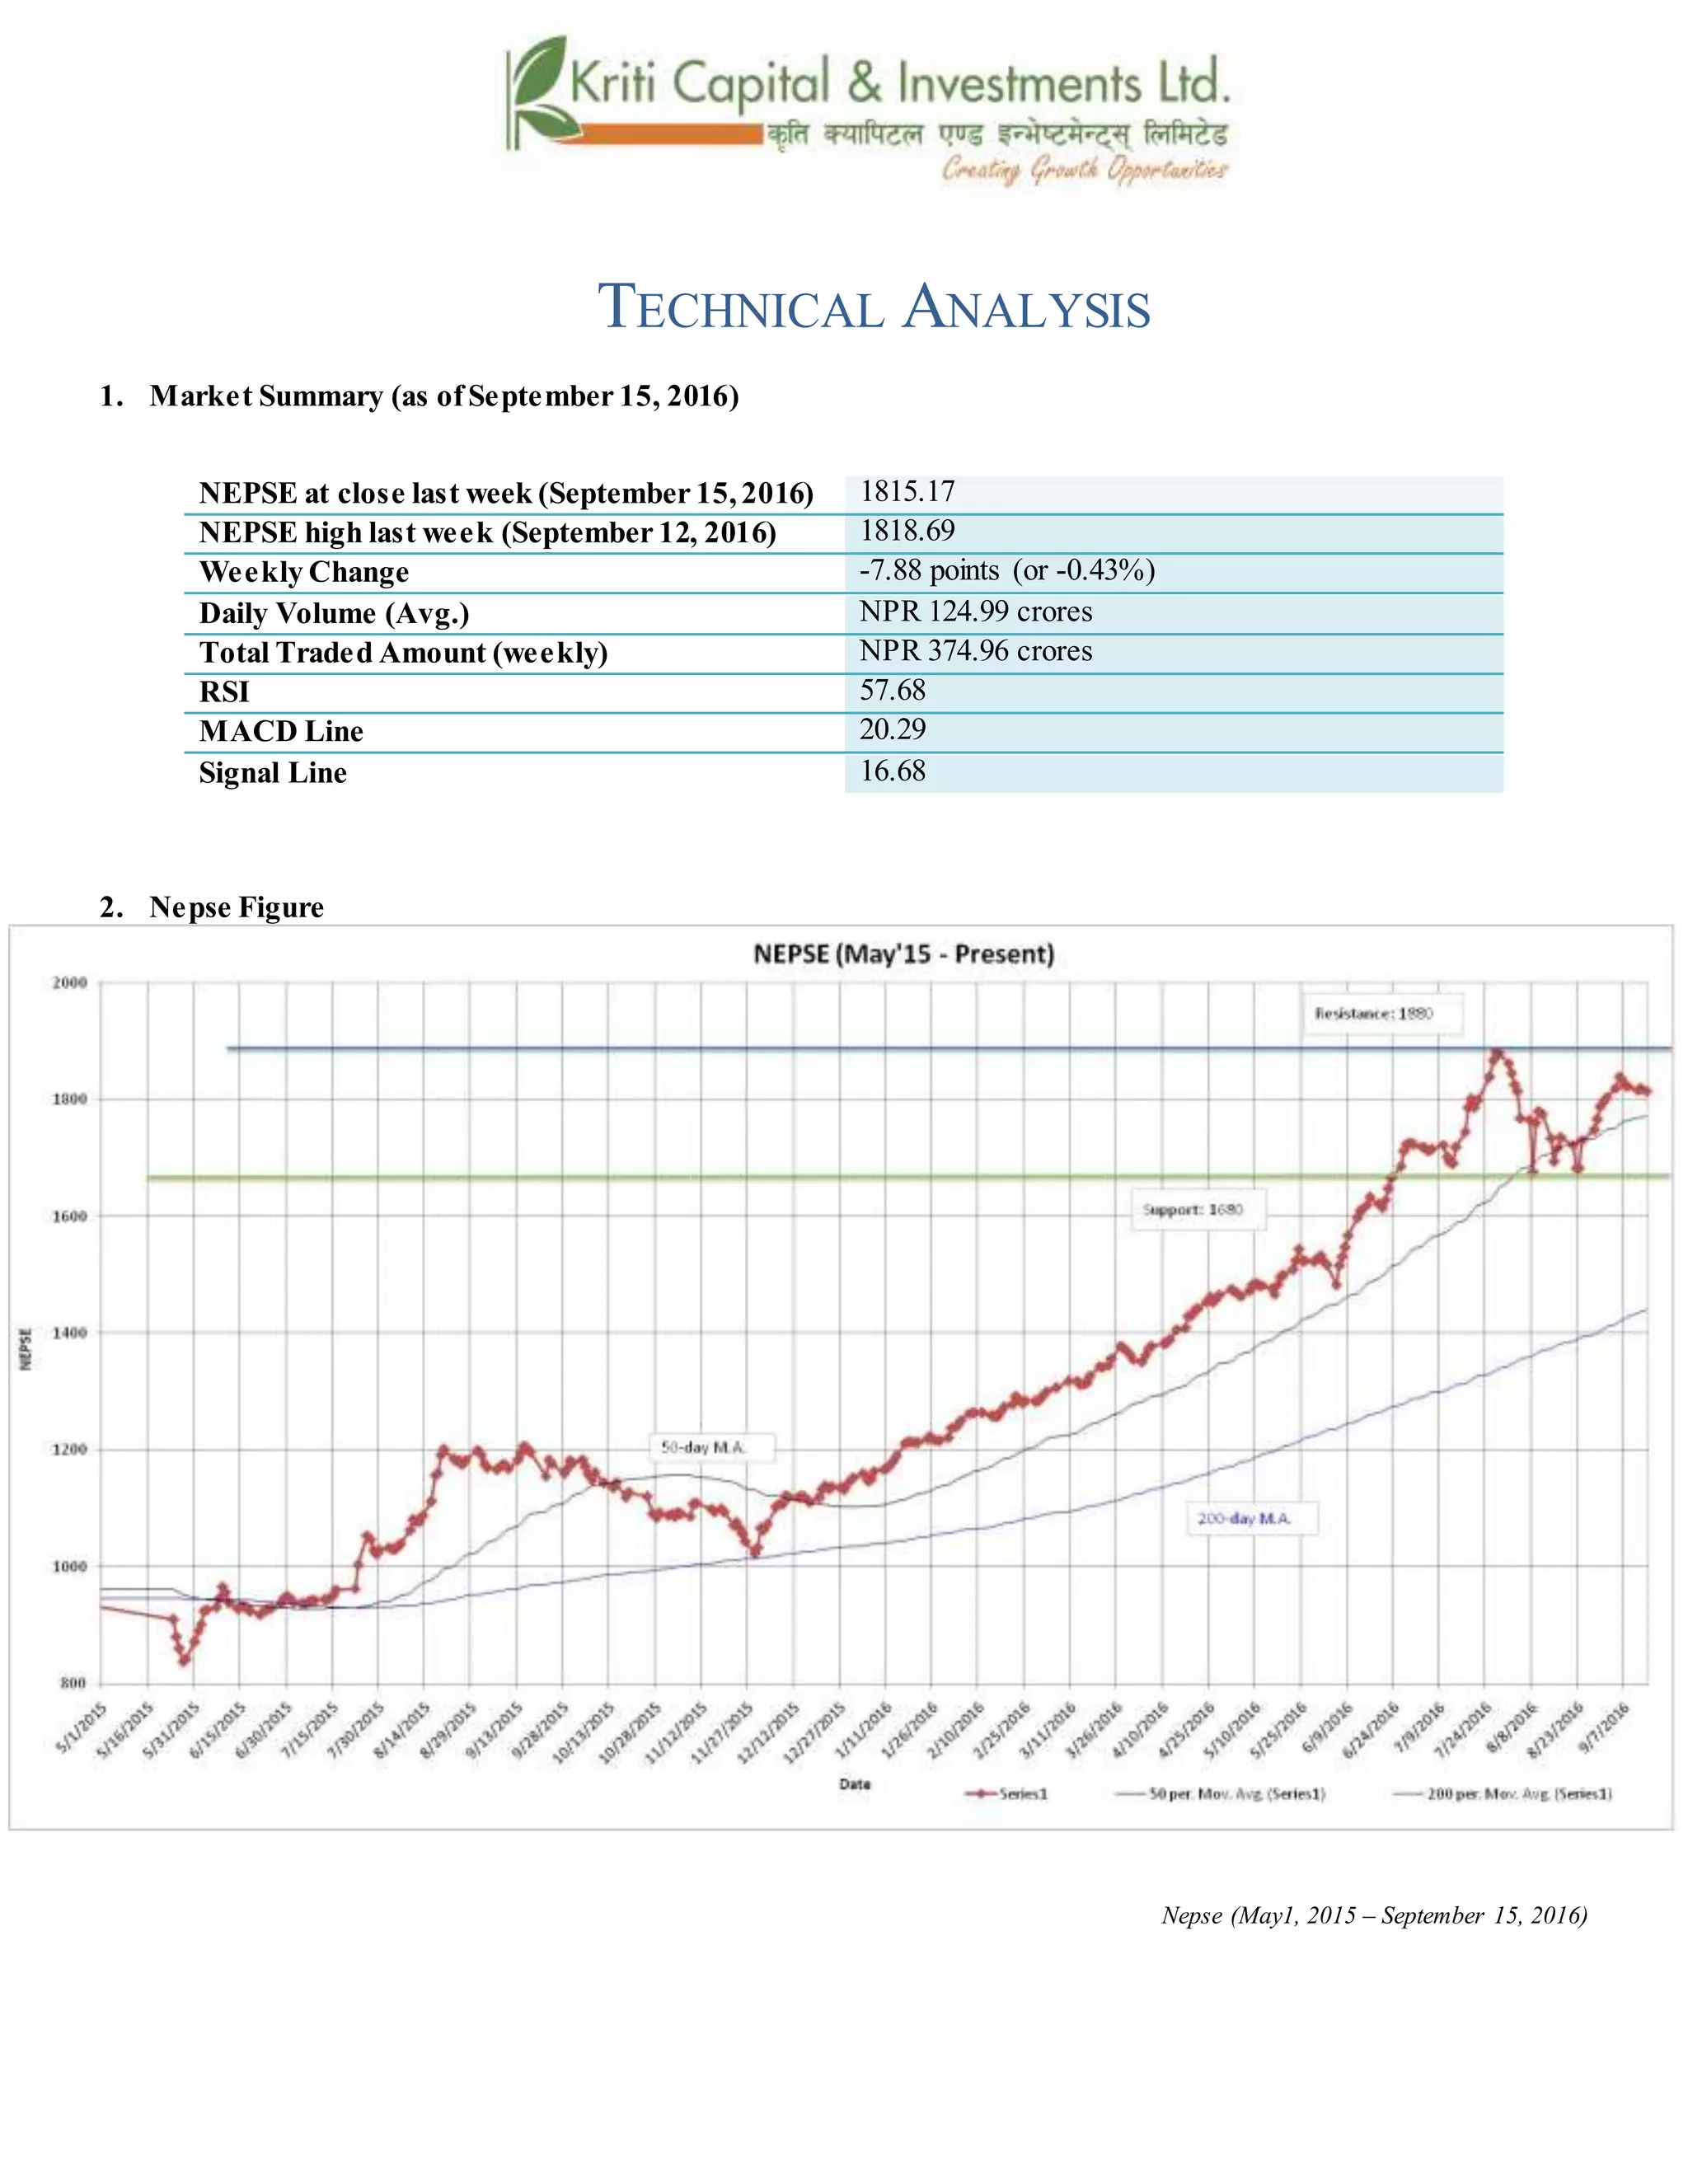
aGb cªs -ebf}#), @)&#_ !*!%=!&
pRr cªs -uPsf] ;ftf_ !*!*=^(
;fKtflxs kl/jt{g – &=** -–)=$#k|ltzt_
b}lgscf};tJofkf/ ¿=!@$=((s/f]8
s'n ;fKtflxsJofkf/ ¿ #&$=(^ s/f]8
cf/P;cfO{ %&=^*
PdP;L8L @)=@(
l;UgnnfO{g !^=^*
@_ ahf/ k|j[lt](https://image.slidesharecdn.com/nepsetechnicalanalysisseptember11-september152016-160920043414/85/Nepse-Technical-Analysis-September-11-September-15-2016-5-320.jpg)
![Nepse (May1, 2015 –
September 15, 2016)
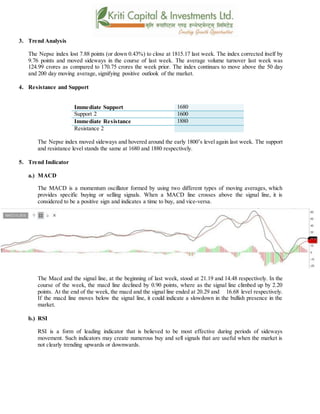
#_ 6]«G8 ljZn]if0f
uPsf] ;ftfg]K;] kl/;"rsdf&=**cªssf] ;fdfGolu/fj6 b]lvof]h;sf] kmn:j?kahf/
!,*!%=!&cªsdfaGbeof] .uPsf] ;ftf g]K;] kl/;"rsdf s]xL s/]S;g b]lvof] / kl/;"rsdf
;fO{8j]h d'ed]G6 b]lvof]. t/ ;du|dfclxn]klg kl/;"rs %) lbg] d'leËPe/]h tyf @))
lbg] d'leËeGbfdfly g} rln/x]sf] cj:yfn] ;du|dfahf/sf] l:ylt /fd|f] b]lvG5 .cf};t
sf/f]af/kl/df0f eg]!&)=&% s/f]8af6 !@$=(( s/f]8 dfcfPsf]cj:yf b]lvof] .
$_ 6]jftyfk|lt/f]w cªs
glhssf] 6]jfcªs !^*)
6]jfcªs @ !^))
glhssf] k|lt/f]w cªs !**)
uPsf] ;ftf g]K;] kl/;"rs!*))cªssf]jl/kl/ /x]sf]cj:yf /xof] / xfngofFk|lt/f]wcªs !**) g}
/x]sf] cj:yf 5 .
%_ g]K;] 6]«G8 ;"rs
s_ d'leª Pe/]hsGeh]{G; 8fOeh]{G; -PdP;L8L_
PdP;L8Ldfb'O{ cf]6f /]vf x'G5g, h;df Pp6fn] ahf/sf] lbzf kl/jt{gsf] ;+s]t u5{
eg] csf]{n] ahf/sf] k|j[lQ -6«]08_ b]vfpg] u5{ . olb PdP;L8L /]vfn] l;Ung
/]vfnfO{ tnaf6 dfly sf6]dfo;nfO{ ;sf/fTds ;+s]tsf ?kdflnO{G5 / o;n] z]o/x?
lsGg] ;+s]t ub{5 .
;ftfsf]cGTodf PdP;L8L nfO{g tyfl;UgnnfO{g s|dzM@!=!(tyf!$=$*sf] l:yltdf
/x]sf] lyof] .
PdP;L8LnfO{g s]xLlu/fj6 b]lvof] .xfnsf] nflu PdP;L8LnfO{g tyfl;UgnnfO{g
s|dz M @)=@( tyf !^=^* /x]sf] 5 / PdP;L8L nfO{g l;UgnnfO{g
eGbftncfPdfahf/dfa'lnz l:Ylt b]vg ;lsg] l:ylt 5 .
.](https://image.slidesharecdn.com/nepsetechnicalanalysisseptember11-september152016-160920043414/85/Nepse-Technical-Analysis-September-11-September-15-2016-6-320.jpg)
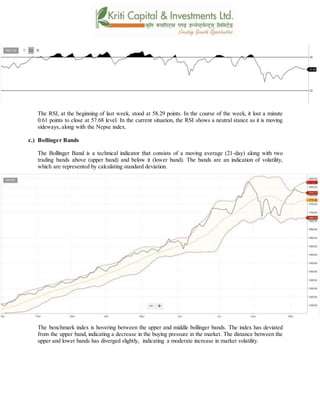
![v_ l/n]l6j :6«]Gy OG8]S; -cf/P;cfO{_
cf/P;cfO{k|fljlwsljZn]if0fsf]o:tf] cf}hf/ xf], h;nfO{ Pstlkm{ ?kdfrln/x]sf]
ahf/dfJofkf//0fgLltagfpg a9L pkof]uL dflgG5 . To;}u/L, o;n] ahf/dfvl/b /
ljlqmsf]:ki6 ;+s]t b]vfpg]u5{ .
cf/P;cfO{uPsf];ftfsf]z'?df%*=@(cªsdf/x]sf]lyof]tyf ;ftfsf]cGTolt/ cf/P;cfO{
%&=^*cªsdf /xof].uPsf] ;ftf g]K;]df ;fO{8j]h d'ed]G6 b]lvof] .
u_ af]lnªu/ Aof08
af]lnªu/ Aof08 Ps k|fljlwsljZn]if0f ;"rsxf]h;df @!–lbg]d'leËPe/]hsf
;fyb'O{ Aof08 -Pp6fdfly_ / Pp6f tn_ x'G5g . lo Aof08x?n]cl:y/tfsf] ;+s]t
ub{5g, h'g :6fG88{8]leP;g u0fgf u/]/ kQfnufO{G5 .](https://image.slidesharecdn.com/nepsetechnicalanalysisseptember11-september152016-160920043414/85/Nepse-Technical-Analysis-September-11-September-15-2016-7-320.jpg)
![g]K;] kl/;"rsuPsf] ;ftf km]l/ pkNnf] Jof08nfO{ 5f]8L tncfPsf] cj:yfn]lsGg]
xf]8afhLdf s]xLsdLcfPsf];+s]t ub{5 . pkNnf] tyftNnf] Jof08 aLrsf] b'/LdfcfPsf]
;fdfGo a[l4n]cl:yt/tfeg] s]xL] a9]sf] ;+s]t ub{5 .
;du{dfM
uPsf] ;ftf g]K;] kl/;"rsdf&=**cªssf] lu/fj6 b]lvof]h;sf] kmn:j?kahf/
!*!%=!&cªsdfaGbeof] . clxn] klg kl/;"rs %) lbg] d'leËPe/]h tyf @)) lbg]
d'leËeGbfdflyuO{/x]sf]cj:yfn] ahf/ ;sf/fTds l:yltdf g} /x]sf] ;+s]t ub{5 . PdP;L8L
nfO{gdf b]lvPsf] ;fdfGolu/fj6n]lsGg] xf]8afhLdf eg] s]xLsdLcfPsf]b]lvG5 .
clxn] klg&) cªseGbftnem/]sf]]cf/P;cfO{n] ahf/ cf]e/ a6 l:yltdf g/x]sf] ;+s]t ub{5
t/ la:tf/} dflycfpg ;Sg] l:ylt b]lvG5 . pkNnf] tyftNnf] Jof08 aLrsf] b'/Ldfb]lvPsf]
;fdfGo a[l4n]ahf/sf] cl:y/tfdfeg]a[l4ePsf] ;+s]t ub{5 .xfnsf] cj:yfdfgofF
6]jfcªstyfk|lt/f]w cªs s||dzM !^*) tyf !**) sfod /x]sf] 5 .](https://image.slidesharecdn.com/nepsetechnicalanalysisseptember11-september152016-160920043414/85/Nepse-Technical-Analysis-September-11-September-15-2016-8-320.jpg)

The Nepse index fell 0.43% last week to close at 1815.17, moving sideways near the 1800 level. Technical indicators like MACD and RSI show the market is in a neutral stance. Support and resistance levels remain at 1680 and 1880 respectively. The index is above its 50-day and 200-day moving averages, suggesting a positive long-term outlook. Market volatility increased slightly as shown by diverging Bollinger bands.


