Download to read offline

![k|fljlwsljZn]if0f
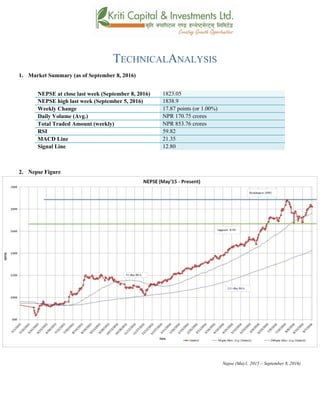
!_ahf/ ;f/f+z -ebf}@#, @)&#;Ddsf]_
aGb cªs -ebf}@#, @)&#_ !*@#=)%
pRr cªs -uPsf] ;ftf_ !*#*=()
;fKtflxs kl/jt{g !&=*& -!k|ltzt_
b}lgscf};t Jofkf/ ¿=!&)=&%s/f]8
s'n ;fKtflxsJofkf/ ¿ *%#=&^ s/f]8
cf/P;cfO{ %(=*@
PdP;L8L @!=#%
l;UgnnfO{g !@=*)
@_ ahf/ k|j[lt
Nepse (May1, 2015 – September 8, 2016)](https://image.slidesharecdn.com/nepsetechnicalanalysisseptember4-september82016-160913042648/85/Nepse-Technical-Analysis-September-4-September-8-2016-5-320.jpg)
![#_ 6]«G8 ljZn]if0f
uPsf] ;ftfg]K;] kl/;"rsdf!&=*&cªssf] ;fdfGo a[l4 b]lvof]h;sf] kmn:j?kahf/
!,*@#=)%cªsdfaGbeof] . ;ftfsf] z'?cftLlbgdfahf/ a[l4 s} l:yltdf /x]sf] b]lvof] t/ ;ftfsf]
afFsLlbgx? ahf/df s/]S;g b]lvof] . t/ ;du|dfclxn] klg kl/;"rs %) lbg] d'leËPe/]h tyf @)) lbg]
d'leËeGbfdfly g} rln/x]sf] cj:yfn] ;du|dfahf/sf] l:ylt /fd|f] b]lvG5 .ljleGg ;"rLs[t ;+:yfx?n]
cfkmgf] nfef+z 3f]if0f ug]{ s|dhf/L /x]sf] x'Fbfahf/ clxn] a'lnz l:yltdf b]lvG5 . cf};t sf/f]af/ kl/df0f
;d]t !#*=%@ s/f]8af6 !&)=&% s/f]8 ePsf] cj:yf b]lvof] .
$_ 6]jftyfk|lt/f]w cªs
glhssf] 6]jfcªs !^*)
6]jfcªs @ !^))
glhssf] k|lt/f]w cªs !**)
uPsf] ;ftf g]K;] kl/;"rs!*))cªssf]jl/kl/ /x]sf]cj:yf /xof] / xfngofFk|lt/f]w cªs !**) g} /x]sf]
cj:yf 5 . ljleGg ;'rLs[t ;+:yfx?n] cfkmgf] z]o/wgLx?nfO{ d'gfkmaf6 nfef+zx? 3f]if0ff ug]{ s|dhf/L
/x]sf]n] ahf/ ;sf/fTds l:yltn] cufl8 a9g] blvG5 .
%_ g]K;] 6]«G8 ;"rs
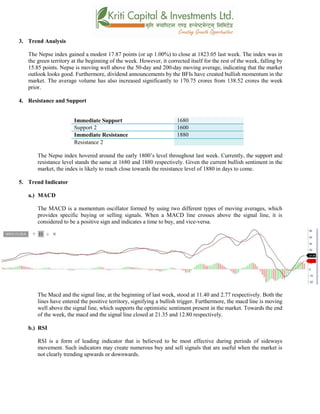
s_ d'leª Pe/]hsGeh]{G; 8fOeh]{G; -PdP;L8L_
PdP;L8Ldf b'O{ cf]6f /]vf x'G5g, h;df Pp6fn] ahf/sf] lbzf kl/jt{gsf] ;+s]t u5{ eg] csf]{n] ahf/sf]
k|j[lQ -6«]08_ b]vfpg] u5{ . olb PdP;L8L /]vfn] l;Ung /]vfnfO{ tnaf6 dfly sf6]dfo;nfO{ ;sf/fTds
;+s]tsf ?kdflnO{G5 / o;n] z]o/x? lsGg] ;+s]t ub{5 .
;ftfsf] cGTodf PdP;L8L nfO{g tyfl;UgnnfO{g s|dzM!!=$) tyf @=&&sf] l:yltdf /x]sf] lyof] / b'j}
nfO{g ;sf/fTds If]qdfcfpg'nfO{ a'lnz l:yltsf] ;+s]t dflgG5 .l;UgnnfO{g eGbfdfly /x]sf] PdP;L8L
nfO{gn] ahf/ ;sf/fTd l:yltdf /x]sf] ;+s]t ub{5 . xfnsf] nflu PdP;L8L nfO{g tyfl;UgnnfO{g s|dz
M @!=#% tyf !@=*) /x]sf] 5 .
.](https://image.slidesharecdn.com/nepsetechnicalanalysisseptember4-september82016-160913042648/85/Nepse-Technical-Analysis-September-4-September-8-2016-6-320.jpg)
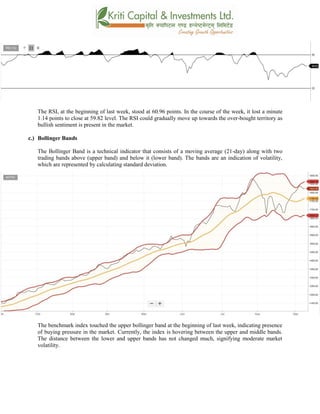
![v_ l/n]l6j :6«]Gy OG8]S; -cf/P;cfO{_
cf/P;cfO{ k|fljlwsljZn]if0fsf] o:tf] cf}hf/ xf], h;nfO{ Pstlkm{ ?kdfrln/x]sf] ahf/dfJofkf/ /0fgLlt
agfpg a9L pkof]uL dflgG5 . To;}u/L, o;n] ahf/dfvl/b / ljlqmsf] :ki6 ;+s]t b]vfpg] u5{ .
cf/P;cfO{uPsf] ;ftfsf] z'?df^)=(^cªsdf/x]sf] lyof]tyf ;ftfsf] cGTolt/ cf/P;cfO{ %(=*@cªsdf
/xof].ahf/sf] lsGg] xf]8afhLdfeg] km]l/ a9g ;+s]t eg] kSs} klg b]lvG5 .
u_ af]lnªu/ Aof08
af]lnªu/ Aof08 Ps k|fljlwsljZn]if0f ;"rsxf] h;df @!–lbg] d'leËPe/]hsf ;fyb'O{ Aof08 -Pp6f
dfly_ / Pp6f tn_ x'G5g . lo Aof08x?n] cl:y/tfsf] ;+s]t ub{5g, h'g :6fG88{ 8]leP;g u0fgf](https://image.slidesharecdn.com/nepsetechnicalanalysisseptember4-september82016-160913042648/85/Nepse-Technical-Analysis-September-4-September-8-2016-7-320.jpg)
![u/]/ kQfnufO{G5 .
g]K;] kl/;"rsuPsf] ;ftf km]l/ pkNnf] Jof08sf] glhscfPsf] cj:yf /xof] h;n] ahf/dflsGg] xf]8afhL km]l/
a9]sf] ;+s]t ub{5 . pkNnf] tyftNnf] Jof08 aLrsf] b'/LdfcfPsf] sdLn] cl:yt/tfdfeg] sdLcfPsf] ;+s]t
ub{5 .
;du{dfM
uPsf] ;ftf g]K;] kl/;"rsdf!&=*&cªssf] a[l4 b]lvof]h;sf] kmn:j?kahf/ !*@#=)%cªsdfaGbeof] . clxn]
klg kl/;"rs %) lbg] d'leËPe/]h tyf @)) lbg] d'leËeGbfdflyuO{/x]sf] cj:yfn] ahf/ ;sf/fTds l:yltdf
g} /x]sf] ;+s]t ub{5 . PdP;L8L nfO{gl;UgnnfO{g eGbfdflycfPsf]cj:yfn] ahf/dflsGg] xf]8afhLdf
a[l4cfPsf] b]lvG5 . clxn] klg&) cªseGbftnem/]sf]] cf/P;cfO{n] ahf/ cf]e/ a6 l:yltdf g/x]sf] ;+s]t
ub{5 t/ la:tf/} dflycfpg ;Sg] l:ylt b]lvG5 . pkNnf] tyftNnf] Jof08 aLrsf] b'/Ldfb]lvPsf] sdLn]
ahf/sf] cl:y/tfdfeg]sdLePsf] ;+s]t ub{5 .xfnsf] cj:yfdfgofF 6]jfcªstyfk|lt/f]w cªs s||dzM !^*)
tyf !**) sfod /x]sf] 5 .;du|df x]bf{ ahf/ laol/; l:yltaf6 aflx/ cfPsf]b]lvG5 .](https://image.slidesharecdn.com/nepsetechnicalanalysisseptember4-september82016-160913042648/85/Nepse-Technical-Analysis-September-4-September-8-2016-8-320.jpg)

The Nepse index gained 17.87 points last week to close at 1823.05, supported by dividend announcements from listed companies. Technical indicators like MACD and RSI show the market has bullish momentum. The index is trading above its 50-day and 200-day moving averages, suggesting an optimistic outlook. Support remains at 1680 with resistance at 1880, above which the index is expected to move in the coming days given ongoing positive sentiment.


