Download to read offline

![k|fljlwsljZn]if0f
!_ahf/ ;f/f+z -a}zfv @, @)&#;Ddsf]_
aGb cªs -a}zfv @, @)&#_ !$)%=&*
pRr cªs -uPsf] ;ftf_ !$)%=&*
;fKtflxs kl/jt{g @*=#^ -@=)%k|ltzt_
b}lgscf};t Jofkf/ ¿=%&=@)s/f]8
s'n ;fKtflxsJofkf/ ¿ @@*=*! s/f]8
cf/P;cfO{ *!=**
PdP;L8L @%=%#
l;UgnnfO{g @%=)%
@_ ahf/ k|j[lt
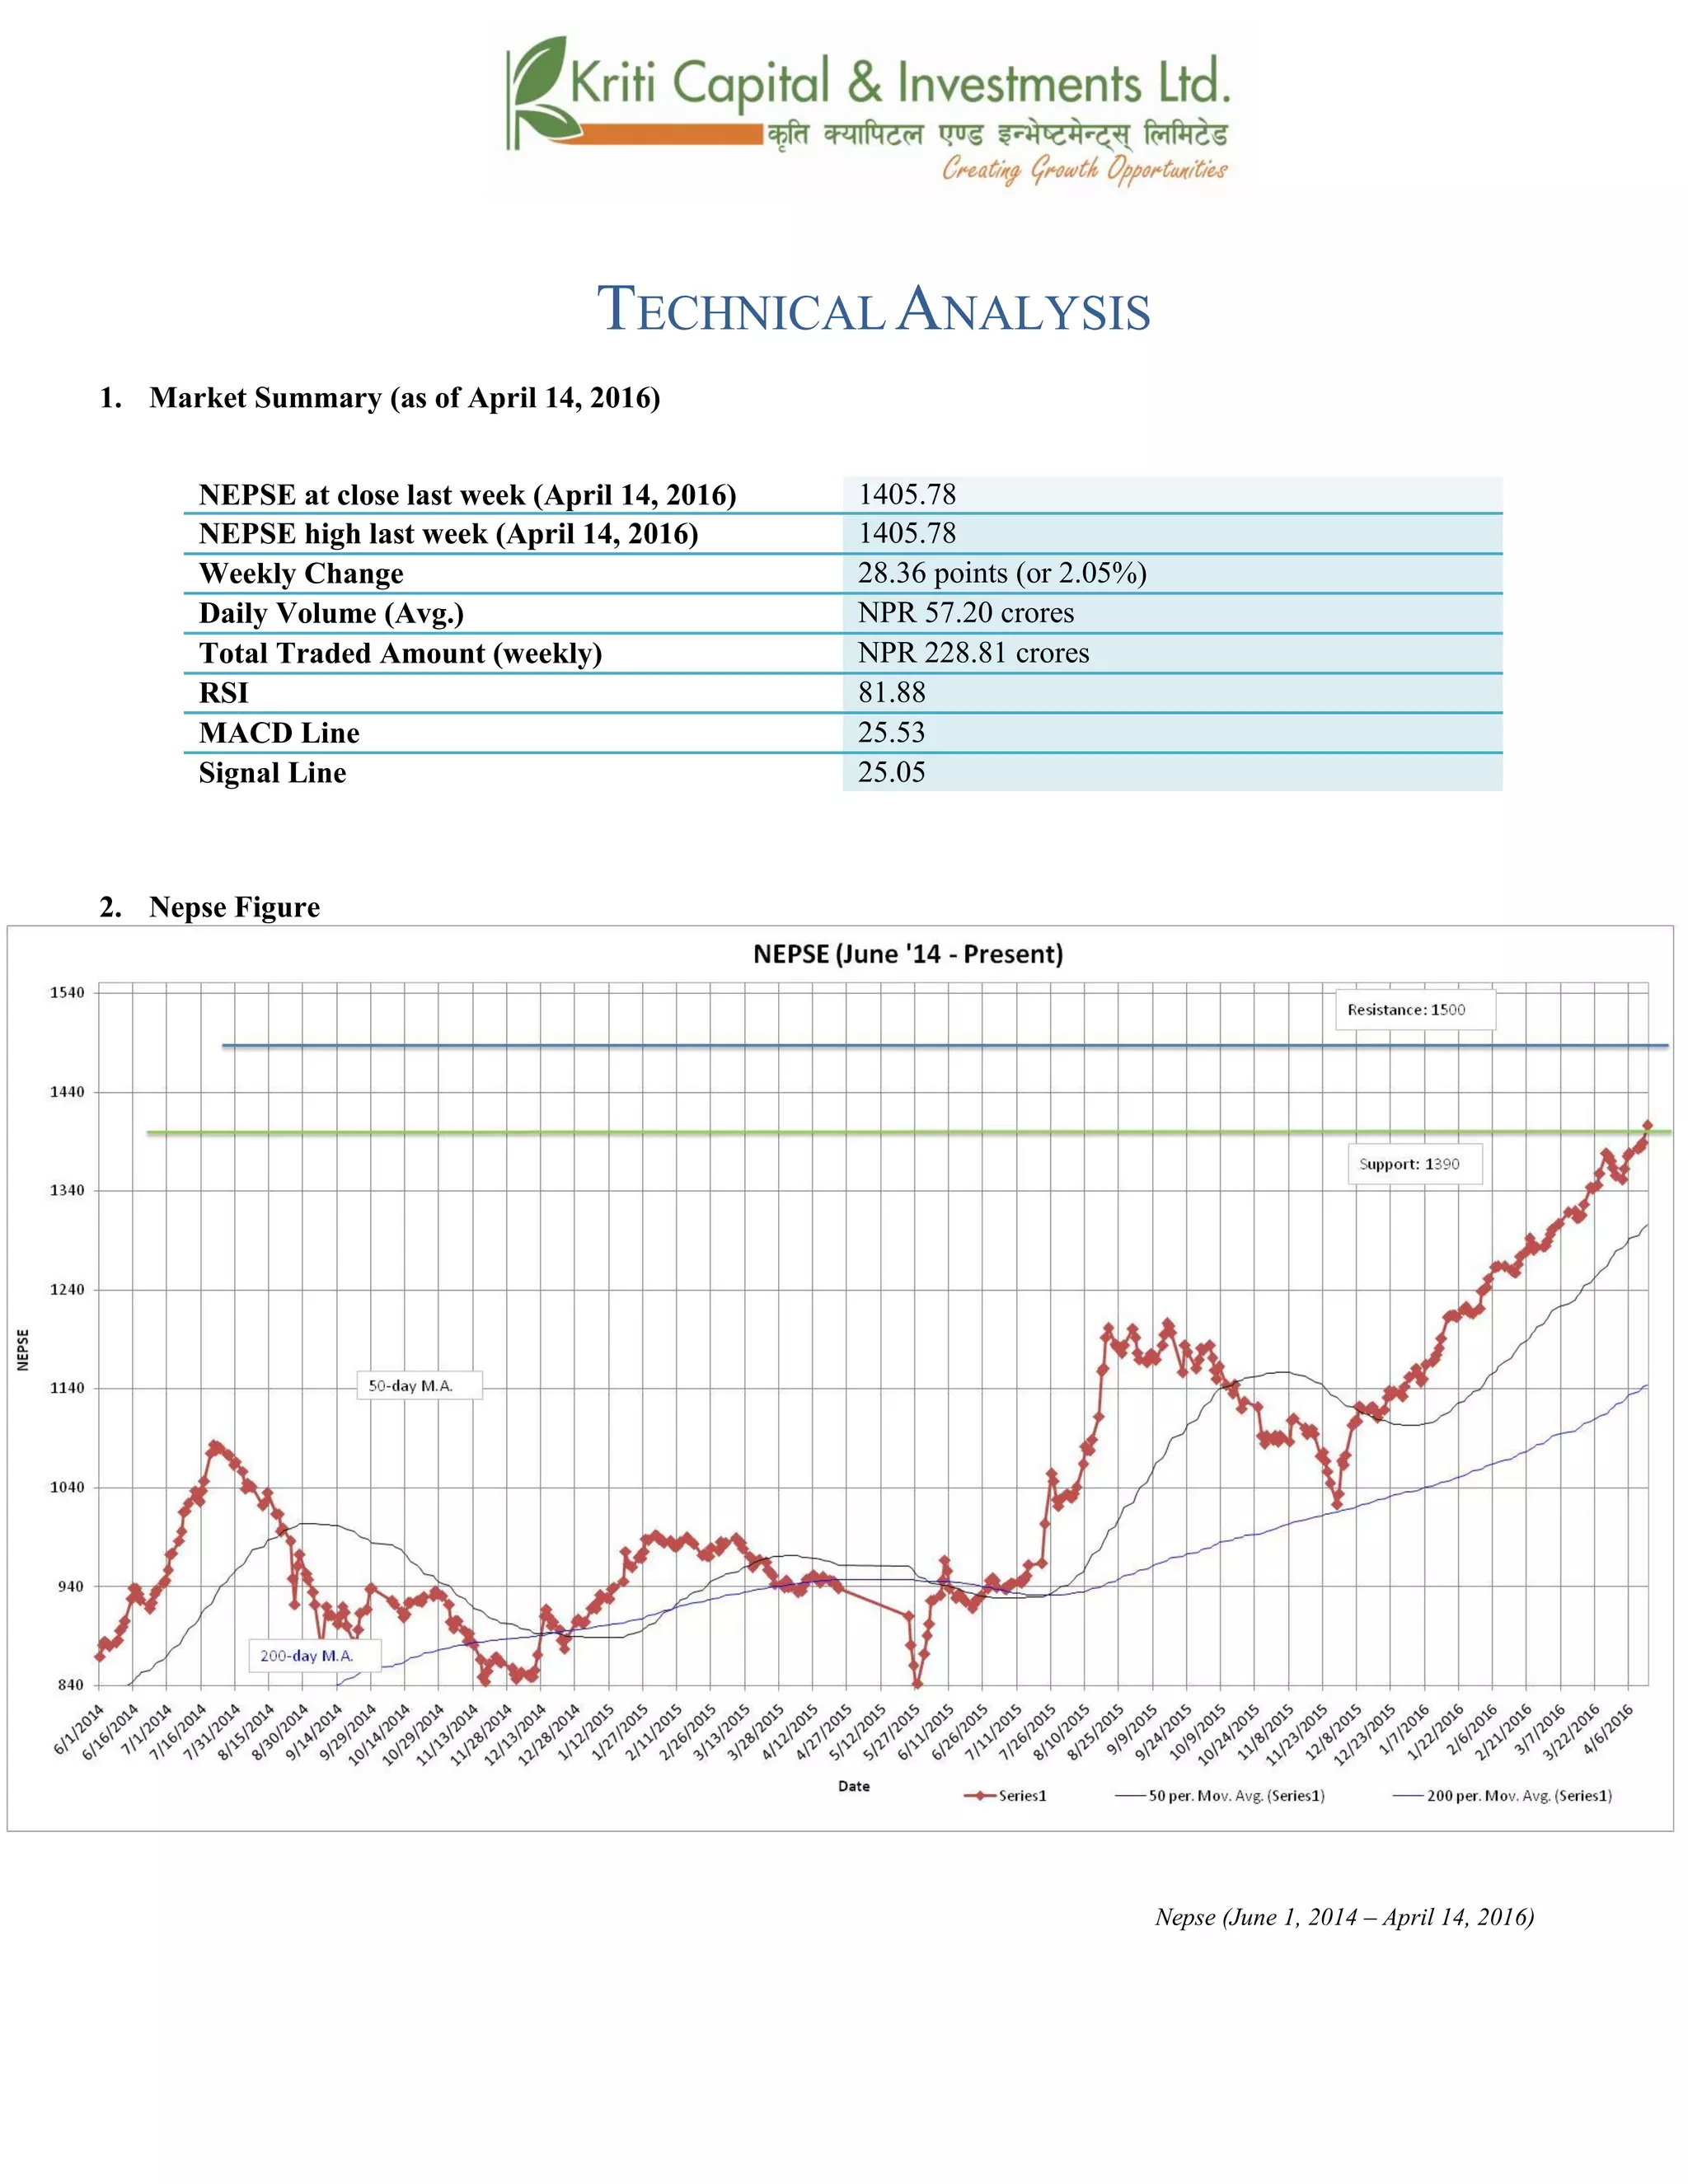
Nepse (June 1, 2014 – April 14th, 2016)](https://image.slidesharecdn.com/nepsetechnicalanalysisapril10-april142016-160418044524/85/Nepse-Technical-Analysis-April-10-April-14-2016-5-320.jpg)
![#_ 6]«G8 ljZn]if0f
uPsf] ;ftf g]K;] kl/;"rsn] gofF ;fnsf] z'?cftcfkmgf] Oltxf; s} pRr cªsaf6 ug{ k'Uof] . @*=#^
cªssf] a[[l4 ;Fu} g]K;] !$)%=&* cªsdfaGbeof] . uPsf] ;ftf g]K;] kl/;"rsdfljsf; a}+s If]qlt/ ;a}
eGbf a9L a[l4 b]lvof] . ;du|dfclxn] klg kl/;"rs %) lbg] d'leËPe/]h tyf @)) lbg] d'leËeGbfdfly g}
rln/x]sf] cj:yf ;du|dfahf/sf] l:ylt /fd|f] b]lvG5 .
$_ 6]jftyfk|lt/f]w cªs
glhssf] 6]jfcªs !#()
6]jfcªs @ !#%)
glhssf] k|lt/f]w cªs !%))
uPsf] ;ftfg]K;] kl/;"rsn] cfkmgf] glhssf] k|lt/f]w cªs !#() ;d]t kf/ u/]sf] cj:yf /xof] . h;sf]
kmn:j?kahf/dfclxn] klga'lnz 6]«G8 alnof] ?kdfsfod /x]sf] ;+s]t ub{5 . xfngofFglhssf] 6]jfcªs !#()
tyfgofFglhssf] k|lt/f]w cªs !%)) /x]sf] 5 .
%_ g]K;] 6]«G8 ;"rs
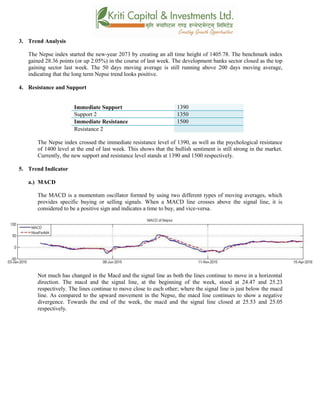
s_ d'leª Pe/]hsGeh]{G; 8fOeh]{G; -PdP;L8L_
PdP;L8Ldf b'O{ cf]6f /]vf x'G5g, h;df Pp6fn] ahf/sf] lbzf kl/jt{gsf] ;+s]t u5{ eg] csf]{n] ahf/sf]
k|j[lQ -6«]08_ b]vfpg] u5{ . olb PdP;L8L /]vfn] l;Ung /]vfnfO{ tnaf6 dfly sf6]dfo;nfO{ ;sf/fTds
;+s]tsf ?kdflnO{G5 / o;n] z]o/x? lsGg] ;+s]t ub{5 .
uPsf] ;ftfsf] z'?df PdP;L8L nfO{gtyfl;UgnnfO{g s|dzM @%=$&tyf @%=@#sf] l:yltdf /x]sf] lyof] hf]
uPsf] ;ftfeGbf cl3Nnf] ;ftf ;/x g} /xof] .xfnsf] cj:yfdfklgb'j} nfO{g ;Fu ;Fu} rln/x]sf] cj:yf
/x]sf] 5 hxfFl;UgnnfO{gPdP;L8L nfO{g eGbfxnsftn /x]sf] 5 . uPsf] ;ftf g]K;] kl/;"rsdf s]xL a[l4
b]lvPtfklgb'j} nfO{g l;wfhfg'nfO{ xfn kl/;"rstyfb'O{ nfO{g aLrssf] ;DaGwdfnegative divergence
/x]sf];+s]t ub{5 . ;ftfsf] cGTodfPdP;L8L nfO{g tyfl;Ugns|dz M @%=%# tyf @%=)% /x]sf] 5 .](https://image.slidesharecdn.com/nepsetechnicalanalysisapril10-april142016-160418044524/85/Nepse-Technical-Analysis-April-10-April-14-2016-6-320.jpg)
![v_ l/n]l6j :6«]Gy OG8]S; -cf/P;cfO{_
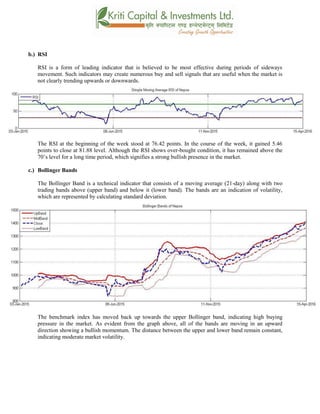
cf/P;cfO{ k|fljlwsljZn]if0fsf] o:tf] cf}hf/ xf], h;nfO{ Pstlkm{ ?kdfrln/x]sf] ahf/dfJofkf/ /0fgLlt
agfpg a9L pkof]uL dflgG5 . To;}u/L, o;n] ahf/dfvl/b / ljlqmsf] :ki6 ;+s]t b]vfpg] u5{ .
cf/P;cfO{uPsf] ;ftfsf] z'?df&^=$@cªsdf/x]sf] lyof] . t/ km]l/ ;ftfsf]
afFsLlbgx?dfcf/P;cfO{df%=$^cªs a[l4 ;Fu} cf/P;cfO{ *!=** cªsdfaGbeof] . w]/} nfdf] ;do b]lv
&) cªseGbfdfly /x]sf] cf/P;cfO{n] ahf/dfalnof] a'lnz 6]«G8sf] ;+s]t ub{5 .
u_ af]lnªu/ Aof08
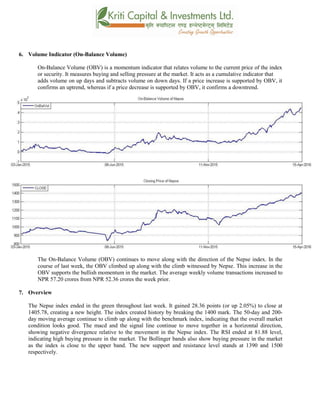
af]lnªu/ Aof08 Ps k|fljlwsljZn]if0f ;"rsxf] h;df @!–lbg] d'leËPe/]hsf ;fyb'O{ Aof08 -Pp6f
dfly_ / Pp6f tn_ x'G5g . lo Aof08x?n] cl:y/tfsf] ;+s]t ub{5g, h'g :6fG88{ 8]leP;g u0fgf
u/]/ kQfnufO{G5 .
uPsf] ;ftfklgg]K;] kl/;"rskm]l/ pkNnf] Aof08sf] glhsk'u]sf] cj:yf /xof] h;n] km]l/ ahf/dflsGg]
xf]8afhL /x]sf] ;+s]t ub{5 . clxn] klgdWo Aof0f8n] ahf/sf] nfluglhssf] 6]jfcªssf]
?kdfsfdul//x]sf] 5 . pkNnf] tyftNnf] Jof08 aLrdf s]xL b'/L clxn] klg /x]sf]n]
ahf/dfcl:y/tfcem} s]xLdfqfdf /x]sf] ;+s]t ub{5 .](https://image.slidesharecdn.com/nepsetechnicalanalysisapril10-april142016-160418044524/85/Nepse-Technical-Analysis-April-10-April-14-2016-7-320.jpg)
![;du{dfM
uPsf] ;ftf g]K;] kl/;"rsdf km]l/@*=#^cªssf]] a[l4 b]lvof]h;sf] kmn:j?k kl/;"rsOltxf;
s}!$)%=&*cªsdfaGbeof] . clxn] klg kl/;"rs %) lbg] d'leËPe/]h tyf @)) lbg]
d'leËeGbfdflyuO{/x]sf] cj:yfn] ahf/ ;sf/fTds l:yltdf g} /x]sf] ;+s]t ub{5 . PdPl;l8 nfO{g
tyfl;UgneGbfclxn] klg ;Fu} ;Fu} Pp6} l;wfnfO{g rNg'n] g]K;] kl/;"rstyfb'j} nfO{g aLrssf]
;DaGwdfnegative divergence /x]sf] ;+s]t ub{5 . &) cªseGbfdfly /x]sf] cf/P;cfO{ clxn] klgahf/
cf]e/ a6 l:yltdf /x]sf] ;+s]t ub{5 . af]lnªu/ Aof08n] ;d]t ahf/sf] lsGg] xf]8afhL s]xL a9]sf] ;+s]t
ub{5 / b'O{ nfO{g aLr a9g uPsf] b'/Ln] ahf/sf] cl:y/tf s]xL a9]sf] ;+s]t ub{5 . xfnsf] cj:yfdfgofF
6]jfcªstyfk|lt/f]w cªs s||dzM !#() tyf !%)) g} /x]sf] 5 .](https://image.slidesharecdn.com/nepsetechnicalanalysisapril10-april142016-160418044524/85/Nepse-Technical-Analysis-April-10-April-14-2016-8-320.jpg)

- The Nepse index gained 28 points last week to close at an all-time high of 1405 points, as the bullish sentiment in the market remains strong. - Technical indicators like the MACD and RSI show the market is in an overbought condition in the short-term, though the long-term trend remains positive. - New support and resistance levels have been established at 1390 and 1500 respectively.


