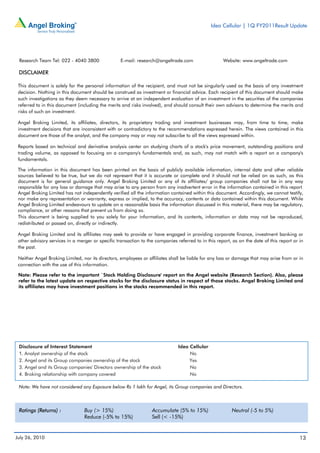
1QFY2011 Result Update | Telecom
                                                                                                                                  July 26, 2010


 Idea Cellular                                                                                   REDUCE
                                                                                                 CMP                                       Rs68
 Performance Highlights                                                                          Target Price                              Rs58
Parameter (Rs cr)            1QFY11       4QFY10 %chg (qoq)           1QFY10      %chg (yoy)    Investment Period                  12 Months
Net Revenues                   3,654         2,976          22.8         3,348          9.1
EBIDTA Margins (%)                24.3        28.9          (4.6)         27.6         (3.3)    Stock Info
PAT                               201          297        (32.2)            267       (24.5)    Sector                                    Telecom
Source: Company, Angel Research                                                                 Market Cap (Rs cr)                         22,326
                                                                                                Beta                                         0.75
Strong top-line performance, however margin erosion continues: For 1QFY2011,
                                                                                                52 Week High / Low                   84.9/47.1
Idea Cellular witnessed an impressive broad-based growth of 22.8% yoy (9.1%
qoq) in its consolidated top-line, which was ahead of our and consensus estimates.              Avg. Daily Volume                       1485520

The mobile business revenues grew by 21.4% yoy (10.3% qoq) on account of                        Face Value (Rs)                                10
robust improvement in total Minutes of Usage (MoUs), which were up by 69% yoy                   BSE Sensex                                 18,020
(20.5% qoq) to 82,274 minutes. The total subscriber base (including Spice) moved                Nifty                                       5,419
up by 8% qoq to 68.9mn in 1QFY2011. The national long distance (NLD) business                   Reuters Code                              IDEA.BO
grew by 104.3% yoy (6.1% qoq), while the passive infrastructure business grew by                Bloomberg Code                       IDEA@IN
26.8% yoy (7.8% qoq). At the EBIDTA level, margins witnessed strong erosion of
458bp yoy (327bp qoq) owing to the higher than expected increase in operational
                                                                                                Shareholding Pattern (%)
costs. However, the tax rate fell from 9.5% in 4QFY2010 to 3.5% in 1QFY2011.
                                                                                                Promoters                                   47.0
Thus, mainly on account of lower operational profitability, bottom-line declined by
                                                                                                MF / Banks / Indian Fls                      9.6
32.2% yoy (24.5% qoq including one-time other income in 4QFY2010). Excluding
one-time income in 4QFY2010, profit was down by 32.2% yoy (6.2% qoq).                           FII / NRIs / OCBs                           40.1
                                                                                                Indian Public / Others                       3.3
Outlook and Valuation: We expect Idea to record 22% CAGR in top-line over
FY2010-12E, aided by continued strong subscriber additions, value added services
revenues and higher revenues from 3G roll outs. However, intense competitive                    Abs. (%)                   3m      1yr        3yr
pressures are expected to restrict the bottom-line CAGR to 4.6% over the period. At             Sensex                     1.5   17.2       14.2
the CMP, the stock is trading at fair valuations of 21.4x FY2012E EPS. Hence, we                Idea Cellular              4.0   (15.3)     (48.5)
recommend a Reduce on the stock, with a Target Price of Rs58, implying a forward
P/E of 12x for its core business’s FY2012E EPS of Rs3.2 and Rs20 per share for its
16% stake in Indus Towers.


Key Financials (Consolidated)
 Y/E March (Rs cr)            FY2009           FY2010             FY2011E         FY2012E
 Net Sales                     10,154           12,447              15,464         18,608
 % chg                            51.1            22.6                 24.2          20.3
 Net Profit                       882              954                 811          1,045
 % chg                          (15.4)              8.2              (15.0)          28.9
 FDEPS (Rs)                        2.7              2.9                 2.5            3.2
 EBITDA Margin (%)               27.9             27.4                23.4           23.0
 P/E (x)                         25.3             23.4                27.5           21.4
 P/BV (x)                          1.5              1.9                 1.8            1.6
 RoE (%)                           6.4              8.0                 6.4            7.6
 RoCE (%)                          6.4              7.2                 5.8            7.4     Vibha Salvi
 EV/Sales (x)                      2.3              2.3                 2.0            1.6     022 – 4040 3800 Ext: 329
 EV/EBITDA (x)                     8.2              8.3                 8.4            7.1     vibhas.salvi@angeltrade.com
Source: Company, Angel Research


Please refer to important disclosures at the end of this report                                                                                 1
Idea Cellular | 1Q FY2011Result Update


 Exhibit 1: 1QFY2011 Performance (Consolidated)
 Y/E March (Rs cr)                FY2011       FY2010         % chg      FY2010       % chg           FY2010    FY2009       % chg
                                     1Q                1Q      (yoy)           4Q     (qoq)
 Net revenues                      3,654           2,976       22.8          3,348      9.1           12,447     10,154       22.6
 Operating expenditure             2,765           2,116       30.7          2,424     14.1            9,040         7,318    23.5
 EBITDA                             888               860       3.3           923      (3.8)           3,407         2,836    20.1
 Other income                          -                 -                     52          -             84              -        -
 Interest charges (Net)             114                87      31.3           114       0.1             401           495    (19.0)
 Depreciation & Amortisation        566               456      24.2           567      (0.2)           2,015         1,403    43.6
 Income before taxes                209               317     (34.3)          295     (29.2)           1,075          939     14.5
 Tax                                  7                20                      28                       121            58    111.0
 Net income                         201               297     (32.2)          267     (24.5)            954           882      8.2
 Diluted EPS (Rs)                    0.6               1.0    (36.5)           0.9    (28.2)             2.9           2.7     7.4
 EBITDA margin (%)                  24.3              28.9                    27.6                      27.4          27.9    22.6
 Net profit margin (%)               5.5              10.0                     8.0                       7.7           8.7
 Mobile ARPUs (Rs/user/month)       182               232     (21.6)          185      (1.6)            214           267    (19.8)
Source: Company, Angel Research


                                           Exhibit 2: 1QFY2011 – Actual v/s Angel estimates
                                            (Rs cr)                                    Estimates          Actual        Variation (%)
                                            Net revenue                                   3,497           3,654                  4.5
                                            EBIT margin (%)                                    26.8        24.3                 (2.5)
                                             PAT                                               248             201            (18.9)
                                           Source: Company, Angel Research


                                           Strong top-line growth aided by higher MoUs and subcriber additions

                                           For 1QFY2011, Idea Cellular registered an impressive broad-based growth of
                                           22.8% yoy (9.1% qoq) in consolidated top-line, which was ahead of our and
                                           consensus estimates. The mobile business reported revenue growth of 21.4% yoy
                                           (10.3% qoq). However, normalised revenue of the segment grew 5.4% qoq taking
                                           into consideration the full quarter impact of the revenues from Spice
                                           Communications compared to the one-month revenue of the company included in
                                           4QFY2010, as the amalgamation took place with effect from March 1, 2010. The
                                           growth in mobile business was driven by robust improvement in the Total Minutes
                                           of Usage (MoUs), which surged 69% yoy (20.5% qoq) to 82,274 minutes. The
                                           total subscriber base (including Spice) moved up 8% qoq to 68.9mn in
                                           1QFY2011. However, on account of the hyper-competitive market conditions the
                                           average realised rate (ARR) during the quarter stood lower by 6.4%, a decline to
                                           44 paise per minute.

                                           The NLD business grew by 104.3% yoy (6.1% qoq) during the quarter, while the
                                           passive infrastructure business recorded 26.8% yoy (7.8% qoq) growth.


July 26, 2010                                                                                                                         2
Idea Cellular | 1Q FY2011Result Update


                 Exhibit 3: Total MoUs - Growth trend
                 (Mn minutes)
                  65,000
                  55,000
                  45,000                                         CQGR 13.7%

                  35,000
                  25,000
                  15,000
                   5,000


                            4QFY07

                                     1QFY08

                                              2QFY08

                                                       3QFY08

                                                                4QFY08

                                                                         1QFY09

                                                                                   2QFY09

                                                                                            3QFY09

                                                                                                     4QFY09

                                                                                                              1QFY10

                                                                                                                       2QFY10

                                                                                                                                3QFY10

                                                                                                                                         4QFY10

                                                                                                                                                  1QFY11
                Source: Company, Angel Research

                High operational costs exert pressure on margins

                Idea’s consolidated EBIDTA margins witnessed strong erosion of 458bp yoy (327bp
                qoq) during the quarter. The network operating costs, license charges and roaming
                and access charges shot up by 258bp, 29bp and 159bp qoq respectively, during
                the quarter.

                Idea standalone continued to witness EBIDTA losses in its new service areas for the
                fourth consecutive quarter. The quantum of loss was however lower at Rs140cr in
                1QFY2011 compared to Rs142cr in 4QFY2010. Thus, though the EBIDTA margins
                of the company’s established circles continued to bleed by 460bp yoy (280bp qoq),
                the reduction in EBIDTA losses in new areas coupled with continuous sequential
                improvement in Indus margins restricted further margin erosion during the quarter.

                Lower operational profitability impacted bottom-line

                Idea witnessed a slight 0.1% qoq increase in interest cost, which was mainly due to
                forex fluctuation. However, the company capitalised interest cost of Rs40.4cr
                against payment for 3G auction fee and thus it did not impact the bottom-line
                during the quarter. However, depreciation cost increased by 24.2% yoy (down 0.2%
                qoq), while the tax rate fell from 9.5% in 4QFY2010 to 3.5% in 1QFY2011.

                During 4QFY2010, Idea had recorded a one-time income of Rs51.9cr due to the
                write-back of provisioning for the lease rentals with respect to the service areas of
                Spice. Including this one-time income, bottom-line came in lower by 32.2% yoy
                (24.5% qoq). Excluding the one-time income, bottom-line fell by 32.2% yoy (6.2%
                qoq).


July 26, 2010                                                                                                                                              3
Idea Cellular | 1Q FY2011Result Update


                Exhibit 4: Segment-wise gross revenue break-up
                                                      1QFY11      1QFY10        4QFY10        % chg     % chg
                Particulars (Rs cr)                                                             yoy       qoq
                 Mobility                               3,654         3,010       3,312        21.4      10.3
                 National Long Distance                   440           216         415       104.3       6.1
                 Passive Infra Services                   279           220         259        26.8       7.8
                 Other Operating Income                     -             1           -
                 Total Gross Revenues                   4,373        3,446        3,986        26.9        9.7
                 Less:          Inter-segment
                 eliminations                             719           470         638        52.9       12.7
                 Total                                  3,654        2,976        3,348        22.8        9.1
                Source: Company, Angel Research


                 Exhibit 5: Mobility business – Operating metrics (including Spice)
                                                     1QFY11        1QFY10      4QFY10       % chg       % chg
                 Particulars (Rs cr)                                                           yoy         qoq
                 Revenues (Rs cr)                      3,654         2,976       3,348         22.8        9.1
                 Mobile subscriber base (Mn)            68.9          42.8        63.8         61.0        8.0
                 Mobile ARPUs (Rs/month)                 182           232         185       (21.6)      (1.6)
                 Total minutes of usage (Mn)          82,274        48,729      68,275         68.8       20.5
                 Minutes of use/user/month               415           399         398          4.0        4.3
                 Revenues per minute (Rs)               0.44          0.58        0.47       (24.1)      (6.4)
                 EBITDA (Rs cr)                          888           860         923          3.3      (3.8)
                 EBITDA Margins (%)                     24.3          28.9        27.6        (4.6)      (3.3)
                 EBITDA/minute (Rs)                     0.11          0.18        0.14       (38.8)     (20.2)
                Source: Company, Angel Research; Note: These metrics are for the 22 service areas including those
                of Spice Communication


July 26, 2010                                                                                                    4
Idea Cellular | 1Q FY2011Result Update


                Exhibit 6: Revenue, EBITDA and EBITDA margin break-up
                                                                                              % chg      % chg
                (Rs cr)                                  1QFY11 1QFY10 4QFY10
                                                                                                yoy        qoq
                                                          Revenues
                Established circles - 11                   3,383        2,746      3,025       23.2       11.8
                Newer circles - 9
                                                              306         143    276          114.6       10.9
                Idea Standalone - 20 service areas*         3,690       2,888     3,301        27.7       11.8
                Proportionate - Spice (2 Circles)
                                                                 -        136    98         (100.0)     (100.0)
                Proportionate - Indus
                                                              255         199    234           28.3         9.4
                Inter-segment eliminations
                                                              291         247    285           17.9         2.1
                Idea Consolidated - 20 service
                areas*                                      3,654       2,976      3,348       22.8         9.1
                                                            EBITDA
                Established circles - 11                      934         835         975      11.9       (4.2)
                Newer circles - 9
                                                             (140)        (64)      (142)     117.5       (1.5)
                Idea Standalone - 20 service areas*           794         770        833        3.1       (4.7)
                Proportionate – Spice (2 Circles)
                                                                  -        29           7           -          -
                Proportionate - Indus
                                                           95        61                84      56.5       13.4
                Idea Consolidated - 22 service
                areas*                                   888       860                923        3.3      (3.8)
                                                 EBITDA Margins (%)
                Established circles - 11                 27.6      30.4              32.2      (2.8)      (4.6)
                Newer circles - 9                      (45.7)    (45.1)            (51.5)      (0.6)        5.8
                Idea Standalone - 20 service areas*     21.5      26.7              25.2       (5.2)      (3.7)
                Proportionate – Spice (2 Circles)
                                                                 -       21.6        7.3      (21.6)      (7.3)
                Proportionate - Indus                         37.1       30.4       35.8         6.7        1.3
                Idea Consolidated - 22 service
                areas*                                        24.3       28.9       27.6       (4.6)      (3.3)
                Source: Company, Angel Research; Note: (i) As on 1QFY2011 new service areas include Mumbai,
                Bihar, Orissa, Tamil Nadu, J&K, Kolkata, W Bengal, Assam and North East; (ii) For 1QFY2011,
                Idea standalone covers 22 service areas including Punjab and Karnataka circles of Spice, whereas
                for 1QFY2010 and 4QFY2010 the Idea standalone statistics exclude Spice numbers as the
                amalgamation was effective from March’10.


July 26, 2010                                                                                                 5
Idea Cellular | 1Q FY2011Result Update


                Investment Arguments

                Hyper competition looms over the industry; survival of the fittest

                We believe that the status of Indian telecom sector would continue to remain
                challenging if the operations continue at lower tariffs to combat hyper-competition
                - currently on an average there are 10-12 telecom operators per circle in India
                compared to 4-5 in the developed markets of US and Europe. TRAI is still
                resolving the 2G related issues, while the MNP is still not implemented. Thus, we
                believe that consolidation would be the right way ahead for the industry, and the
                telecom service providers (TSP) with strong market positioning and healthy
                financials would sustain the blows better than smaller ones, discarding unhealthy
                competition and promoting steady growth of the sector.

                Continuous fall in tariffs and 3G funding to erode profitability

                 Though Idea witnessed a 24.1% yoy decline in Revenue per minute (RPM) from 58
                paise per minute in 4QFY10 to 44 paise per minute in 1QFY2011, it managed to
                bring down the cost per minute from 44 paise to 35 paise during the period. If
                tariffs fall from current levels of 44 paise per minute, it would be difficult for
                management to sustain below 35 paise cost per minute going forward. Taking this
                into consideration and with increased opex on account of higher investments on
                technology and network to remain competitive, higher debt and capex for the 3G
                roll out resulting in higher interest and depreciation costs would erode the
                company’s profitability for at least an year.

                No clarity on 3G roll-out due to regulatory issues

                 We believe that the inflow from 3G roll out would be a reliever to the current pain
                that the Indian telecom industry is going through. However, the roll out is expected
                to happen from December’10 onwards with no clarity on the exact date of the roll
                out. The funds raised for the 3G roll outs would result in higher interest and
                depreciation costs, which would be charged to the books once the roll out begins.

                Outlook and Valuation

                We expect Idea to record 22% CAGR in top-line over FY2010-12E, aided by
                continued strong subscriber additions, value added services revenues and higher
                revenues from 3G roll outs. However, intense competitive pressures are expected
                to restrict bottom-line CAGR to 4.6% over the period. We believe that the
                competitive landscape would witness some consolidation and stability from
                FY2012E onwards. At the CMP, the stock is trading at fair valuations of 21.4x
                FY2012E EPS. Hence, we recommend a Reduce on the stock, with a Target Price
                of Rs58, implying a forward P/E of 12x for its core business’s FY2012E EPS of
                Rs3.2 and Rs20 per share for its 16% stake in Indus Towers.


July 26, 2010                                                                                      6
Idea Cellular | 1Q FY2011Result Update


                Exhibit 7: Key Assumptions
                 Parameter (%)                                                                                                                                          FY2011E                                   FY2012E
                 Subscriber growth                                                                                                                                                   28.5                                     16.0
                 Monthly ARPUs                                                                                                                                                  (15.0)                                        (2.0)
                 EBIDTA margin                                                                                                                                                       23.4                                     23.0
                 Tax rate                                                                                                                                                            10.8                                     18.0
                 EPS growth                                                                                                                                                     (15.0)                                        28.9
                 Source: Company, Angel Research


                Exhibit 8: Change in estimates
                                                                                                   FY2011E                                                                                    FY2012E
                                                                    Earlier                         Revised                                                    Earlier                          Revised
                                                                                                                                  Var (%)                                                                                     Var (%)
                                                                   Estimates                       Estimates                                                  Estimates                        Estimates
                 Net Revenues                                           14,557                          15,464                                  6.2                 16,510                             18,608                        12.7
                 EBIDTA
                                                                                 23.2                         23.4                              0.2                         23.7                           23.0                      (0.7)
                 (margins)
                 Other Income                                                      51                                39                (24.1)                                  66                               56                (15.5)
                 PBT                                                             673                            909                      35.1                               991                         1,274                        28.6
                 Tax                                                             121                                 98                (19.0)                               178                                 229                  28.6
                 PAT                     551                                                                    811                      47.0                               812                         1,045                        28.6
                Source: Company, Angel Research

                We have revised upwards our FY2011E and FY2012E top-line estimates, based on
                the robust 15-20% sequential growth in MoUs being witnessed by the company
                since the past few quarters on the back of increased subscriber additions and wins
                in new circles. These, we believe, will drive better than expected growth on top-
                line. We expect the strong top-line growth to take care of strong erosion in EBIDTA
                as expected earlier. The lower tax rate in 1QFY2011 would lower the effective tax
                rate to 11% from earlier expected 18% in FY2011. However, the tax rate for
                FY2012E is expected to remain at 18%. Thus, we have upgraded our PAT
                estimates for FY2011E and FY2012E by 47% and 29% respectively and Target
                Price from Rs50 earlier to Rs58.


                Exhibit 9: One-year forward P/E band

                                     30000
                                                                                                                                                                                                                                           25x
                                     25000
                                                                                                                                                                                                                                           20x
                                     20000
                  Share Price (Rs)


                                     15000                                                                                                                                                                                                 15x


                                     10000                                                                                                                                                                                                 10x


                                      5000

                                         0
                                                      Jul-05


                                                                                          Jul-06


                                                                                                                              Jul-07


                                                                                                                                                                   Jul-08


                                                                                                                                                                                                       Jul-09
                                                                        Jan-06


                                                                                                            Jan-07


                                                                                                                                                 Jan-08


                                                                                                                                                                                     Jan-09


                                                                                                                                                                                                                         Jan-10
                                             Apr-05


                                                                                 Apr-06


                                                                                                                     Apr-07


                                                                                                                                                          Apr-08


                                                                                                                                                                                              Apr-09


                                                                                                                                                                                                                                  Apr-10
                                                               Oct-05


                                                                                                   Oct-06


                                                                                                                                       Oct-07


                                                                                                                                                                            Oct-08


                                                                                                                                                                                                                Oct-09


                Source: Company, Angel Research


July 26, 2010                                                                                                                                                                                                                                    7
Idea Cellular | 1Q FY2011Result Update


 Exhibit 10: Recommendation Summary
 Company            Reco.         CMP    Tgt Price   Upside   FY2012E     FY2012E        FY2010-12E     FY2012E    FY2012E
                                  (Rs)        (Rs)      (%)    P/BV (x)     P/E (x)    EPS CAGR (%)     RoCE (%)    RoE (%)
 Bharti Airtel   Accumulate       320        360      12.4         2.1       12.9               1.9        18.6       17.9
 Idea Cellular     Reduce          68          58    (14.3)        1.6       21.4               4.6          7.4       7.6
 RCOM                Sell         188        155     (17.6)        0.9       11.0             (10.9)         4.7       8.1
Source: Company, Angel Research


July 26, 2010                                                                                                                 8
Idea Cellular | 1Q FY2011Result Update


                Profit & Loss Statement (Consolidated)
                Y/E March (Rs cr)         FY2007 FY2008 FY2009      FY2010 FY2011E      FY2012E
                Gross sales                4,366   6,720 10,154     12,447    15,464     18,608
                Less: Excise duty              -       -        -         -         -         -
                Net Sales                  4,366   6,720 10,154     12,447    15,464     18,608
                Other operating
                                               -       -        -         -         -         -
                income
                Total operating income     4,366   6,720 10,154     12,447    15,464     18,608
                % chg                               53.9    51.1      22.6      24.2       20.3
                Total Expenditure          2,901   4,468   7,318     9,040    11,840     14,321
                Cost of Services           1,720   2,866   5,091     6,304     8,407     10,209
                SGA                         921    1,256   1,703     2,090     2,660      3,256
                Personnel                   261     346      525      645        773       856
                Other                          -       -        -         -         -         -
                EBITDA                     1,465   2,252   2,836     3,407     3,624      4,286
                % chg                               53.7    26.0      20.1       6.4       18.3
                (% of Net Sales)            33.6    33.5    27.9      27.4      23.4       23.0
                Depreciation&
                                            672     877    1,403     2,015     2,280      2,418
                Amortisation
                EBIT                        793    1,375   1,434     1,392     1,344      1,868
                % chg                               73.3     4.3      (2.9)     (3.5)      39.0
                (% of Net Sales)            18.2    20.5    14.1      11.2       8.7       10.0
                Interest & other
                                            305     278      495      401        474       650
                Charges
                Other Income                 21      17         -       84        39        56
                (% of PBT)                   4.1     1.6        -      7.8       4.3        4.4
                Share in profit of
                                               -       -        -         -         -         -
                Associates
                Recurring PBT               509    1,115    939      1,075      909       1,274
                % chg                              118.9   (15.8)     14.5     (15.5)      40.2
                Extraordinary
                                                       -        -         -         -         -
                Expense/(Inc.)
                PBT (reported)              509    1,115    939      1,075      909       1,274
                Tax                           7      73       58      121         98       229
                (% of PBT)                   1.4     6.5     6.1      11.3      10.8       18.0
                PAT (reported)              502    1,042    882       954       811       1,045
                Add: Share of earnings
                                               -       -        -         -         -         -
                of associate
                Less: Minority interest
                                               -       -        -         -         -         -
                (MI)
                Prior period items             -       -        -         -         -         -
                PAT after MI (reported)     502    1,042    882       954       811       1,045
                ADJ. PAT                    502    1,042    882       954       811       1,045
                % chg                              107.6   (15.4)      8.2     (15.0)      28.9
                (% of Net Sales)            11.5    15.5     8.7       7.7       5.2        5.6
                Basic EPS (Rs)               1.9     4.0     2.8       2.9       2.5        3.2
                Fully Diluted EPS (Rs)       1.5     3.2     2.7       2.9       2.5        3.2
                % chg                        0.0   107.6   (15.4)      8.2     (15.0)      28.9


July 26, 2010                                                                                 9
Idea Cellular | 1Q FY2011Result Update


                Balance Sheet (Consolidated)
                Y/E March (Rs cr)           FY2007 FY2008     FY2009 FY2010E FY2011E FY2012E
                 SOURCES OF FUNDS
                Equity Share Capital         2,593    2,635    3,100     3,300    3,300    3,300
                Preference Capital               -        -        2        2        2        2
                Reserves& Surplus            (413)     909    10,727     8,574    9,385   10,430
                Shareholders Funds           2,180    3,545   13,829    11,876   12,687   13,732
                Minority Interest                -        -         -        -        -        -
                Total Loans                  4,251    6,515    8,917     7,859   11,197   12,125
                Deferred Tax Liability          1       66        92      214         -        -
                Total Liabilities            6,431   10,126   22,837    19,950   23,884   25,857
                APPLICATION OF
                FUNDS
                Gross Block                  7,047   11,014   21,147    27,059   31,457   35,004
                Less: Acc. Depreciation      2,631    3,124    5,998     8,891   11,171   13,589
                Net Block                    4,417    7,890   15,149    18,168   20,286   21,415
                Capital Work-in-
                                              507     1,037    1,495      547      547      547
                Progress
                Goodwill (Incl. net
                                             1,192    1,795    2,246        6        6        6
                intangibles)
                Investments                     1         -         -        -        -        -
                Current Assets               2,466    2,106    3,403      726     2,514    3,358
                Cash                         1,820    1,053    5,132     1,420    2,514    3,358
                Loans & Advances              400      774    (1,729)        -        -        -
                Other                         246      278          -    (695)        -        -
                Current liabilities          2,152    2,702         -        -        -        -
                Net Current Assets            314     (596)    3,403      726     2,514    3,358
                Mis. Exp. not written off        -        -      544      504      531      531
                Total Assets                 6,431   10,126   22,837    19,950   23,884   25,857


July 26, 2010                                                                                10
Idea Cellular | 1Q FY2011Result Update


                Cash Flow Statement (Consolidated)
                Y/E March (Rs cr)       FY2007 FY2008      FY2009 FY2010E FY2011E         FY2012E
                Profit before tax         509    1,115         939     1,075       909      1,274
                Depreciation              672     877        1,403     2,015     2,280      2,418
                Change in Working
                                             -    222        (413)     (695)       695      (120)
                Capital
                Less: Other income         21    (327)       (444)        84        39         56
                Direct taxes paid           7      19          108       121        93        229
                Cash Flow from
                                         1,153   2,522       2,264     2,190     3,747      3,287
                Operations
                (Inc)./ Dec in Fixed
                                             - (5,558)      (6,749)   (4,077)   (4,398)    (3,547)
                Assets
                (Inc)./ Dec. in
                                             -   (512)      (3,425)         -         -          -
                Investments
                (Inc)./ Dec. in loans
                                             -       -            -    1,115    (1,533)       349
                and advances
                Other income               21      92          151        84        39         56
                Cash Flow from
                                           21 (5,977)     (10,023)    (2,878)   (5,892)    (3,143)
                Investing
                Issue of Equity                   319        9,369       200         0           -
                Inc./(Dec.) in loans             2,265       1,597    (1,057)    3,338        928
                Dividend Paid (Incl.
                                             -    452          763       121        98        229
                Tax)
                Others                       -       -         146          -         -          -
                Cash Flow from
                                             -   2,132      10,348     (979)     3,240        699
                Financing
                Inc./(Dec.) in Cash      1,132 (1,323)       2,589    (1,666)    1,094        843
                Opening Cash
                                          149    1,820         497     3,086     1,420      2,514
                balances
                Closing Cash
                                         1,820    497        3,086     1,420     2,514      3,358
                balances


July 26, 2010                                                                                  11
Idea Cellular | 1Q FY2011Result Update


                Key Ratios
                Y/E March                   FY2007 FY2008 FY2009 FY2010E FY2011E FY2012E
                Valuation Ratio (x)
                P/E (on FDEPS)                44.5   21.4    25.3    23.4     27.5     21.4
                P/CEPS                        14.9    9.3     9.2     7.5      7.2      6.4
                P/BV                           8.0    5.0     1.5     1.9      1.8      1.6
                Dividend yield (%)             0.0    0.0     0.0     0.0      0.0      0.0
                EV/Sales                       4.5    3.3     2.3     2.3      2.0      1.6
                EV/EBITDA                     13.3    9.9     8.2     8.3      8.4      7.1
                EV / Total Assets              2.3    1.7     1.0     1.5      1.3      1.2
                Per Share Data (Rs)
                EPS (Basic)                    1.9    4.0     2.8     2.9      2.5      3.2
                EPS (fully diluted)            1.5    3.2     2.7     2.9      2.5      3.2
                Cash EPS                       4.5    7.3     7.4     9.0      9.4     10.5
                DPS                            0.0       -       -       -       -        -
                Book Value                     8.4   13.5    44.6    36.0     38.4     41.6
                Dupont Analysis
                EBIT margin                   18.7   20.7    14.1    11.9      8.9     10.3
                Tax retention ratio           98.6   93.5    93.9    88.7     89.2     82.0
                Asset turnover (x)             0.6    0.6     0.6     0.7      0.7      0.8
                ROIC (Post-tax)               11.9   11.1     7.8     7.3      5.9      7.2
                Cost of Debt (Post Tax)        7.1    1.2     1.5     1.1      1.1      1.1
                Leverage (x)                   1.1    2.8     1.1     0.8      1.2      1.3
                Operating ROE                 17.3   38.3    14.6    12.3     11.9     15.2
                Returns (%)
                ROCE (Pre-tax)                12.3   13.6     6.4     7.2      5.8      7.4
                Angel ROIC (Pre-tax)                 20.5     9.9     7.3      6.3      7.7
                ROE                           23.0   29.4     6.4     8.0      6.4      7.6
                Turnover ratios (x)
                Asset Turnover (Gross
                                               0.6    0.6     0.5     0.5      0.5      0.6
                Block)
                Inventory / Sales (days)        5       5       2        -       -        -
                Receivables (days)            127      11       9      10      11       13
                Payables (days)               203     144     133     132     108      102
                Working capital cycle
                                             (125)   (128)   (122)   (121)    (97)     (89)
                (ex-cash) (days)
                Solvency ratios (x)
                Net debt to equity             1.1    1.5     0.3     0.5      0.7      0.6
                Net debt to EBITDA             1.7    2.4     1.3     1.9      2.4      2.0
                Interest Coverage (EBIT /
                                               2.6    5.0     2.9     3.5      2.8      2.9
                Interest)


July 26, 2010                                                                           12
Idea Cellular | 1Q FY2011Result Update


 Research Team Tel: 022 - 4040 3800                E-mail: research@angeltrade.com                   Website: www.angeltrade.com

 DISCLAIMER

 This document is solely for the personal information of the recipient, and must not be singularly used as the basis of any investment
 decision. Nothing in this document should be construed as investment or financial advice. Each recipient of this document should make
 such investigations as they deem necessary to arrive at an independent evaluation of an investment in the securities of the companies
 referred to in this document (including the merits and risks involved), and should consult their own advisors to determine the merits and
 risks of such an investment.

 Angel Broking Limited, its affiliates, directors, its proprietary trading and investment businesses may, from time to time, make
 investment decisions that are inconsistent with or contradictory to the recommendations expressed herein. The views contained in this
 document are those of the analyst, and the company may or may not subscribe to all the views expressed within.

 Reports based on technical and derivative analysis center on studying charts of a stock's price movement, outstanding positions and
 trading volume, as opposed to focusing on a company's fundamentals and, as such, may not match with a report on a company's
 fundamentals.

 The information in this document has been printed on the basis of publicly available information, internal data and other reliable
 sources believed to be true, but we do not represent that it is accurate or complete and it should not be relied on as such, as this
 document is for general guidance only. Angel Broking Limited or any of its affiliates/ group companies shall not be in any way
 responsible for any loss or damage that may arise to any person from any inadvertent error in the information contained in this report.
 Angel Broking Limited has not independently verified all the information contained within this document. Accordingly, we cannot testify,
 nor make any representation or warranty, express or implied, to the accuracy, contents or data contained within this document. While
 Angel Broking Limited endeavours to update on a reasonable basis the information discussed in this material, there may be regulatory,
 compliance, or other reasons that prevent us from doing so.
 This document is being supplied to you solely for your information, and its contents, information or data may not be reproduced,
 redistributed or passed on, directly or indirectly.

 Angel Broking Limited and its affiliates may seek to provide or have engaged in providing corporate finance, investment banking or
 other advisory services in a merger or specific transaction to the companies referred to in this report, as on the date of this report or in
 the past.

 Neither Angel Broking Limited, nor its directors, employees or affiliates shall be liable for any loss or damage that may arise from or in
 connection with the use of this information.

 Note: Please refer to the important `Stock Holding Disclosure' report on the Angel website (Research Section). Also, please
 refer to the latest update on respective stocks for the disclosure status in respect of those stocks. Angel Broking Limited and
 its affiliates may have investment positions in the stocks recommended in this report.


 Disclosure of Interest Statement                                              Idea Cellular
 1. Analyst ownership of the stock                                                  No
 2. Angel and its Group companies ownership of the stock                            Yes
 3. Angel and its Group companies' Directors ownership of the stock                 No
 4. Broking relationship with company covered                                       No

 Note: We have not considered any Exposure below Rs 1 lakh for Angel, its Group companies and Directors.


 Ratings (Returns) :             Buy (> 15%)                      Accumulate (5% to 15%)                  Neutral (-5 to 5%)
                                 Reduce (-5% to 15%)              Sell (< -15%)


July 26, 2010                                                                                                                              13

Idea Cellular

  • 1.
    1QFY2011 Result Update| Telecom July 26, 2010 Idea Cellular REDUCE CMP Rs68 Performance Highlights Target Price Rs58 Parameter (Rs cr) 1QFY11 4QFY10 %chg (qoq) 1QFY10 %chg (yoy) Investment Period 12 Months Net Revenues 3,654 2,976 22.8 3,348 9.1 EBIDTA Margins (%) 24.3 28.9 (4.6) 27.6 (3.3) Stock Info PAT 201 297 (32.2) 267 (24.5) Sector Telecom Source: Company, Angel Research Market Cap (Rs cr) 22,326 Beta 0.75 Strong top-line performance, however margin erosion continues: For 1QFY2011, 52 Week High / Low 84.9/47.1 Idea Cellular witnessed an impressive broad-based growth of 22.8% yoy (9.1% qoq) in its consolidated top-line, which was ahead of our and consensus estimates. Avg. Daily Volume 1485520 The mobile business revenues grew by 21.4% yoy (10.3% qoq) on account of Face Value (Rs) 10 robust improvement in total Minutes of Usage (MoUs), which were up by 69% yoy BSE Sensex 18,020 (20.5% qoq) to 82,274 minutes. The total subscriber base (including Spice) moved Nifty 5,419 up by 8% qoq to 68.9mn in 1QFY2011. The national long distance (NLD) business Reuters Code IDEA.BO grew by 104.3% yoy (6.1% qoq), while the passive infrastructure business grew by Bloomberg Code IDEA@IN 26.8% yoy (7.8% qoq). At the EBIDTA level, margins witnessed strong erosion of 458bp yoy (327bp qoq) owing to the higher than expected increase in operational Shareholding Pattern (%) costs. However, the tax rate fell from 9.5% in 4QFY2010 to 3.5% in 1QFY2011. Promoters 47.0 Thus, mainly on account of lower operational profitability, bottom-line declined by MF / Banks / Indian Fls 9.6 32.2% yoy (24.5% qoq including one-time other income in 4QFY2010). Excluding one-time income in 4QFY2010, profit was down by 32.2% yoy (6.2% qoq). FII / NRIs / OCBs 40.1 Indian Public / Others 3.3 Outlook and Valuation: We expect Idea to record 22% CAGR in top-line over FY2010-12E, aided by continued strong subscriber additions, value added services revenues and higher revenues from 3G roll outs. However, intense competitive Abs. (%) 3m 1yr 3yr pressures are expected to restrict the bottom-line CAGR to 4.6% over the period. At Sensex 1.5 17.2 14.2 the CMP, the stock is trading at fair valuations of 21.4x FY2012E EPS. Hence, we Idea Cellular 4.0 (15.3) (48.5) recommend a Reduce on the stock, with a Target Price of Rs58, implying a forward P/E of 12x for its core business’s FY2012E EPS of Rs3.2 and Rs20 per share for its 16% stake in Indus Towers. Key Financials (Consolidated) Y/E March (Rs cr) FY2009 FY2010 FY2011E FY2012E Net Sales 10,154 12,447 15,464 18,608 % chg 51.1 22.6 24.2 20.3 Net Profit 882 954 811 1,045 % chg (15.4) 8.2 (15.0) 28.9 FDEPS (Rs) 2.7 2.9 2.5 3.2 EBITDA Margin (%) 27.9 27.4 23.4 23.0 P/E (x) 25.3 23.4 27.5 21.4 P/BV (x) 1.5 1.9 1.8 1.6 RoE (%) 6.4 8.0 6.4 7.6 RoCE (%) 6.4 7.2 5.8 7.4 Vibha Salvi EV/Sales (x) 2.3 2.3 2.0 1.6 022 – 4040 3800 Ext: 329 EV/EBITDA (x) 8.2 8.3 8.4 7.1 vibhas.salvi@angeltrade.com Source: Company, Angel Research Please refer to important disclosures at the end of this report 1
  • 2.
    Idea Cellular |1Q FY2011Result Update Exhibit 1: 1QFY2011 Performance (Consolidated) Y/E March (Rs cr) FY2011 FY2010 % chg FY2010 % chg FY2010 FY2009 % chg 1Q 1Q (yoy) 4Q (qoq) Net revenues 3,654 2,976 22.8 3,348 9.1 12,447 10,154 22.6 Operating expenditure 2,765 2,116 30.7 2,424 14.1 9,040 7,318 23.5 EBITDA 888 860 3.3 923 (3.8) 3,407 2,836 20.1 Other income - - 52 - 84 - - Interest charges (Net) 114 87 31.3 114 0.1 401 495 (19.0) Depreciation & Amortisation 566 456 24.2 567 (0.2) 2,015 1,403 43.6 Income before taxes 209 317 (34.3) 295 (29.2) 1,075 939 14.5 Tax 7 20 28 121 58 111.0 Net income 201 297 (32.2) 267 (24.5) 954 882 8.2 Diluted EPS (Rs) 0.6 1.0 (36.5) 0.9 (28.2) 2.9 2.7 7.4 EBITDA margin (%) 24.3 28.9 27.6 27.4 27.9 22.6 Net profit margin (%) 5.5 10.0 8.0 7.7 8.7 Mobile ARPUs (Rs/user/month) 182 232 (21.6) 185 (1.6) 214 267 (19.8) Source: Company, Angel Research Exhibit 2: 1QFY2011 – Actual v/s Angel estimates (Rs cr) Estimates Actual Variation (%) Net revenue 3,497 3,654 4.5 EBIT margin (%) 26.8 24.3 (2.5) PAT 248 201 (18.9) Source: Company, Angel Research Strong top-line growth aided by higher MoUs and subcriber additions For 1QFY2011, Idea Cellular registered an impressive broad-based growth of 22.8% yoy (9.1% qoq) in consolidated top-line, which was ahead of our and consensus estimates. The mobile business reported revenue growth of 21.4% yoy (10.3% qoq). However, normalised revenue of the segment grew 5.4% qoq taking into consideration the full quarter impact of the revenues from Spice Communications compared to the one-month revenue of the company included in 4QFY2010, as the amalgamation took place with effect from March 1, 2010. The growth in mobile business was driven by robust improvement in the Total Minutes of Usage (MoUs), which surged 69% yoy (20.5% qoq) to 82,274 minutes. The total subscriber base (including Spice) moved up 8% qoq to 68.9mn in 1QFY2011. However, on account of the hyper-competitive market conditions the average realised rate (ARR) during the quarter stood lower by 6.4%, a decline to 44 paise per minute. The NLD business grew by 104.3% yoy (6.1% qoq) during the quarter, while the passive infrastructure business recorded 26.8% yoy (7.8% qoq) growth. July 26, 2010 2
  • 3.
    Idea Cellular |1Q FY2011Result Update Exhibit 3: Total MoUs - Growth trend (Mn minutes) 65,000 55,000 45,000 CQGR 13.7% 35,000 25,000 15,000 5,000 4QFY07 1QFY08 2QFY08 3QFY08 4QFY08 1QFY09 2QFY09 3QFY09 4QFY09 1QFY10 2QFY10 3QFY10 4QFY10 1QFY11 Source: Company, Angel Research High operational costs exert pressure on margins Idea’s consolidated EBIDTA margins witnessed strong erosion of 458bp yoy (327bp qoq) during the quarter. The network operating costs, license charges and roaming and access charges shot up by 258bp, 29bp and 159bp qoq respectively, during the quarter. Idea standalone continued to witness EBIDTA losses in its new service areas for the fourth consecutive quarter. The quantum of loss was however lower at Rs140cr in 1QFY2011 compared to Rs142cr in 4QFY2010. Thus, though the EBIDTA margins of the company’s established circles continued to bleed by 460bp yoy (280bp qoq), the reduction in EBIDTA losses in new areas coupled with continuous sequential improvement in Indus margins restricted further margin erosion during the quarter. Lower operational profitability impacted bottom-line Idea witnessed a slight 0.1% qoq increase in interest cost, which was mainly due to forex fluctuation. However, the company capitalised interest cost of Rs40.4cr against payment for 3G auction fee and thus it did not impact the bottom-line during the quarter. However, depreciation cost increased by 24.2% yoy (down 0.2% qoq), while the tax rate fell from 9.5% in 4QFY2010 to 3.5% in 1QFY2011. During 4QFY2010, Idea had recorded a one-time income of Rs51.9cr due to the write-back of provisioning for the lease rentals with respect to the service areas of Spice. Including this one-time income, bottom-line came in lower by 32.2% yoy (24.5% qoq). Excluding the one-time income, bottom-line fell by 32.2% yoy (6.2% qoq). July 26, 2010 3
  • 4.
    Idea Cellular |1Q FY2011Result Update Exhibit 4: Segment-wise gross revenue break-up 1QFY11 1QFY10 4QFY10 % chg % chg Particulars (Rs cr) yoy qoq Mobility 3,654 3,010 3,312 21.4 10.3 National Long Distance 440 216 415 104.3 6.1 Passive Infra Services 279 220 259 26.8 7.8 Other Operating Income - 1 - Total Gross Revenues 4,373 3,446 3,986 26.9 9.7 Less: Inter-segment eliminations 719 470 638 52.9 12.7 Total 3,654 2,976 3,348 22.8 9.1 Source: Company, Angel Research Exhibit 5: Mobility business – Operating metrics (including Spice) 1QFY11 1QFY10 4QFY10 % chg % chg Particulars (Rs cr) yoy qoq Revenues (Rs cr) 3,654 2,976 3,348 22.8 9.1 Mobile subscriber base (Mn) 68.9 42.8 63.8 61.0 8.0 Mobile ARPUs (Rs/month) 182 232 185 (21.6) (1.6) Total minutes of usage (Mn) 82,274 48,729 68,275 68.8 20.5 Minutes of use/user/month 415 399 398 4.0 4.3 Revenues per minute (Rs) 0.44 0.58 0.47 (24.1) (6.4) EBITDA (Rs cr) 888 860 923 3.3 (3.8) EBITDA Margins (%) 24.3 28.9 27.6 (4.6) (3.3) EBITDA/minute (Rs) 0.11 0.18 0.14 (38.8) (20.2) Source: Company, Angel Research; Note: These metrics are for the 22 service areas including those of Spice Communication July 26, 2010 4
  • 5.
    Idea Cellular |1Q FY2011Result Update Exhibit 6: Revenue, EBITDA and EBITDA margin break-up % chg % chg (Rs cr) 1QFY11 1QFY10 4QFY10 yoy qoq Revenues Established circles - 11 3,383 2,746 3,025 23.2 11.8 Newer circles - 9 306 143 276 114.6 10.9 Idea Standalone - 20 service areas* 3,690 2,888 3,301 27.7 11.8 Proportionate - Spice (2 Circles) - 136 98 (100.0) (100.0) Proportionate - Indus 255 199 234 28.3 9.4 Inter-segment eliminations 291 247 285 17.9 2.1 Idea Consolidated - 20 service areas* 3,654 2,976 3,348 22.8 9.1 EBITDA Established circles - 11 934 835 975 11.9 (4.2) Newer circles - 9 (140) (64) (142) 117.5 (1.5) Idea Standalone - 20 service areas* 794 770 833 3.1 (4.7) Proportionate – Spice (2 Circles) - 29 7 - - Proportionate - Indus 95 61 84 56.5 13.4 Idea Consolidated - 22 service areas* 888 860 923 3.3 (3.8) EBITDA Margins (%) Established circles - 11 27.6 30.4 32.2 (2.8) (4.6) Newer circles - 9 (45.7) (45.1) (51.5) (0.6) 5.8 Idea Standalone - 20 service areas* 21.5 26.7 25.2 (5.2) (3.7) Proportionate – Spice (2 Circles) - 21.6 7.3 (21.6) (7.3) Proportionate - Indus 37.1 30.4 35.8 6.7 1.3 Idea Consolidated - 22 service areas* 24.3 28.9 27.6 (4.6) (3.3) Source: Company, Angel Research; Note: (i) As on 1QFY2011 new service areas include Mumbai, Bihar, Orissa, Tamil Nadu, J&K, Kolkata, W Bengal, Assam and North East; (ii) For 1QFY2011, Idea standalone covers 22 service areas including Punjab and Karnataka circles of Spice, whereas for 1QFY2010 and 4QFY2010 the Idea standalone statistics exclude Spice numbers as the amalgamation was effective from March’10. July 26, 2010 5
  • 6.
    Idea Cellular |1Q FY2011Result Update Investment Arguments Hyper competition looms over the industry; survival of the fittest We believe that the status of Indian telecom sector would continue to remain challenging if the operations continue at lower tariffs to combat hyper-competition - currently on an average there are 10-12 telecom operators per circle in India compared to 4-5 in the developed markets of US and Europe. TRAI is still resolving the 2G related issues, while the MNP is still not implemented. Thus, we believe that consolidation would be the right way ahead for the industry, and the telecom service providers (TSP) with strong market positioning and healthy financials would sustain the blows better than smaller ones, discarding unhealthy competition and promoting steady growth of the sector. Continuous fall in tariffs and 3G funding to erode profitability Though Idea witnessed a 24.1% yoy decline in Revenue per minute (RPM) from 58 paise per minute in 4QFY10 to 44 paise per minute in 1QFY2011, it managed to bring down the cost per minute from 44 paise to 35 paise during the period. If tariffs fall from current levels of 44 paise per minute, it would be difficult for management to sustain below 35 paise cost per minute going forward. Taking this into consideration and with increased opex on account of higher investments on technology and network to remain competitive, higher debt and capex for the 3G roll out resulting in higher interest and depreciation costs would erode the company’s profitability for at least an year. No clarity on 3G roll-out due to regulatory issues We believe that the inflow from 3G roll out would be a reliever to the current pain that the Indian telecom industry is going through. However, the roll out is expected to happen from December’10 onwards with no clarity on the exact date of the roll out. The funds raised for the 3G roll outs would result in higher interest and depreciation costs, which would be charged to the books once the roll out begins. Outlook and Valuation We expect Idea to record 22% CAGR in top-line over FY2010-12E, aided by continued strong subscriber additions, value added services revenues and higher revenues from 3G roll outs. However, intense competitive pressures are expected to restrict bottom-line CAGR to 4.6% over the period. We believe that the competitive landscape would witness some consolidation and stability from FY2012E onwards. At the CMP, the stock is trading at fair valuations of 21.4x FY2012E EPS. Hence, we recommend a Reduce on the stock, with a Target Price of Rs58, implying a forward P/E of 12x for its core business’s FY2012E EPS of Rs3.2 and Rs20 per share for its 16% stake in Indus Towers. July 26, 2010 6
  • 7.
    Idea Cellular |1Q FY2011Result Update Exhibit 7: Key Assumptions Parameter (%) FY2011E FY2012E Subscriber growth 28.5 16.0 Monthly ARPUs (15.0) (2.0) EBIDTA margin 23.4 23.0 Tax rate 10.8 18.0 EPS growth (15.0) 28.9 Source: Company, Angel Research Exhibit 8: Change in estimates FY2011E FY2012E Earlier Revised Earlier Revised Var (%) Var (%) Estimates Estimates Estimates Estimates Net Revenues 14,557 15,464 6.2 16,510 18,608 12.7 EBIDTA 23.2 23.4 0.2 23.7 23.0 (0.7) (margins) Other Income 51 39 (24.1) 66 56 (15.5) PBT 673 909 35.1 991 1,274 28.6 Tax 121 98 (19.0) 178 229 28.6 PAT 551 811 47.0 812 1,045 28.6 Source: Company, Angel Research We have revised upwards our FY2011E and FY2012E top-line estimates, based on the robust 15-20% sequential growth in MoUs being witnessed by the company since the past few quarters on the back of increased subscriber additions and wins in new circles. These, we believe, will drive better than expected growth on top- line. We expect the strong top-line growth to take care of strong erosion in EBIDTA as expected earlier. The lower tax rate in 1QFY2011 would lower the effective tax rate to 11% from earlier expected 18% in FY2011. However, the tax rate for FY2012E is expected to remain at 18%. Thus, we have upgraded our PAT estimates for FY2011E and FY2012E by 47% and 29% respectively and Target Price from Rs50 earlier to Rs58. Exhibit 9: One-year forward P/E band 30000 25x 25000 20x 20000 Share Price (Rs) 15000 15x 10000 10x 5000 0 Jul-05 Jul-06 Jul-07 Jul-08 Jul-09 Jan-06 Jan-07 Jan-08 Jan-09 Jan-10 Apr-05 Apr-06 Apr-07 Apr-08 Apr-09 Apr-10 Oct-05 Oct-06 Oct-07 Oct-08 Oct-09 Source: Company, Angel Research July 26, 2010 7
  • 8.
    Idea Cellular |1Q FY2011Result Update Exhibit 10: Recommendation Summary Company Reco. CMP Tgt Price Upside FY2012E FY2012E FY2010-12E FY2012E FY2012E (Rs) (Rs) (%) P/BV (x) P/E (x) EPS CAGR (%) RoCE (%) RoE (%) Bharti Airtel Accumulate 320 360 12.4 2.1 12.9 1.9 18.6 17.9 Idea Cellular Reduce 68 58 (14.3) 1.6 21.4 4.6 7.4 7.6 RCOM Sell 188 155 (17.6) 0.9 11.0 (10.9) 4.7 8.1 Source: Company, Angel Research July 26, 2010 8
  • 9.
    Idea Cellular |1Q FY2011Result Update Profit & Loss Statement (Consolidated) Y/E March (Rs cr) FY2007 FY2008 FY2009 FY2010 FY2011E FY2012E Gross sales 4,366 6,720 10,154 12,447 15,464 18,608 Less: Excise duty - - - - - - Net Sales 4,366 6,720 10,154 12,447 15,464 18,608 Other operating - - - - - - income Total operating income 4,366 6,720 10,154 12,447 15,464 18,608 % chg 53.9 51.1 22.6 24.2 20.3 Total Expenditure 2,901 4,468 7,318 9,040 11,840 14,321 Cost of Services 1,720 2,866 5,091 6,304 8,407 10,209 SGA 921 1,256 1,703 2,090 2,660 3,256 Personnel 261 346 525 645 773 856 Other - - - - - - EBITDA 1,465 2,252 2,836 3,407 3,624 4,286 % chg 53.7 26.0 20.1 6.4 18.3 (% of Net Sales) 33.6 33.5 27.9 27.4 23.4 23.0 Depreciation& 672 877 1,403 2,015 2,280 2,418 Amortisation EBIT 793 1,375 1,434 1,392 1,344 1,868 % chg 73.3 4.3 (2.9) (3.5) 39.0 (% of Net Sales) 18.2 20.5 14.1 11.2 8.7 10.0 Interest & other 305 278 495 401 474 650 Charges Other Income 21 17 - 84 39 56 (% of PBT) 4.1 1.6 - 7.8 4.3 4.4 Share in profit of - - - - - - Associates Recurring PBT 509 1,115 939 1,075 909 1,274 % chg 118.9 (15.8) 14.5 (15.5) 40.2 Extraordinary - - - - - Expense/(Inc.) PBT (reported) 509 1,115 939 1,075 909 1,274 Tax 7 73 58 121 98 229 (% of PBT) 1.4 6.5 6.1 11.3 10.8 18.0 PAT (reported) 502 1,042 882 954 811 1,045 Add: Share of earnings - - - - - - of associate Less: Minority interest - - - - - - (MI) Prior period items - - - - - - PAT after MI (reported) 502 1,042 882 954 811 1,045 ADJ. PAT 502 1,042 882 954 811 1,045 % chg 107.6 (15.4) 8.2 (15.0) 28.9 (% of Net Sales) 11.5 15.5 8.7 7.7 5.2 5.6 Basic EPS (Rs) 1.9 4.0 2.8 2.9 2.5 3.2 Fully Diluted EPS (Rs) 1.5 3.2 2.7 2.9 2.5 3.2 % chg 0.0 107.6 (15.4) 8.2 (15.0) 28.9 July 26, 2010 9
  • 10.
    Idea Cellular |1Q FY2011Result Update Balance Sheet (Consolidated) Y/E March (Rs cr) FY2007 FY2008 FY2009 FY2010E FY2011E FY2012E SOURCES OF FUNDS Equity Share Capital 2,593 2,635 3,100 3,300 3,300 3,300 Preference Capital - - 2 2 2 2 Reserves& Surplus (413) 909 10,727 8,574 9,385 10,430 Shareholders Funds 2,180 3,545 13,829 11,876 12,687 13,732 Minority Interest - - - - - - Total Loans 4,251 6,515 8,917 7,859 11,197 12,125 Deferred Tax Liability 1 66 92 214 - - Total Liabilities 6,431 10,126 22,837 19,950 23,884 25,857 APPLICATION OF FUNDS Gross Block 7,047 11,014 21,147 27,059 31,457 35,004 Less: Acc. Depreciation 2,631 3,124 5,998 8,891 11,171 13,589 Net Block 4,417 7,890 15,149 18,168 20,286 21,415 Capital Work-in- 507 1,037 1,495 547 547 547 Progress Goodwill (Incl. net 1,192 1,795 2,246 6 6 6 intangibles) Investments 1 - - - - - Current Assets 2,466 2,106 3,403 726 2,514 3,358 Cash 1,820 1,053 5,132 1,420 2,514 3,358 Loans & Advances 400 774 (1,729) - - - Other 246 278 - (695) - - Current liabilities 2,152 2,702 - - - - Net Current Assets 314 (596) 3,403 726 2,514 3,358 Mis. Exp. not written off - - 544 504 531 531 Total Assets 6,431 10,126 22,837 19,950 23,884 25,857 July 26, 2010 10
  • 11.
    Idea Cellular |1Q FY2011Result Update Cash Flow Statement (Consolidated) Y/E March (Rs cr) FY2007 FY2008 FY2009 FY2010E FY2011E FY2012E Profit before tax 509 1,115 939 1,075 909 1,274 Depreciation 672 877 1,403 2,015 2,280 2,418 Change in Working - 222 (413) (695) 695 (120) Capital Less: Other income 21 (327) (444) 84 39 56 Direct taxes paid 7 19 108 121 93 229 Cash Flow from 1,153 2,522 2,264 2,190 3,747 3,287 Operations (Inc)./ Dec in Fixed - (5,558) (6,749) (4,077) (4,398) (3,547) Assets (Inc)./ Dec. in - (512) (3,425) - - - Investments (Inc)./ Dec. in loans - - - 1,115 (1,533) 349 and advances Other income 21 92 151 84 39 56 Cash Flow from 21 (5,977) (10,023) (2,878) (5,892) (3,143) Investing Issue of Equity 319 9,369 200 0 - Inc./(Dec.) in loans 2,265 1,597 (1,057) 3,338 928 Dividend Paid (Incl. - 452 763 121 98 229 Tax) Others - - 146 - - - Cash Flow from - 2,132 10,348 (979) 3,240 699 Financing Inc./(Dec.) in Cash 1,132 (1,323) 2,589 (1,666) 1,094 843 Opening Cash 149 1,820 497 3,086 1,420 2,514 balances Closing Cash 1,820 497 3,086 1,420 2,514 3,358 balances July 26, 2010 11
  • 12.
    Idea Cellular |1Q FY2011Result Update Key Ratios Y/E March FY2007 FY2008 FY2009 FY2010E FY2011E FY2012E Valuation Ratio (x) P/E (on FDEPS) 44.5 21.4 25.3 23.4 27.5 21.4 P/CEPS 14.9 9.3 9.2 7.5 7.2 6.4 P/BV 8.0 5.0 1.5 1.9 1.8 1.6 Dividend yield (%) 0.0 0.0 0.0 0.0 0.0 0.0 EV/Sales 4.5 3.3 2.3 2.3 2.0 1.6 EV/EBITDA 13.3 9.9 8.2 8.3 8.4 7.1 EV / Total Assets 2.3 1.7 1.0 1.5 1.3 1.2 Per Share Data (Rs) EPS (Basic) 1.9 4.0 2.8 2.9 2.5 3.2 EPS (fully diluted) 1.5 3.2 2.7 2.9 2.5 3.2 Cash EPS 4.5 7.3 7.4 9.0 9.4 10.5 DPS 0.0 - - - - - Book Value 8.4 13.5 44.6 36.0 38.4 41.6 Dupont Analysis EBIT margin 18.7 20.7 14.1 11.9 8.9 10.3 Tax retention ratio 98.6 93.5 93.9 88.7 89.2 82.0 Asset turnover (x) 0.6 0.6 0.6 0.7 0.7 0.8 ROIC (Post-tax) 11.9 11.1 7.8 7.3 5.9 7.2 Cost of Debt (Post Tax) 7.1 1.2 1.5 1.1 1.1 1.1 Leverage (x) 1.1 2.8 1.1 0.8 1.2 1.3 Operating ROE 17.3 38.3 14.6 12.3 11.9 15.2 Returns (%) ROCE (Pre-tax) 12.3 13.6 6.4 7.2 5.8 7.4 Angel ROIC (Pre-tax) 20.5 9.9 7.3 6.3 7.7 ROE 23.0 29.4 6.4 8.0 6.4 7.6 Turnover ratios (x) Asset Turnover (Gross 0.6 0.6 0.5 0.5 0.5 0.6 Block) Inventory / Sales (days) 5 5 2 - - - Receivables (days) 127 11 9 10 11 13 Payables (days) 203 144 133 132 108 102 Working capital cycle (125) (128) (122) (121) (97) (89) (ex-cash) (days) Solvency ratios (x) Net debt to equity 1.1 1.5 0.3 0.5 0.7 0.6 Net debt to EBITDA 1.7 2.4 1.3 1.9 2.4 2.0 Interest Coverage (EBIT / 2.6 5.0 2.9 3.5 2.8 2.9 Interest) July 26, 2010 12
  • 13.
    Idea Cellular |1Q FY2011Result Update Research Team Tel: 022 - 4040 3800 E-mail: research@angeltrade.com Website: www.angeltrade.com DISCLAIMER This document is solely for the personal information of the recipient, and must not be singularly used as the basis of any investment decision. Nothing in this document should be construed as investment or financial advice. Each recipient of this document should make such investigations as they deem necessary to arrive at an independent evaluation of an investment in the securities of the companies referred to in this document (including the merits and risks involved), and should consult their own advisors to determine the merits and risks of such an investment. Angel Broking Limited, its affiliates, directors, its proprietary trading and investment businesses may, from time to time, make investment decisions that are inconsistent with or contradictory to the recommendations expressed herein. The views contained in this document are those of the analyst, and the company may or may not subscribe to all the views expressed within. Reports based on technical and derivative analysis center on studying charts of a stock's price movement, outstanding positions and trading volume, as opposed to focusing on a company's fundamentals and, as such, may not match with a report on a company's fundamentals. The information in this document has been printed on the basis of publicly available information, internal data and other reliable sources believed to be true, but we do not represent that it is accurate or complete and it should not be relied on as such, as this document is for general guidance only. Angel Broking Limited or any of its affiliates/ group companies shall not be in any way responsible for any loss or damage that may arise to any person from any inadvertent error in the information contained in this report. Angel Broking Limited has not independently verified all the information contained within this document. Accordingly, we cannot testify, nor make any representation or warranty, express or implied, to the accuracy, contents or data contained within this document. While Angel Broking Limited endeavours to update on a reasonable basis the information discussed in this material, there may be regulatory, compliance, or other reasons that prevent us from doing so. This document is being supplied to you solely for your information, and its contents, information or data may not be reproduced, redistributed or passed on, directly or indirectly. Angel Broking Limited and its affiliates may seek to provide or have engaged in providing corporate finance, investment banking or other advisory services in a merger or specific transaction to the companies referred to in this report, as on the date of this report or in the past. Neither Angel Broking Limited, nor its directors, employees or affiliates shall be liable for any loss or damage that may arise from or in connection with the use of this information. Note: Please refer to the important `Stock Holding Disclosure' report on the Angel website (Research Section). Also, please refer to the latest update on respective stocks for the disclosure status in respect of those stocks. Angel Broking Limited and its affiliates may have investment positions in the stocks recommended in this report. Disclosure of Interest Statement Idea Cellular 1. Analyst ownership of the stock No 2. Angel and its Group companies ownership of the stock Yes 3. Angel and its Group companies' Directors ownership of the stock No 4. Broking relationship with company covered No Note: We have not considered any Exposure below Rs 1 lakh for Angel, its Group companies and Directors. Ratings (Returns) : Buy (> 15%) Accumulate (5% to 15%) Neutral (-5 to 5%) Reduce (-5% to 15%) Sell (< -15%) July 26, 2010 13