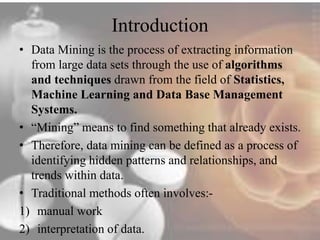
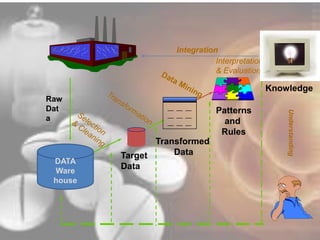
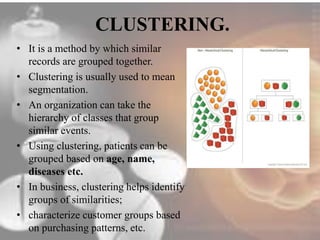
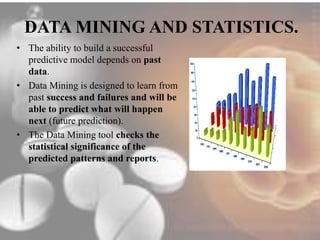
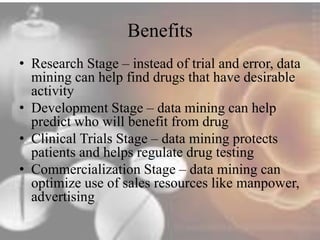
This lecture gives various definitions of Data Mining. It also gives why Data Mining is required. Various examples on Classification , Cluster and Association rules are given.
Applying Data Science and Analytics in MarketingData Con LA
Data Con LA 2020
Description
The importance of leveraging data science and analytics to analyze and measure the effectiveness of marketing campaigns to maximize profitability and better optimization on Return of Investment (ROI) in the era of 4th industrial revolution. Marketing campaign optimization involves the application data analysis and machine learning algorithms to build solutions and models that provides valuable insights that increases efficiencies and simplifies KPI metrics monitoring and tracking. Core benefits of applying data science and analytics in marketing includes; mitigating risk of wasteful investment, Increasing ROI, increasing operation efficiencies by monitoring KPI metrics from a centralized platform, identifying and forecasting future trends and patterns.
*Introduction to Marketing Mix Channels, marketing campaigns implementation and the application of data science and analytics across all channels to increase efficiency.
*Data collection from disparate marketing data sources, software and databases.
*Building holistic 360 view of analytics marketing solutions from consumer's interaction with marketing campaigns to engagement on the website towards goal consideration to customer acquisition.
*Data Analytics solutions and models development workflow and use cases of data science in marketing. (Attribution model, predictive model and marketing mix model).
*Data-driven Marketing optimization strategies (A/b testing, customer segmentation and personalized messages/retargeting)
Speaker
Tochukwu Matthias, Molina Healthcare, Data & Analytics Manager
Big Data Analytics for Smart Health CareEshan Bhuiyan
Healthcare big data refers to the vast quantities of data that is now available to healthcare providers.
As a response to the digitization of healthcare information and the rise of value-based care, the industry has taken advantage of big data and analytics to make strategic business decisions.
Automate your literature monitoring for more effective pharmacovigilanceAnn-Marie Roche
Embase and QUOSA experts take you through a complete literature management workflow, demonstrating how Elsevier’s Pharmacovigilance solution enables efficient and comprehensive post-market surveillance.
Reconciliation and Literature Review and Signal Detection_Katalyst HLSKatalyst HLS
Introduction Reconciliation and Literature Review and Signal Detection in Drug Safety & Pharmacovigilance in Pharmaceuticals, Bio-Pharmaceuticals, Medical Devices, Cosmeceuticals and Foods.
Contact:
"Katalyst Healthcares & Life Sciences"
South Plainfield, NJ, USA
info@KatalystHLS.com
This is the agenda and brochure for Pharma IQ's upcoming Regulatory Information Management conference on the 2nd and 3rd of March in London.
This conference is the only event of its kind to focus solely on the management of information within pharmaceutical companies, to aid regulatory submissions. The event will bring together leading professionals to focus on the regulatory aspects of data and information management.
Data Mining, KDD Process, Data mining functionalities, Characterization,
Discrimination ,
Association,
Classification,
Prediction,
Clustering,
Outlier analysis, Data Cleaning as a Process
The purpose of this presentation is to describe step by step the transition of a SAS Programmer into a Clinical Statistical Programmer. It can be used as guidelines for SAS Programmers who wants to put their programming and technical expertise into industries.
A SAS Programmer is someone who uses SAS software for different scenarios. The person who uses it for different purposes is known as a SAS Programmer.
On the other hand, a Clinical Statistical Programmer performs all the procedures to generate future outputs and makes advanced and real-world developments to face further challenges. A primary role of Clinical Statistical Programmers is to use their technical and programming skills in order to enable clinical trial statisticians to perform their statistical analysis duties more efficiently.
This presentation will briefly discuss about the smooth transition that a SAS Programmer needs to go through in order to become a Clinical Statistical Programmer.
Data Mining: What is Data Mining?
History
How data mining works?
Data Mining Techniques.
Data Mining Process.
(The Cross-Industry Standard Process)
Data Mining: Applications.
Advantages and Disadvantages of Data Mining.
Conclusion.
Data Mining in Healthcare: How Health Systems Can Improve Quality and Reduce...Health Catalyst
This is the complete 4-part series demonstrating real-world examples of the power of data mining in healthcare. Effective data mining requires a three-system approach: the analytics system (including an EDW), the content system (and systematically applying evidence-based best practices to care delivery), and the deployment system (driving change management throughout the organization and implementing a dedicated team structure). Here, we also show organizations with successful data-mining-application in critical areas such as: tracking fee-for-service and value-based payer contracts, population health management initiatives involving primary care reporting, and reducing hospital readmissions. Having the data and tools to use data mining and predict trends is giving these health systems a big advantage.
By leveraging Big Data, the healthcare industry has an incredible potential to improve lives. This session will give examples of how data volume, velocity and variety is transforming the “art” of a doctor to the science of care. It will describe how the use of machine learning and massive amount of data will drive the new Consumer Drive healthcare movement.
Big Data and its Impact on Industry (Example of the Pharmaceutical Industry)Hellmuth Broda
While we bemoan the ever increasing data tsunami new technologies allow to harvest the gold nuggets in the hay stack.
Using the example of the Pharmaceutical Industry some of the possible business uses for Big Data Analitics are outlined.
The report contains the following four chapters:
Chapter 1: Global Pharmaceutical Market
Chapter 2: Solutions to Challenges
Chapter 3: Global Players
Chapter 4: Overview of Industry Trends
You may follow my blog: biostrategyanalytics.wordpress.com for further posts related to financial and strategic issues in the Pharmaceutical / Biotechnology sector.
For any questions or recommendations do not hesitate to contact me.
A comparison predictive and adaptive approach - Main differences - When to apply an agile approach? - When a predictive one? - A comparison between PMP® and PMI-ACP® - How to choose between them?
HealthCare Data Mining and Natural Language ProcessingNehal (Neil) Shah
ezDI is a clinical search engine based on Artificial Intelligence (AI) enveloped with Clinical Natural Language Processing (NLP). It is specially designed for mining clinical data, and running relevant queries. This technology enables high-end data analysis and analytics very quickly and accurately.
ezDI’s clinical natural language processing (NLP) engine turns text into facts and codes using patented technology.
Endless Possibilities – we unwrap your clinical data and find the metrics you seek!
Follow our presentation to learn about the role of statistical analysis in fraud detection. From data mining to clustering, learn the techniques necessary to quickly anticipate and detect health care fraud, waste, and abuse.
Analytical Wizards' Claims Data Navigator for Patient Journey and MoreEric Levin
AW uses state-of-the art big data technologies, expert analytical methodologies, and deep healthcare industry expertise to mine massive claims databases to derive targeted insights for Patient Journey Analysis, Physician Targeting, Outcome Prediction, and more.
Combining Patient Records, Genomic Data and Environmental Data to Enable Tran...Perficient, Inc.
The average academic research organization (ARO) and hospital has many systems that house patient-related information, such as patient records and genomic data. Combining data from a variety of sources in an ongoing manner can enable complex and meaningful querying, reporting and analysis for the purposes of improving patient safety and care, boosting operational efficiency, and supporting personalized medicine initiatives.
In this webinar, Perficient’s Mike Grossman, a director of clinical data warehousing and analytics, and Martin Sizemore, a healthcare strategist, discussed:
-How AROs and hospitals can benefit from a systematic approach to combining data from diverse systems and utilizing a suite of data extraction, reporting, and analytical tools, in order to support a wide variety of needs and requests
-Examples of proposed solutions to real-life challenges AROs and hospitals often encounter
Sharing and standards christopher hart - clinical innovation and partnering...Christopher Hart
Acknowledging the increasing need for cooperation and collaboration in data sharing and access. Describing the complexity that this can bring. Then describing some of the ways to simplify that.
Originally presented at Terrapin's Clinical innovation and partnering world March 8-9 2017.
http://www.terrapinn.com/conference/innovation-and-partnering/index.stm
GDG Cloud Southlake #33: Boule & Rebala: Effective AppSec in SDLC using Deplo...James Anderson
Effective Application Security in Software Delivery lifecycle using Deployment Firewall and DBOM
The modern software delivery process (or the CI/CD process) includes many tools, distributed teams, open-source code, and cloud platforms. Constant focus on speed to release software to market, along with the traditional slow and manual security checks has caused gaps in continuous security as an important piece in the software supply chain. Today organizations feel more susceptible to external and internal cyber threats due to the vast attack surface in their applications supply chain and the lack of end-to-end governance and risk management.
The software team must secure its software delivery process to avoid vulnerability and security breaches. This needs to be achieved with existing tool chains and without extensive rework of the delivery processes. This talk will present strategies and techniques for providing visibility into the true risk of the existing vulnerabilities, preventing the introduction of security issues in the software, resolving vulnerabilities in production environments quickly, and capturing the deployment bill of materials (DBOM).
Speakers:
Bob Boule
Robert Boule is a technology enthusiast with PASSION for technology and making things work along with a knack for helping others understand how things work. He comes with around 20 years of solution engineering experience in application security, software continuous delivery, and SaaS platforms. He is known for his dynamic presentations in CI/CD and application security integrated in software delivery lifecycle.
Gopinath Rebala
Gopinath Rebala is the CTO of OpsMx, where he has overall responsibility for the machine learning and data processing architectures for Secure Software Delivery. Gopi also has a strong connection with our customers, leading design and architecture for strategic implementations. Gopi is a frequent speaker and well-known leader in continuous delivery and integrating security into software delivery.
GraphRAG is All You need? LLM & Knowledge GraphGuy Korland
Guy Korland, CEO and Co-founder of FalkorDB, will review two articles on the integration of language models with knowledge graphs.
1. Unifying Large Language Models and Knowledge Graphs: A Roadmap.
https://arxiv.org/abs/2306.08302
2. Microsoft Research's GraphRAG paper and a review paper on various uses of knowledge graphs:
https://www.microsoft.com/en-us/research/blog/graphrag-unlocking-llm-discovery-on-narrative-private-data/
Software Delivery At the Speed of AI: Inflectra Invests In AI-Powered QualityInflectra
In this insightful webinar, Inflectra explores how artificial intelligence (AI) is transforming software development and testing. Discover how AI-powered tools are revolutionizing every stage of the software development lifecycle (SDLC), from design and prototyping to testing, deployment, and monitoring.
Learn about:
• The Future of Testing: How AI is shifting testing towards verification, analysis, and higher-level skills, while reducing repetitive tasks.
• Test Automation: How AI-powered test case generation, optimization, and self-healing tests are making testing more efficient and effective.
• Visual Testing: Explore the emerging capabilities of AI in visual testing and how it's set to revolutionize UI verification.
• Inflectra's AI Solutions: See demonstrations of Inflectra's cutting-edge AI tools like the ChatGPT plugin and Azure Open AI platform, designed to streamline your testing process.
Whether you're a developer, tester, or QA professional, this webinar will give you valuable insights into how AI is shaping the future of software delivery.
Kubernetes & AI - Beauty and the Beast !?! @KCD Istanbul 2024Tobias Schneck
As AI technology is pushing into IT I was wondering myself, as an “infrastructure container kubernetes guy”, how get this fancy AI technology get managed from an infrastructure operational view? Is it possible to apply our lovely cloud native principals as well? What benefit’s both technologies could bring to each other?
Let me take this questions and provide you a short journey through existing deployment models and use cases for AI software. On practical examples, we discuss what cloud/on-premise strategy we may need for applying it to our own infrastructure to get it to work from an enterprise perspective. I want to give an overview about infrastructure requirements and technologies, what could be beneficial or limiting your AI use cases in an enterprise environment. An interactive Demo will give you some insides, what approaches I got already working for real.
Accelerate your Kubernetes clusters with Varnish CachingThijs Feryn
A presentation about the usage and availability of Varnish on Kubernetes. This talk explores the capabilities of Varnish caching and shows how to use the Varnish Helm chart to deploy it to Kubernetes.
This presentation was delivered at K8SUG Singapore. See https://feryn.eu/presentations/accelerate-your-kubernetes-clusters-with-varnish-caching-k8sug-singapore-28-2024 for more details.
UiPath Test Automation using UiPath Test Suite series, part 4DianaGray10
Welcome to UiPath Test Automation using UiPath Test Suite series part 4. In this session, we will cover Test Manager overview along with SAP heatmap.
The UiPath Test Manager overview with SAP heatmap webinar offers a concise yet comprehensive exploration of the role of a Test Manager within SAP environments, coupled with the utilization of heatmaps for effective testing strategies.
Participants will gain insights into the responsibilities, challenges, and best practices associated with test management in SAP projects. Additionally, the webinar delves into the significance of heatmaps as a visual aid for identifying testing priorities, areas of risk, and resource allocation within SAP landscapes. Through this session, attendees can expect to enhance their understanding of test management principles while learning practical approaches to optimize testing processes in SAP environments using heatmap visualization techniques
What will you get from this session?
1. Insights into SAP testing best practices
2. Heatmap utilization for testing
3. Optimization of testing processes
4. Demo
Topics covered:
Execution from the test manager
Orchestrator execution result
Defect reporting
SAP heatmap example with demo
Speaker:
Deepak Rai, Automation Practice Lead, Boundaryless Group and UiPath MVP
UiPath Test Automation using UiPath Test Suite series, part 3DianaGray10
Welcome to UiPath Test Automation using UiPath Test Suite series part 3. In this session, we will cover desktop automation along with UI automation.
Topics covered:
UI automation Introduction,
UI automation Sample
Desktop automation flow
Pradeep Chinnala, Senior Consultant Automation Developer @WonderBotz and UiPath MVP
Deepak Rai, Automation Practice Lead, Boundaryless Group and UiPath MVP
State of ICS and IoT Cyber Threat Landscape Report 2024 previewPrayukth K V
The IoT and OT threat landscape report has been prepared by the Threat Research Team at Sectrio using data from Sectrio, cyber threat intelligence farming facilities spread across over 85 cities around the world. In addition, Sectrio also runs AI-based advanced threat and payload engagement facilities that serve as sinks to attract and engage sophisticated threat actors, and newer malware including new variants and latent threats that are at an earlier stage of development.
The latest edition of the OT/ICS and IoT security Threat Landscape Report 2024 also covers:
State of global ICS asset and network exposure
Sectoral targets and attacks as well as the cost of ransom
Global APT activity, AI usage, actor and tactic profiles, and implications
Rise in volumes of AI-powered cyberattacks
Major cyber events in 2024
Malware and malicious payload trends
Cyberattack types and targets
Vulnerability exploit attempts on CVEs
Attacks on counties – USA
Expansion of bot farms – how, where, and why
In-depth analysis of the cyber threat landscape across North America, South America, Europe, APAC, and the Middle East
Why are attacks on smart factories rising?
Cyber risk predictions
Axis of attacks – Europe
Systemic attacks in the Middle East
Download the full report from here:
https://sectrio.com/resources/ot-threat-landscape-reports/sectrio-releases-ot-ics-and-iot-security-threat-landscape-report-2024/
Key Trends Shaping the Future of Infrastructure.pdfCheryl Hung
Keynote at DIGIT West Expo, Glasgow on 29 May 2024.
Cheryl Hung, ochery.com
Sr Director, Infrastructure Ecosystem, Arm.
The key trends across hardware, cloud and open-source; exploring how these areas are likely to mature and develop over the short and long-term, and then considering how organisations can position themselves to adapt and thrive.
LF Energy Webinar: Electrical Grid Modelling and Simulation Through PowSyBl -...DanBrown980551
Do you want to learn how to model and simulate an electrical network from scratch in under an hour?
Then welcome to this PowSyBl workshop, hosted by Rte, the French Transmission System Operator (TSO)!
During the webinar, you will discover the PowSyBl ecosystem as well as handle and study an electrical network through an interactive Python notebook.
PowSyBl is an open source project hosted by LF Energy, which offers a comprehensive set of features for electrical grid modelling and simulation. Among other advanced features, PowSyBl provides:
- A fully editable and extendable library for grid component modelling;
- Visualization tools to display your network;
- Grid simulation tools, such as power flows, security analyses (with or without remedial actions) and sensitivity analyses;
The framework is mostly written in Java, with a Python binding so that Python developers can access PowSyBl functionalities as well.
What you will learn during the webinar:
- For beginners: discover PowSyBl's functionalities through a quick general presentation and the notebook, without needing any expert coding skills;
- For advanced developers: master the skills to efficiently apply PowSyBl functionalities to your real-world scenarios.
2. Introduction
• Data Mining is the process of extracting information
from large data sets through the use of algorithms
and techniques drawn from the field of Statistics,
Machine Learning and Data Base Management
Systems.
• “Mining” means to find something that already exists.
• Therefore, data mining can be defined as a process of
identifying hidden patterns and relationships, and
trends within data.
• Traditional methods often involves:-
1) manual work
2) interpretation of data.
3. • Data Mining, popularly called as knowledge
discovery in
• large data
• Enables organizations to make calculated
decisions by
• Assembling
• accumulating
• analyzing and
• accessing corporate data.
4. __
__
__
__
__
__
__
__
__
Transformed
Data
Patterns
and
Rules
Target
Data
Interpretation
& Evaluation
Knowledge
Understanding
Raw
Dat
a
DATA
Ware
house
Integration
5. • The scope of pharmaceutical applications is large and it
may involve drug manufacturing processes as well as
data processing.
• Data processing and analysis is a key area in the
pharmaceutical industry.
• The vision of a pharmaceutical industry that can be
achieved with data mining.
• pharmaceutical companies delivers drugs, developing
test kits (including genetic tests) and computer
programs to deliver the best drug to the patient.
6.
7. Pharmaceutical companies can also employ data mining
methods to huge masses of genomic data to predict how
a patient’s genetic makeup determines his or her response
to a drug therapy .
genomic data :-The complete set of chromosomal and
extra chromosomal genes of an organism, a cell, an
organelle or a virus; the complete DNA component of an
organism.
10. Decision Support System (DSS) tools.
• Decision support
systems (DSS) are
defined as
• interactive computer-based
systems intended
to help decision makers
to utilize data and
models in order to
• identify problems, solve
problems and make
decisions.
11. DATA MINING TECHNIQUES.
•Many organizations generate
mountains of data about their new
drugs discovered and its
performance reports, etc.
•This data is a strategic resource.
Now, making use of most of these
strategic resources will lead to
•improving the quality of pharma
industries.
12. • Six important steps in the Data Mining process
as
1. Problem Definition.
2. Knowledge acquisition.
3. Data selection.
4. Data Preprocessing.
5. Analysis and Interpretation.
6. Reporting and Use.
13. Identify the data mining process as
1. Definition of the objectives of the analysis.
2. Selection &Pretreatment of the data.
4. Explanatory analysis.
5. Specification of the statistical methods.
6. Analysis of the data.
7. Evaluation and comparison of methods.
8. Interpretation of the chosen model.
14. 1. Definition of the objectives of the analysis.
Understanding the project objectives and
requirements from a business perspective and then
converting this knowledge into a data mining
problem definition with a preliminary plan
designed to achieve the objectives.
15. Relevant data sources for the pharma industry are:
•clinical data (patient data, pharmaceutical data,
medical treatments, length of stay);
•administrative data (staff skills, overtime, nursing
care hours, staff sick leave);
• financial data (treatment costs, drug costs, staff
salaries, accounting, cost-effectiveness studies); and
• organizational data (room occupation, facilities,
equipment).
16. Data mining is used to support:
•The clinicians at the point of care delivery;
•The controlling of clinical treatment pathways;
•The administrative and management tasks; and
•Efficient management of organizational and
financial data.
17. Associations, Mining Frequent
Patterns.
• These methods identify rules of affinities
among the collections.
• rules of affinities:- relationships among
data
• That the patterns occur frequently during
Data Mining process.
• The applications of association rules
include market basket analysis
• attached mailing in direct marketing
• Fraud detection
• department store floor/shelf planning etc.
18. •Association of training undertaken diseases
with drugs
•Association and analysis of staff movements
•Application tracking mechanism in
physicians adopting drugs with customer’s
prescription
19. Classification And Prediction.
• The classification and
prediction models are two
data analysis techniques
that are used to describe
data classes and predict
future data classes.
• E.g. A credit card company
whose customer credit
history is known can
classify its customer Record
as
• Good, Medium, or Poor.
20. •Predicting consumer behavior
•Predicting the likelihood of success in a drug
adoption process
•Predicting the percentage accuracy in performance of
a drug
•Classifying the historical health records
•Prediction of what type of drugs most likely to be
retained, most likely to be left, most likely to
transform their composition.
21. Predicting pharma product behavior and attitude
•Predicting demand projections by seasonal variations
•Predicting the performance progress of segments
throughout the performance period
•Identifying the best profile for different drugs
•Classify trends of movements through the
organization for successful/unsuccessful patient
historical records
•Categorization of drugs, diseases and patients.
22. • The models of decision
trees, neural networks
based classifications
schemes are very much
useful in pharma industry.
23. • Decision trees:- Decision-tree is a common knowledge
representation used for classification.
• In classification, one is given data from a specific
instance, and the decision tree predicts, based on the
data, into which of two or more classes the instance
belongs.
• Each instance contains data from multiple attributes.
• Instances are collections of previously acquired data
which are sorted into class labels.
• It does so by determining which tests best divide the
instances into separate classes, forming a tree.
24.
25. • Neural Networks
– Learn through training
– Resemble to biological
networks in structure
– Can produce very good
predictions
– Not easy to use and to
understand
– Cannot deal with
missing data
26. Uses Bayesian neural network
Prior probability is probability that any report
contains reference to adverse event
Posterior probability is probability that report has
link between drug and adverse event
Determines “strength” of link between adverse
event and drug (called Information Component or
IC)
More complicated than appears: patient may
consume multiple drugs – which one caused
adverse event?
28. • Classification works on discrete and unordered data, while prediction
works on continuous data.
• E.g. Discrete data This data set shows a group of discrete data.
Music format Number sold
CD albums 140
CD singles 70
Downloads 55
Vinyl 5
Total sales 270
• This is called discrete data because the units of measurement (for example,
CDs) cannot be split up; there is nothing between 1 CD and 2 CDs
• E.g. Continues data
• This data is called continuous because the scale of measurement - distance -
has meaning at all points between the numbers given, e.g we can travel a
distance of 1.2 and 1.85 and even 1.632 miles.
Distance in miles 0.1 0.2 0.6 1.1 1.2 1.8 2.0 2.7 3.4 4.6 6.2 8.0 12.1 14.2
29. • Regression is often used as it is a
statistical method used for numeric
prediction.
• Primary emphasis should be made on
the selection measurement accuracy
and predicative efficiency of any
new drug discovery.
• Simple or multiple regressions is
the basic prediction model that
enables a decision maker to forecast
each criterion status based on
predictor information.
• neural network technology is useful
from different areas of business.
30. CLUSTERING.
• It is a method by which similar
records are grouped together.
• Clustering is usually used to mean
segmentation.
• An organization can take the
hierarchy of classes that group
similar events.
• Using clustering, patients can be
grouped based on age, name,
diseases etc.
• In business, clustering helps identify
groups of similarities;
• characterize customer groups based
on purchasing patterns, etc.
31. DATA MINING AND STATISTICS.
• The ability to build a successful
predictive model depends on past
data.
• Data Mining is designed to learn from
past success and failures and will be
able to predict what will happen
next (future prediction).
• The Data Mining tool checks the
statistical significance of the
predicted patterns and reports.
32. The difference between Data Mining
and statistics
• Data Mining automates the statistical process
requiring in several tools.
• Statistical inference is assumption driven in the
sense that a hypothesis is formed and tested
against data.
• Data Mining, in contrast is discovery driven.
That is, the hypothesis is automatically
extracted from the given data.
33. Data Mining can answer analytical
questions such as:
• what are discovery of new molecules and
issues over it?
• What factors or combinations are directly
impacting the drugs?
• What are the best and outstanding drugs?
• Which drugs are likely to be retained?
• How to optimally allocate resources to ensure
effectiveness and efficiency? etc.
34. • An intelligent text mining system could
provide a platform for extracting and
managing specific information at the entity
level.
• For e.g. Information pertaining to
• genes
• proteins
• diseases
• organisms
• chemical substance etc can be analytically
extracted for patterns .
35. It would also provide insights into inter relationships
such as
• protein-protein
• Gene-gene
• Protein-Chemical
• Gene-Disease and
• Drug-Drug interactions.
• Text mining can be applied to biomedical literature,
clinical documents and other medical literary sources
for data curation and database population in a semi-automated
manner.
36. Applications Of Data Mining In
The Pharmaceutical Industry
• A lot of information is hidden in the legacy
systems.
• This information can easily be extracted.
• Most of the times this can not be done directly
from the legacy systems, because these are not
build to answer questions that are
unpredictable.
37. • A user-interface may be designed to accept all kinds
of information from the user (e.g. weight, sex, age,
foods consumed, reactions reported, dosage, length of
usage).
• Then, based upon the information in the databases
and the relevant data entered by the user,
• a list of warnings or known reactions (accompanied
by probabilities) should be reported.
• Note that user profiles can contain large amounts of
information, and efficient and effective data mining
tools need to be developed to probe the databases for
relevant information.
38. • Secondly, the patient's (anonymous) profile should
be recorded along with any adverse reactions
reported by the patient, so that future correlations
can be reported.
• Over time, the databases will become much larger,
and interaction data for existing medicines will
become more complete.
• The amount of existing pharmaceutical information
pharmacological properties, dosages,
contraindications, warnings, etc. is enormous;
• however, this fact reflects the number of medicines
on the market, rather than an abundance of detailed
information about each product.
39. One of the major problems with pharmaceutical
data is a lack of information.
• a food and drug administration department
estimated that
• only about 1% of serious events are reported to
the food and drug administration department.
Fear of litigation may be a contributing factor;
• however, most health care providers simply
don't have the time to fill out reports of
possible adverse drug reactions.
40. •Furthermore, it is expensive and time consuming
for pharmaceutical companies to perform a
thorough job of data collection, especially when
most of the information is not required by law.
•Finally, one should note that the food and drug
administration department does not require
manufacturers to test new medicines for potential
interactions.
41. Three stages of drug development
• Finding of new drugs
• Development tests and Predicts drug behavior
• Clinical trials test the drug in humans and
• Commercialization takes drug and sells it to
likely Consumers (doctors and patients).
43. 1) Clinical data analysis – clinical data analysis
evaluates and streamlines from large amount of
information.
Data mining helps to see trends, irregularity, and
risk during product development and launch.
2) Marketing and sales analysis –the
identification of the most profitable product and
allocation of marketing funds.
Data mining here helps to examine consumer
behavior in terms of prescription renewal and
product purchases.
44. 3) Customer analysis – using data mining one can
develop more targeted customer profiles that focus
not only on products, but also on the ability to pay
for them by analyzing historical health trends in
combination with demographics.
4) Target physicians who have high prescription
rates of a certain drug or treatment with new drug
information that treat complementary symptoms or
conditions.
45. DEVELOPMENT OF NEW
DRUGS.
• This can be achieved by clustering the
molecules into groups according to the
chemical properties of the molecules via
cluster analysis.
• every time a new molecule is discovered it can
be grouped with other chemically similar
molecules.
46. •Mining can help us to measure the chemical activity
of the molecule on specific disease say tuberculosis
and find out which part of the molecule is causing the
action.
•This way we can combine a vast number of
molecules forming a super molecule with only the
specific part of the molecule which is responsible for
the action and inhibiting the other parts.
•This would greatly reduce the adverse effects
associated with drug actions.
47. • They use high speed screening to test tens,
hundreds, or thousands of drugs very quickly.
• The general goal is to find activity on
relevant genes or to find drug compounds that
have desirable characteristics.
• The Data mining techniques that are used in
developing of new drugs are clustering,
classification and neural networks.
• The basic objective is to determine
compounds with similar activity.
48. • The reason is for similar activity compounds
behave similarly.
• This is possible only when we have known
compound and looking for something better.
• When we don’t have known compounds but
have desired activity and want to find
compound that exhibits this activity, then data
mining rescues this.
49. DEVELOPMENT TESTS AND
PREDICTS DRUG BEHAVIOR
• Issues which affect the success of a drug which
can impact the future development of the drug.
1) Adverse reactions to the drugs are reported
spontaneously and not in any organized manner.
2) we can only compare the adverse reactions with
the drugs of our own company and not with other
drugs from competing firms.
3) we only have information on the patient taking
the drug not the adverse reaction that the patient
is suffering from
50. Solution
• All this can be solved with creation of a data
warehouse for drug reactions and running
business intelligence tools on them.
• BI tool:- Business intelligence tools are a type of
software that is designed to retrieve, analyze and
report data.
• This broad definition includes everything from
spreadsheets, visual analytics, and querying
software to data mining, warehousing, and
decision engineering.
51.
52. •The drug undergoes testing in animals and human
tissue to observe effect and determines how much
drug to consume for desired effect or how
dangerous is the drug.
•The Data mining techniques can be here used is
classification and neural networks.
53. • The goal here is to predict if treatment will aid
patients.
• Because if drug will not aid patients, what
purpose does drug serve.
• Predicting the drug behavior is essential when we
have data supporting use of drug and also have
training data that shows effects of drug (positive
or negative).
• The test should be able to predict which patients
will benefit and which treatment help sickle cell
anemia patients.
54. How it works
•The information like gender, body weight,
disease state, etc will play crucial role.
•This crucial data should be fed into neural
network and predict whether patient will
benefit from drug.
•Only one of two classifications yes/no will
be available on training data.
•Network is trained for the yes
classifications and a snapshot is taken of the
neural network.
•Then network is trained for the no
classifications and another snapshot is
taken.
•The output is yes or no, depending on
whether the inputs are more similar to the
yes or the no training data.
•E.G. ARTMAP.
55. Weight
Height
Gender
Blood
Pressure
Imagine array of
weights, one for
each “template”
Template closest
to input chosen.
Patient
Benefits?
Path of “least resistance”
chosen for output.
56. CLINICAL TRIALS TEST THE
DRUG IN HUMANS
• Company tests drugs in actual patients on larger
scale.
• company has to keep track of data about patient
progress.
• The Government wants to protect health of
citizens, many rules govern clinical trials.
• In developed countries food and drug
administration oversees trials.
• The Data mining techniques used here can be
neural networks.
57. • Here data is collected by pharmaceutical
company but undergoes statistical analysis to
determine success of trial.
• Data is generally reported to food and drug
administration department and inspected
closely.
• Too many negative reactions might indicate
drug is too dangerous.
• An adverse event might be medicine causing
drowsiness.
58. • The goal is to detect when too many adverse
events occur or detect link between drug and
adverse event.
• Too many adverse events linked to a drug might
indicate drug is too dangerous or health of patient
is at risk.
• Adverse events are reported to food and drug
administration when link is suspected.
• One can feed the information on drug causing too
many adverse events pertaining to drugs into a
neural network and let network lead us to what is
meant by ‘too many’.
59. Benefits
• Research Stage – instead of trial and error, data
mining can help find drugs that have desirable
activity
• Development Stage – data mining can help
predict who will benefit from drug
• Clinical Trials Stage – data mining protects
patients and helps regulate drug testing
• Commercialization Stage – data mining can
optimize use of sales resources like manpower,
advertising
60. CONCLUSION.
• Due to increased computerization and consumer/patient
awareness.
• Reporting (via the internet) by health care workers can easily
be facilitated.
• Data collection in hospitals and extended care facilities is not
difficult, and this information is of high quality since such
institutions typically have tailored diets for their patients, and
maintain accurate records of treatments, lab tests, and
administration of prescriptions.
• Furthermore, given the popularity of the internet, it is
relatively easy for consumers to voluntarily fill in and submit
detailed profiles of themselves.
61. •It is mostly observed that data mining techniques are
seldom used in a pharmaceutical environment.
•How data mining can help find drugs that have desirable
activity and predict who will benefit from drug.
•Data mining protects patients and helps regulate drug
testing and optimizes use of sales resources like
manpower, advertising.