Downloaded 362 times
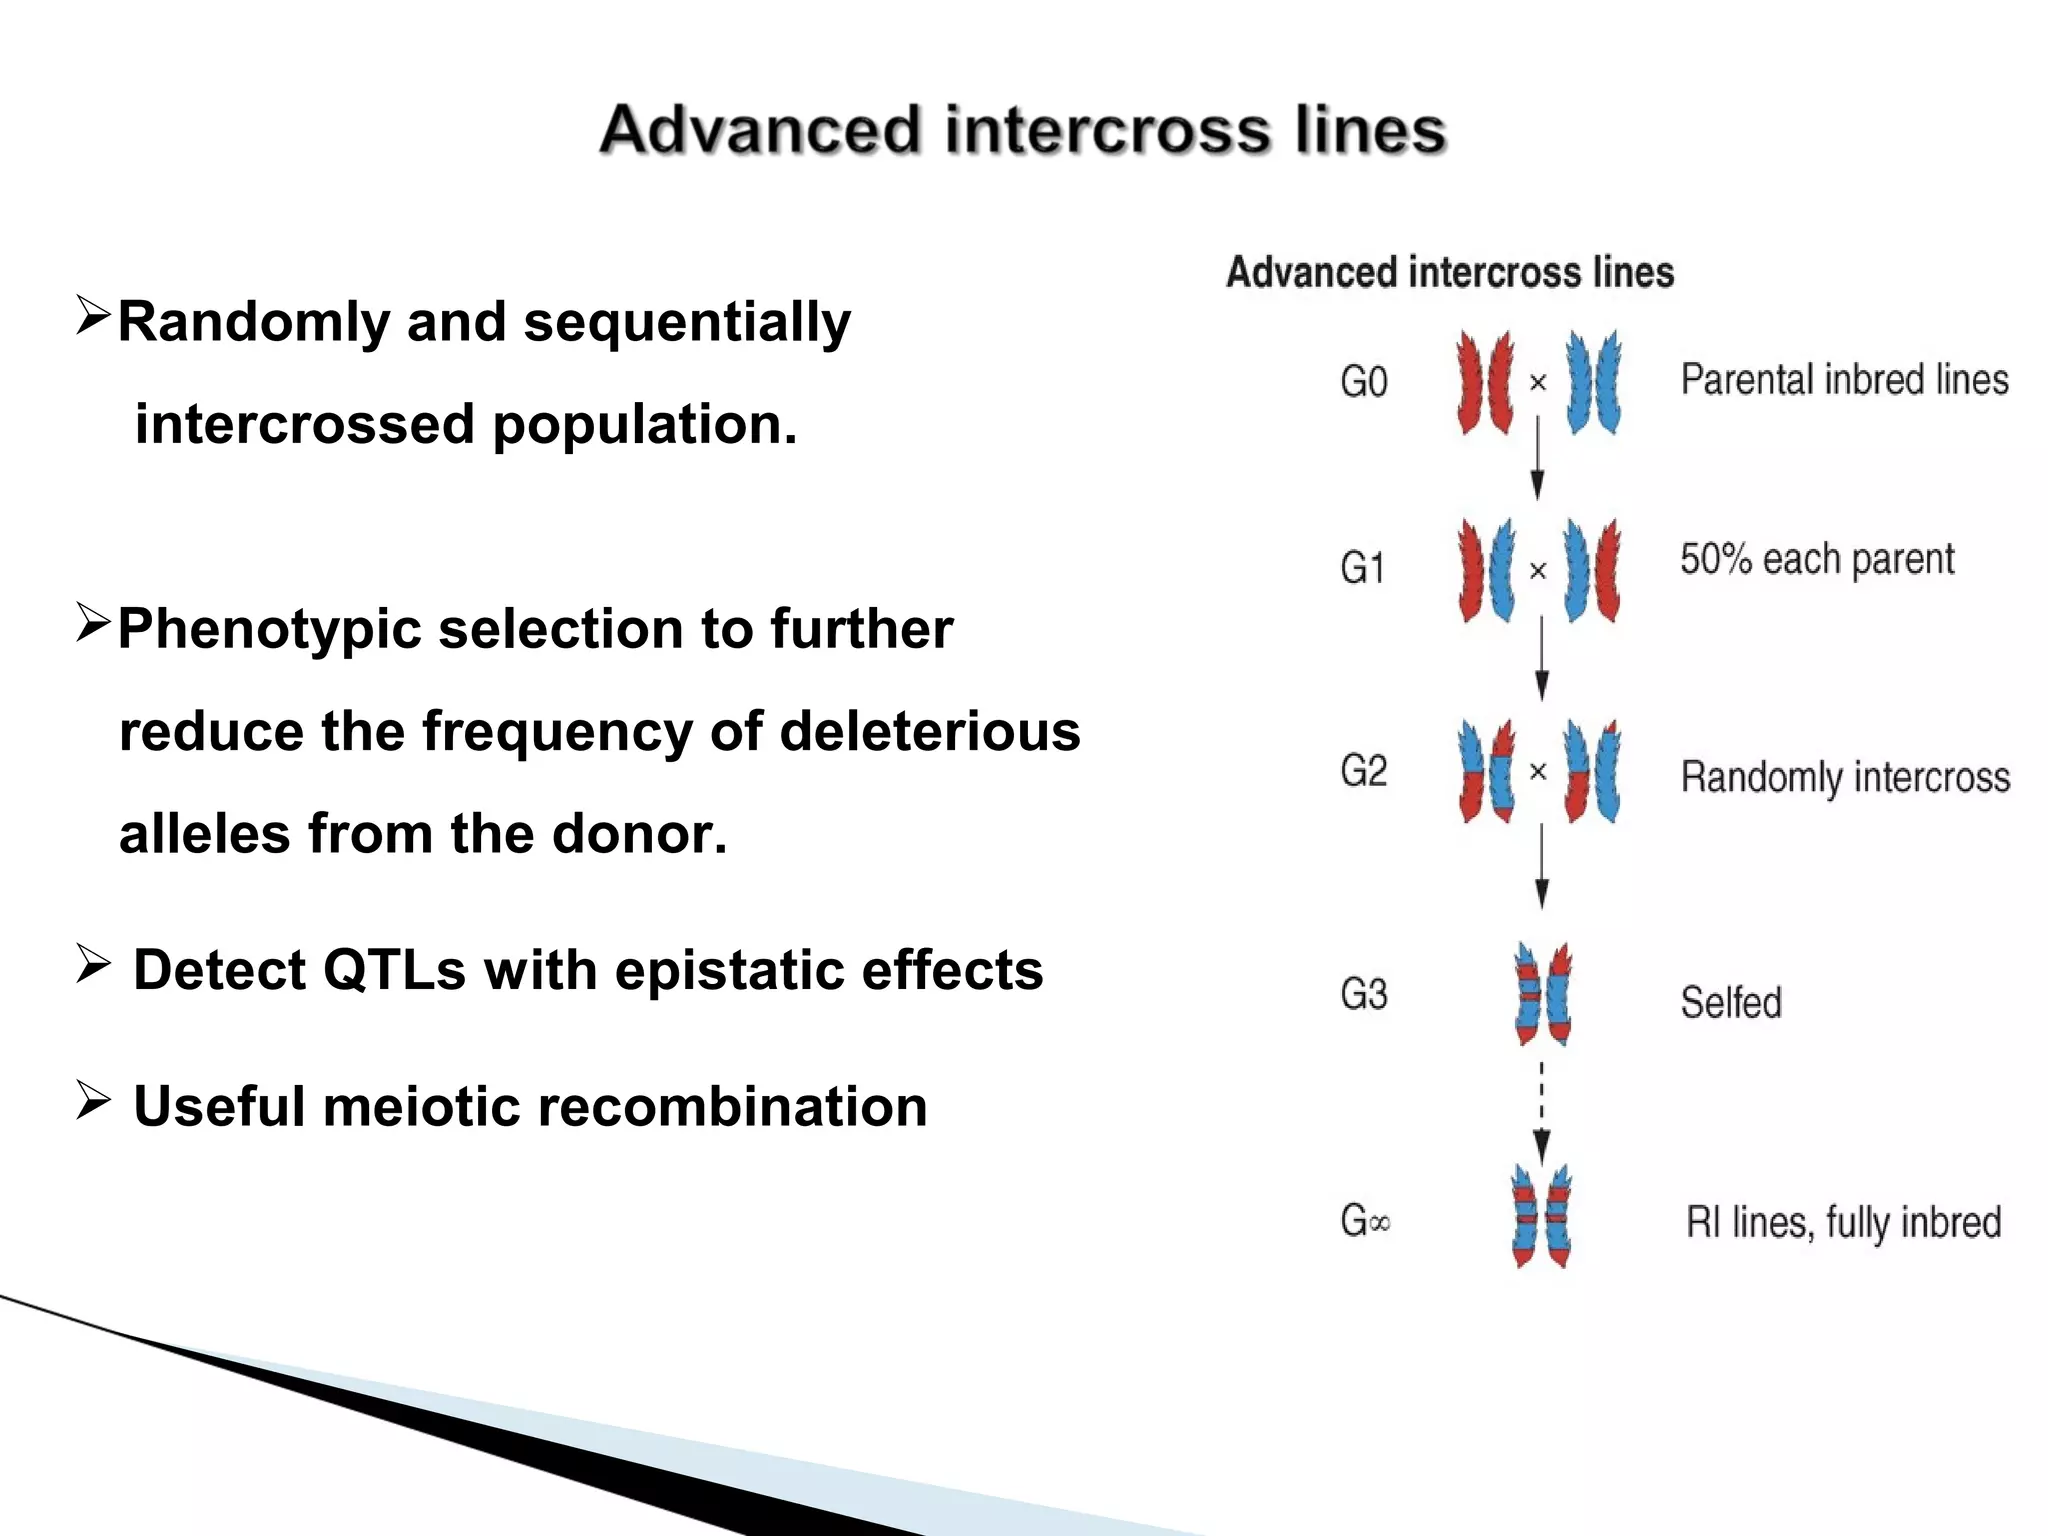
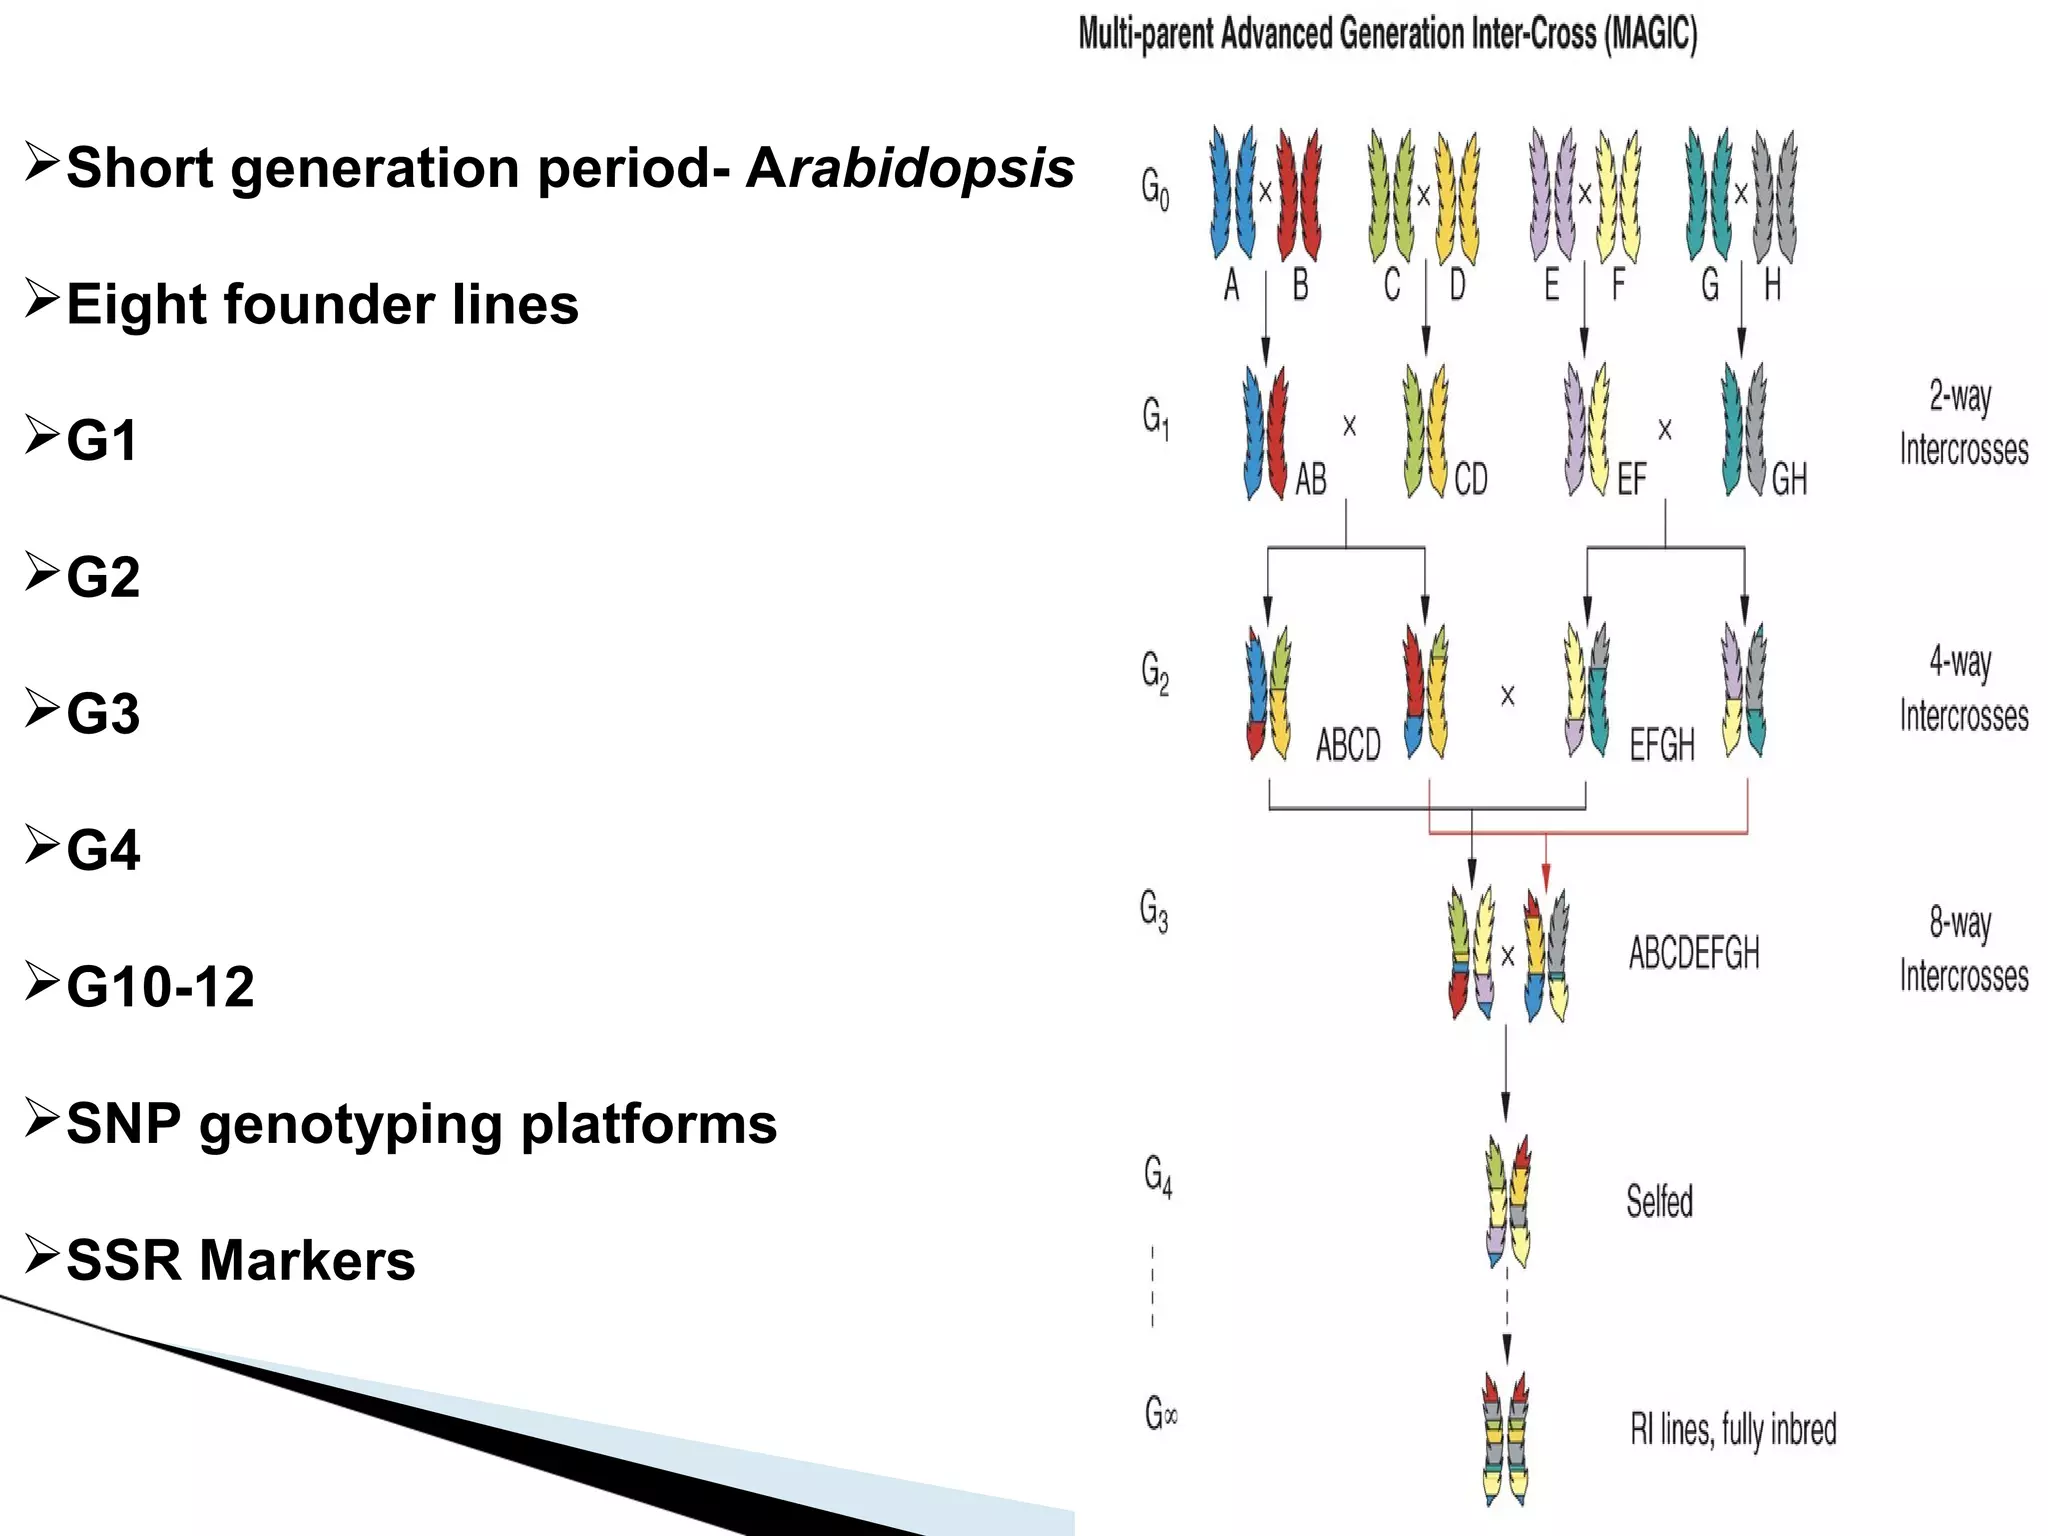
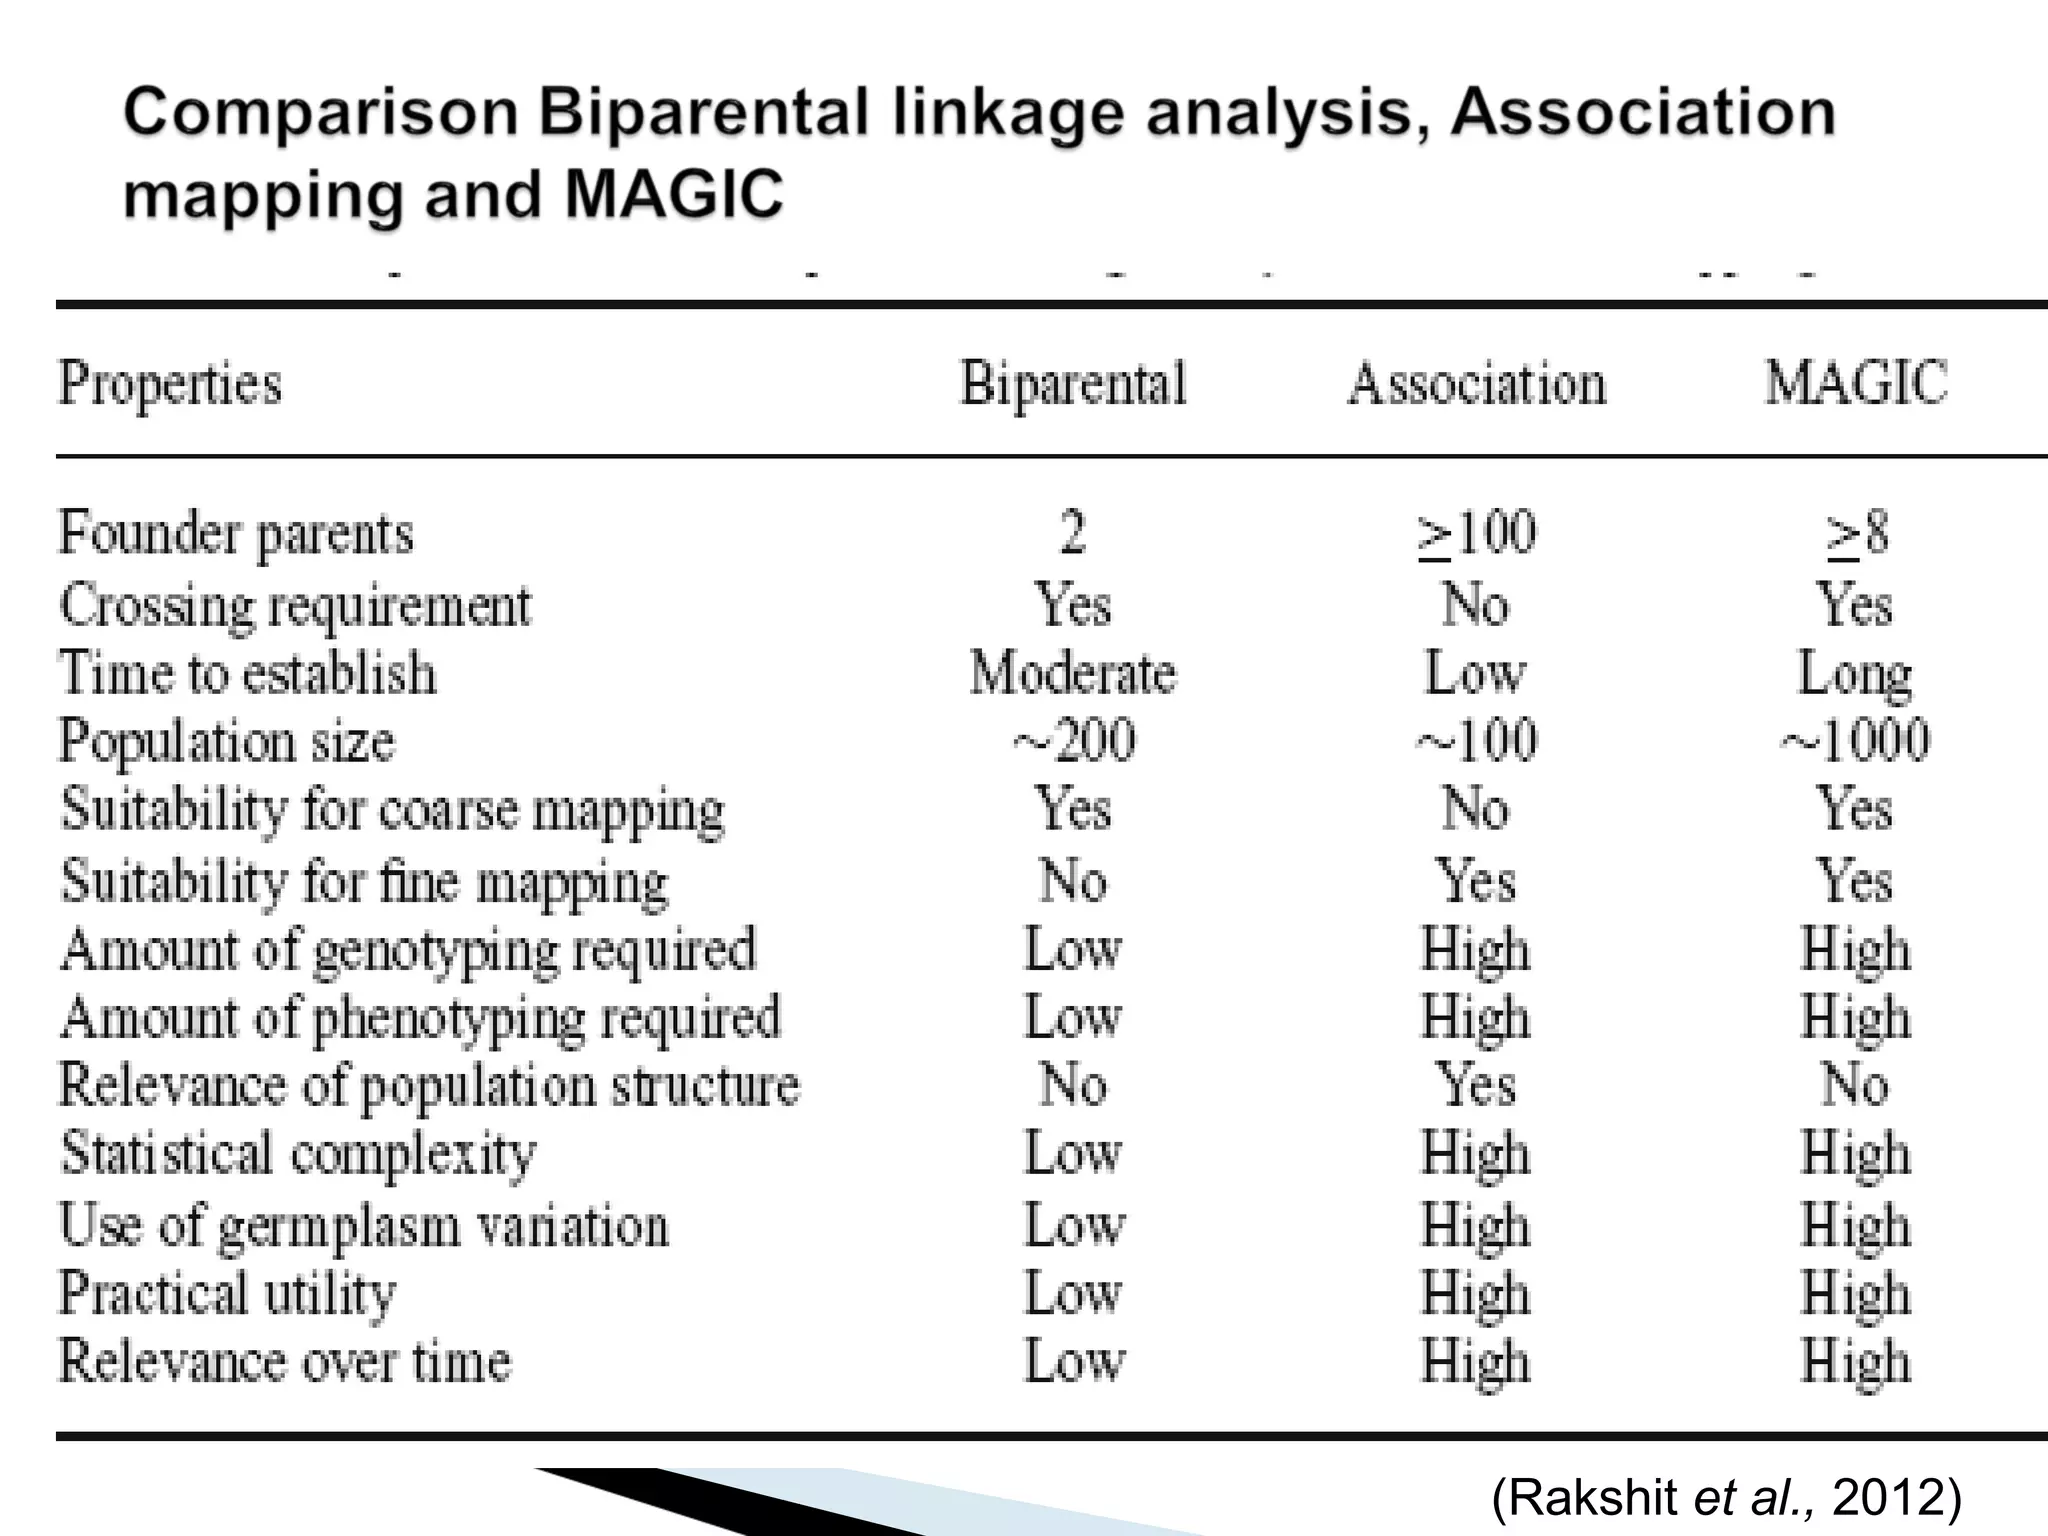

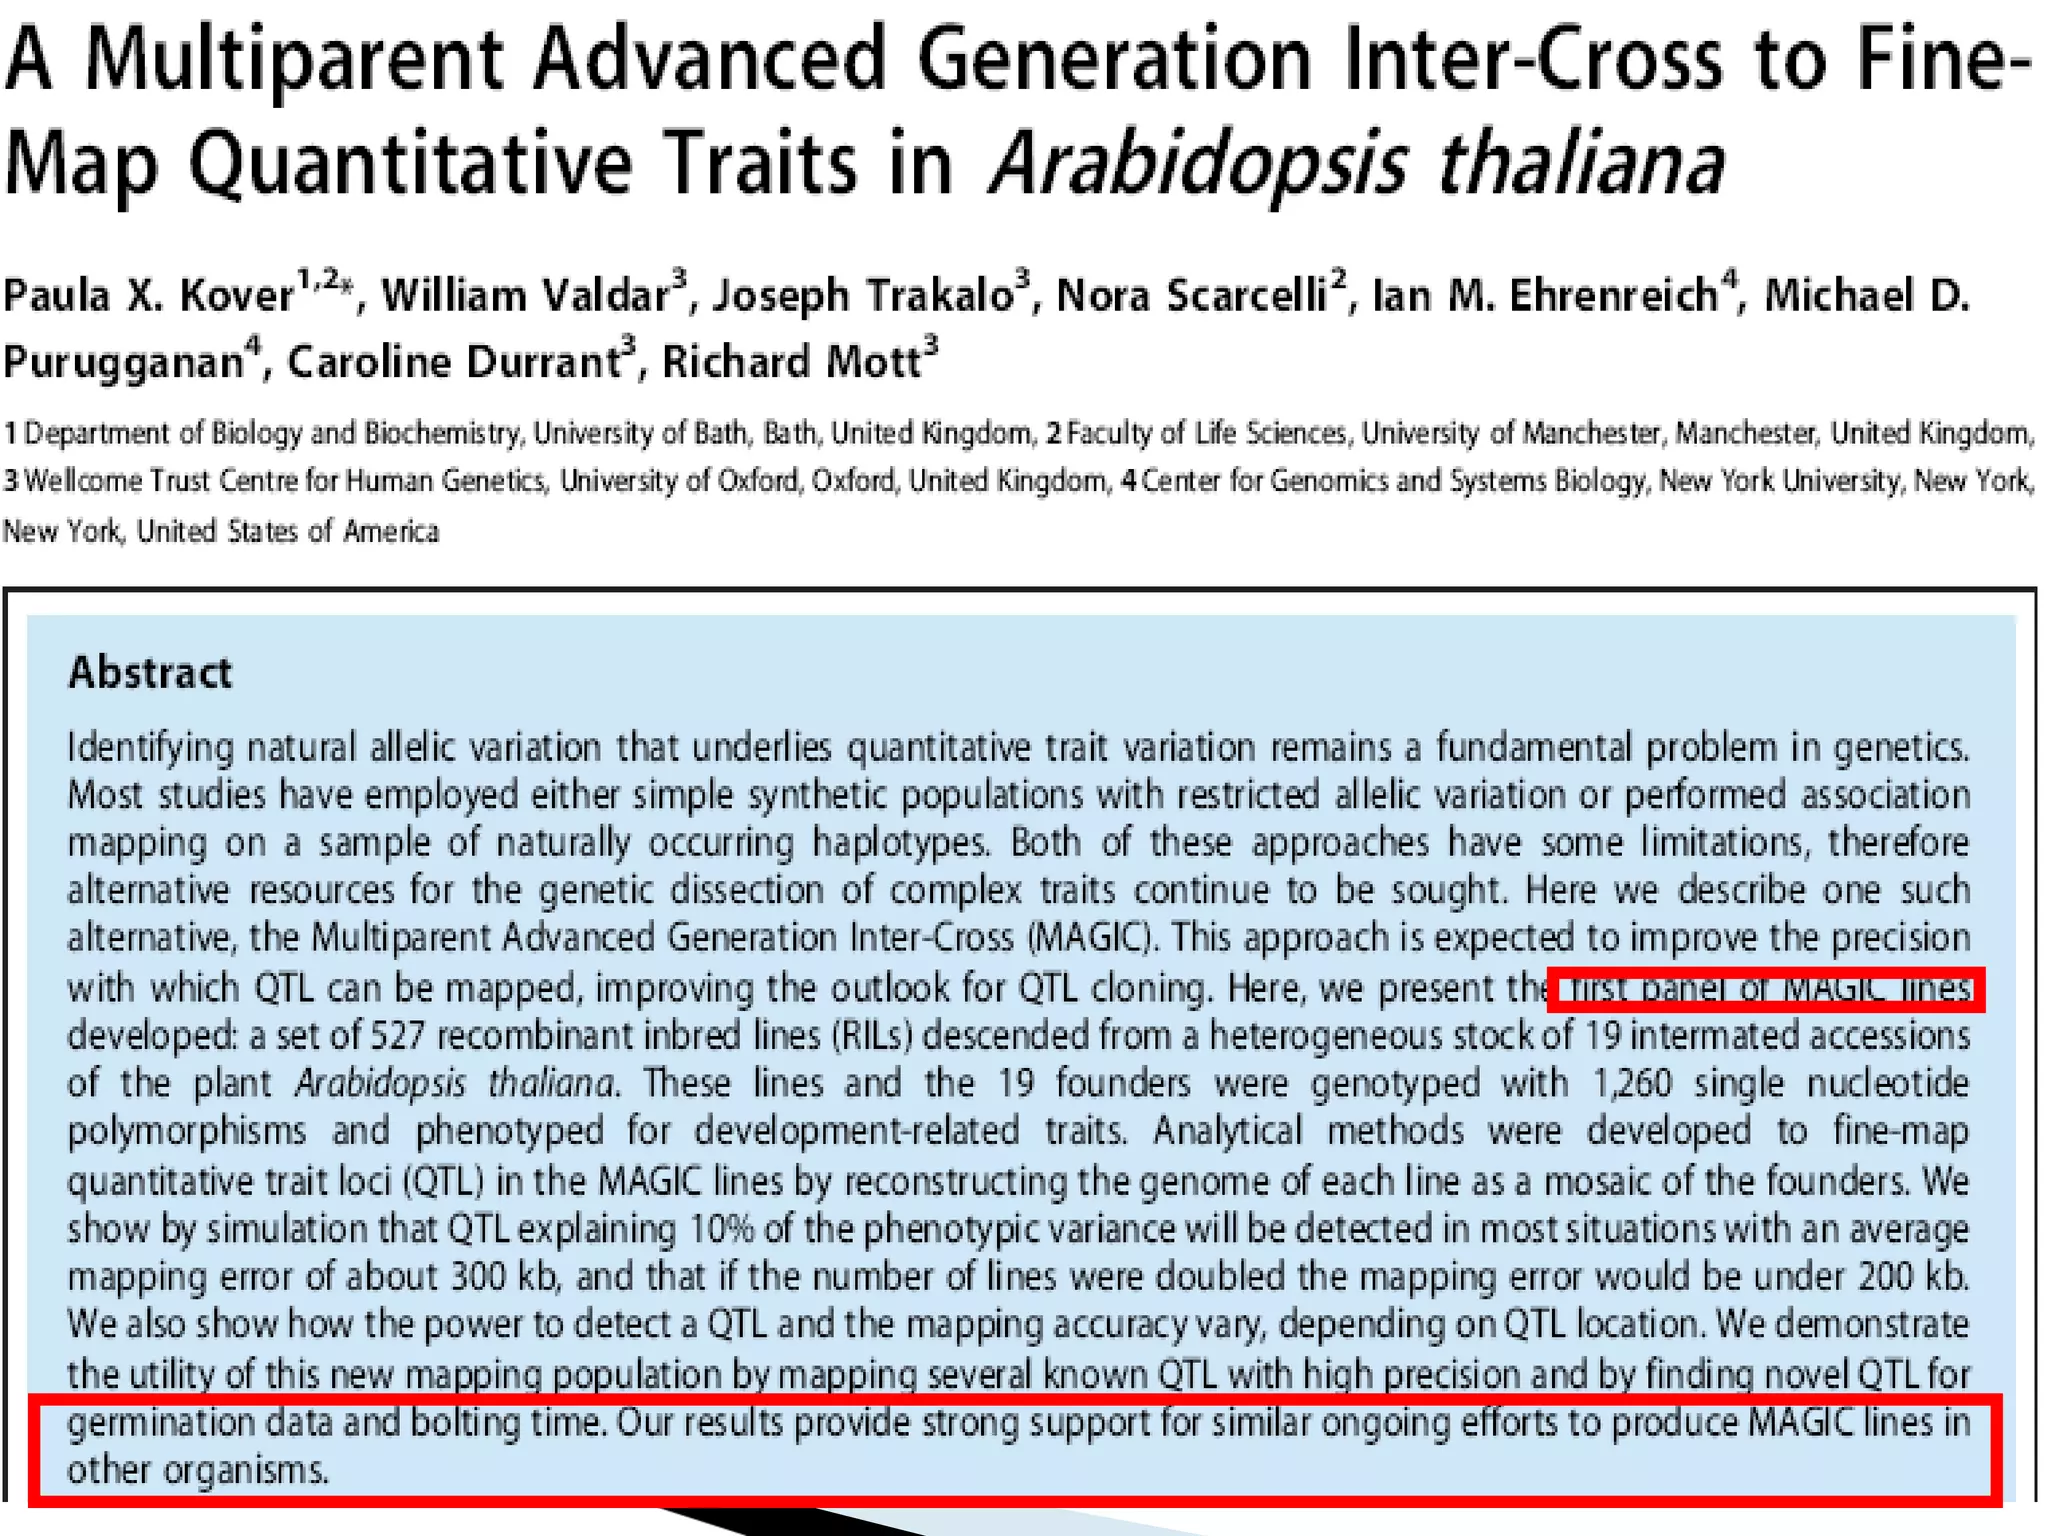
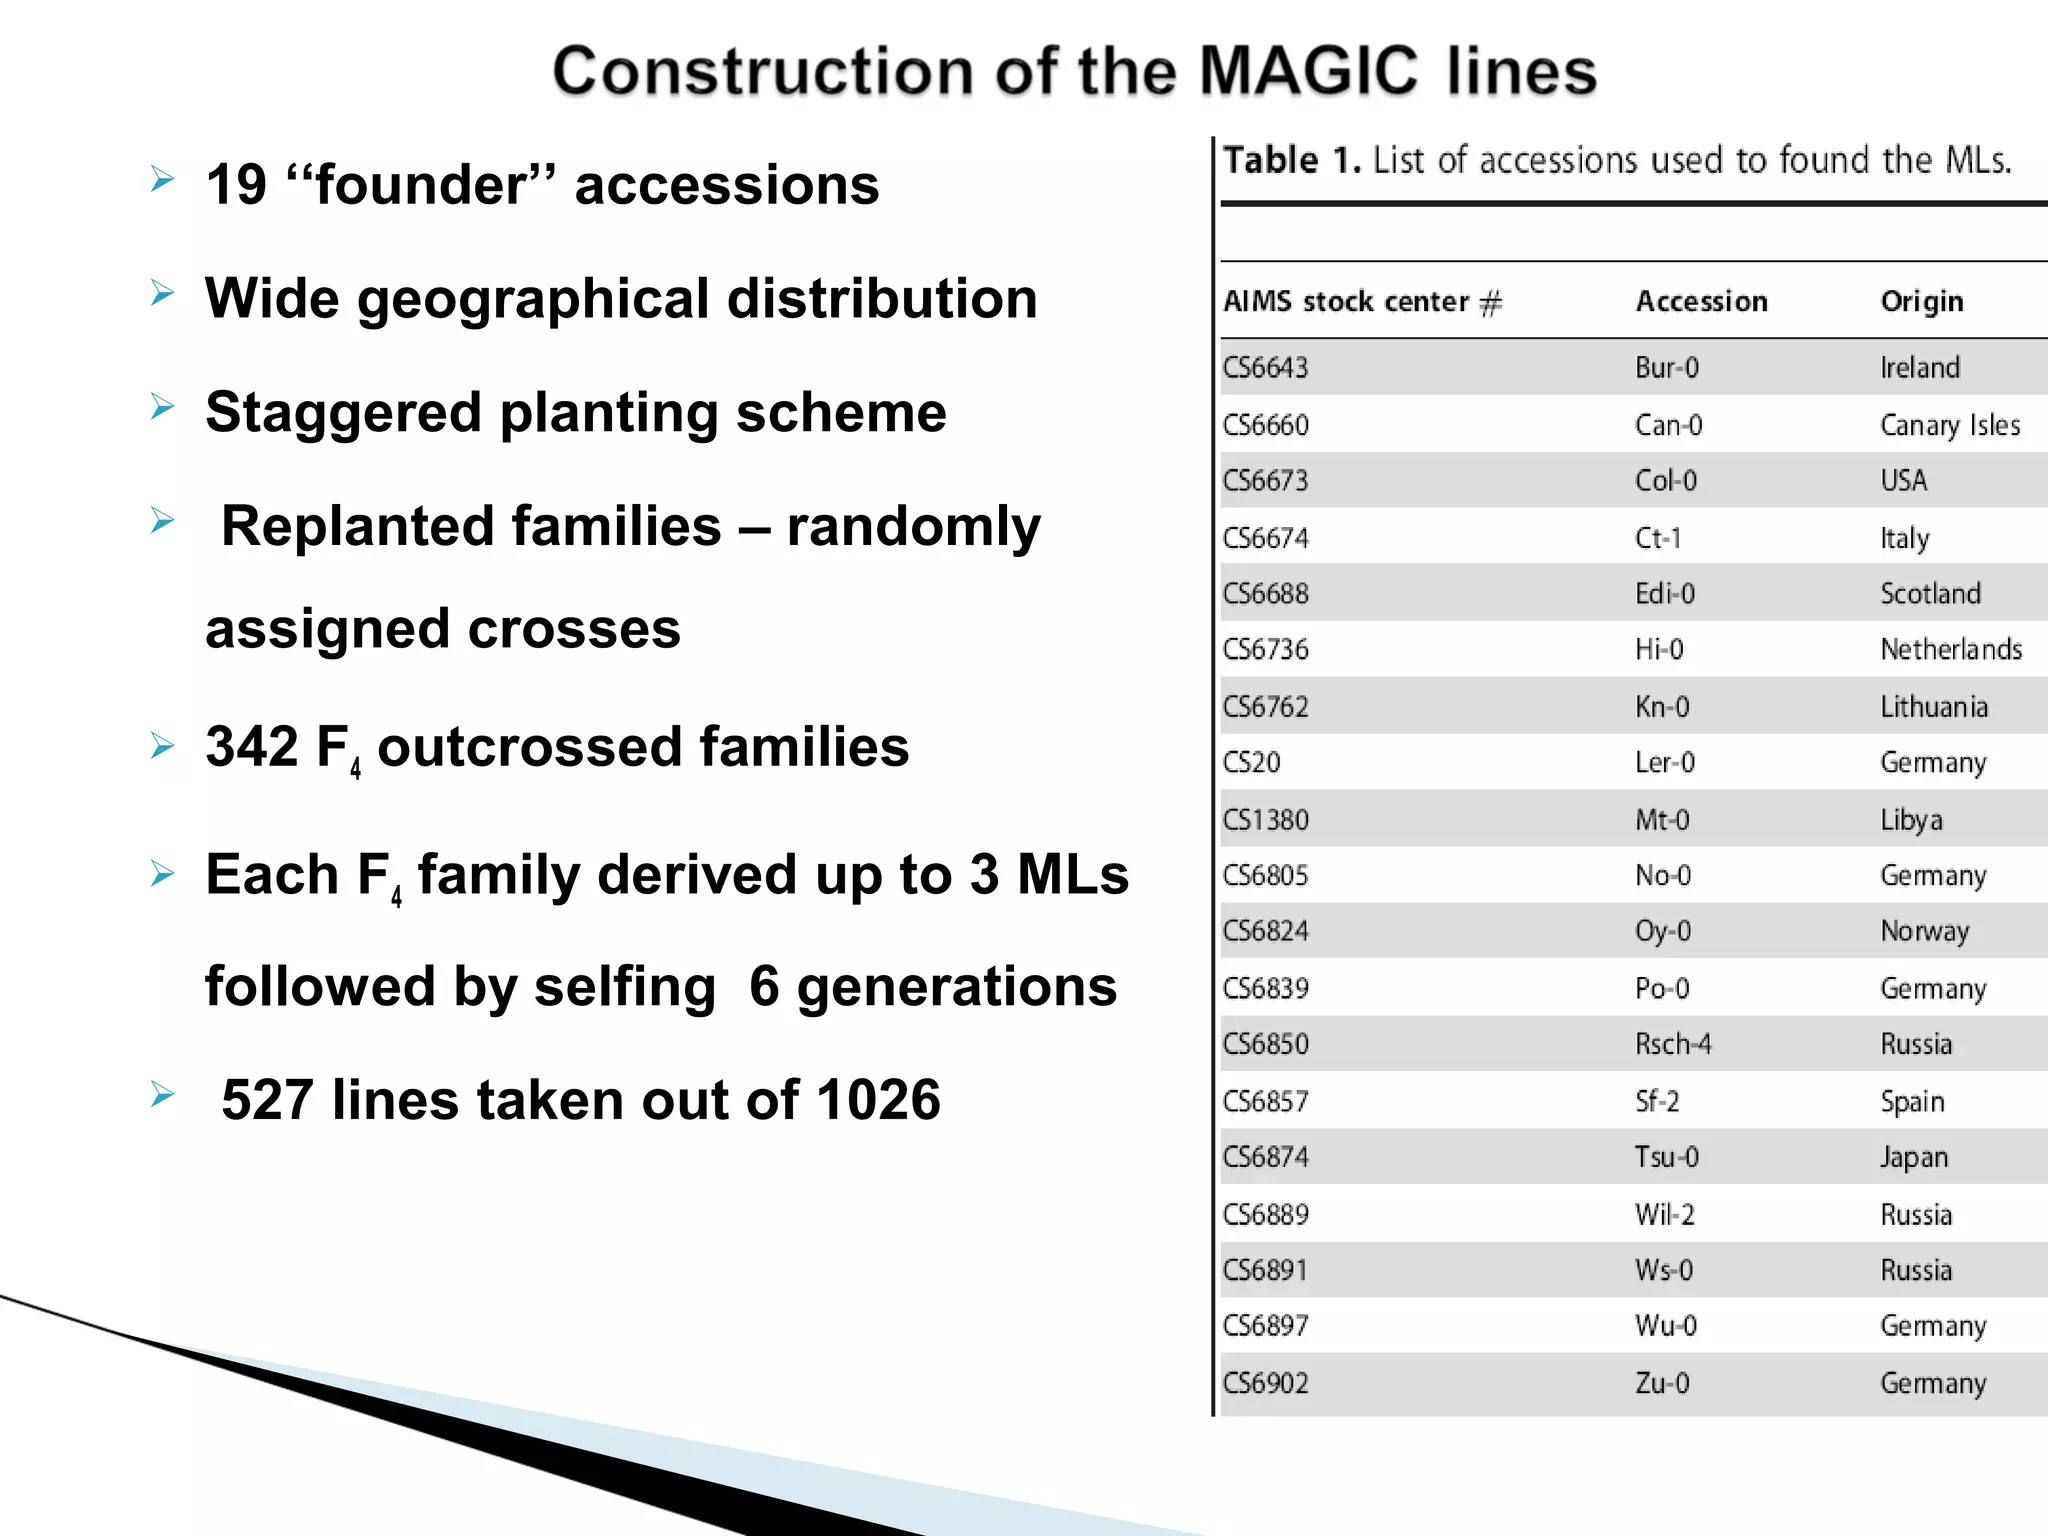
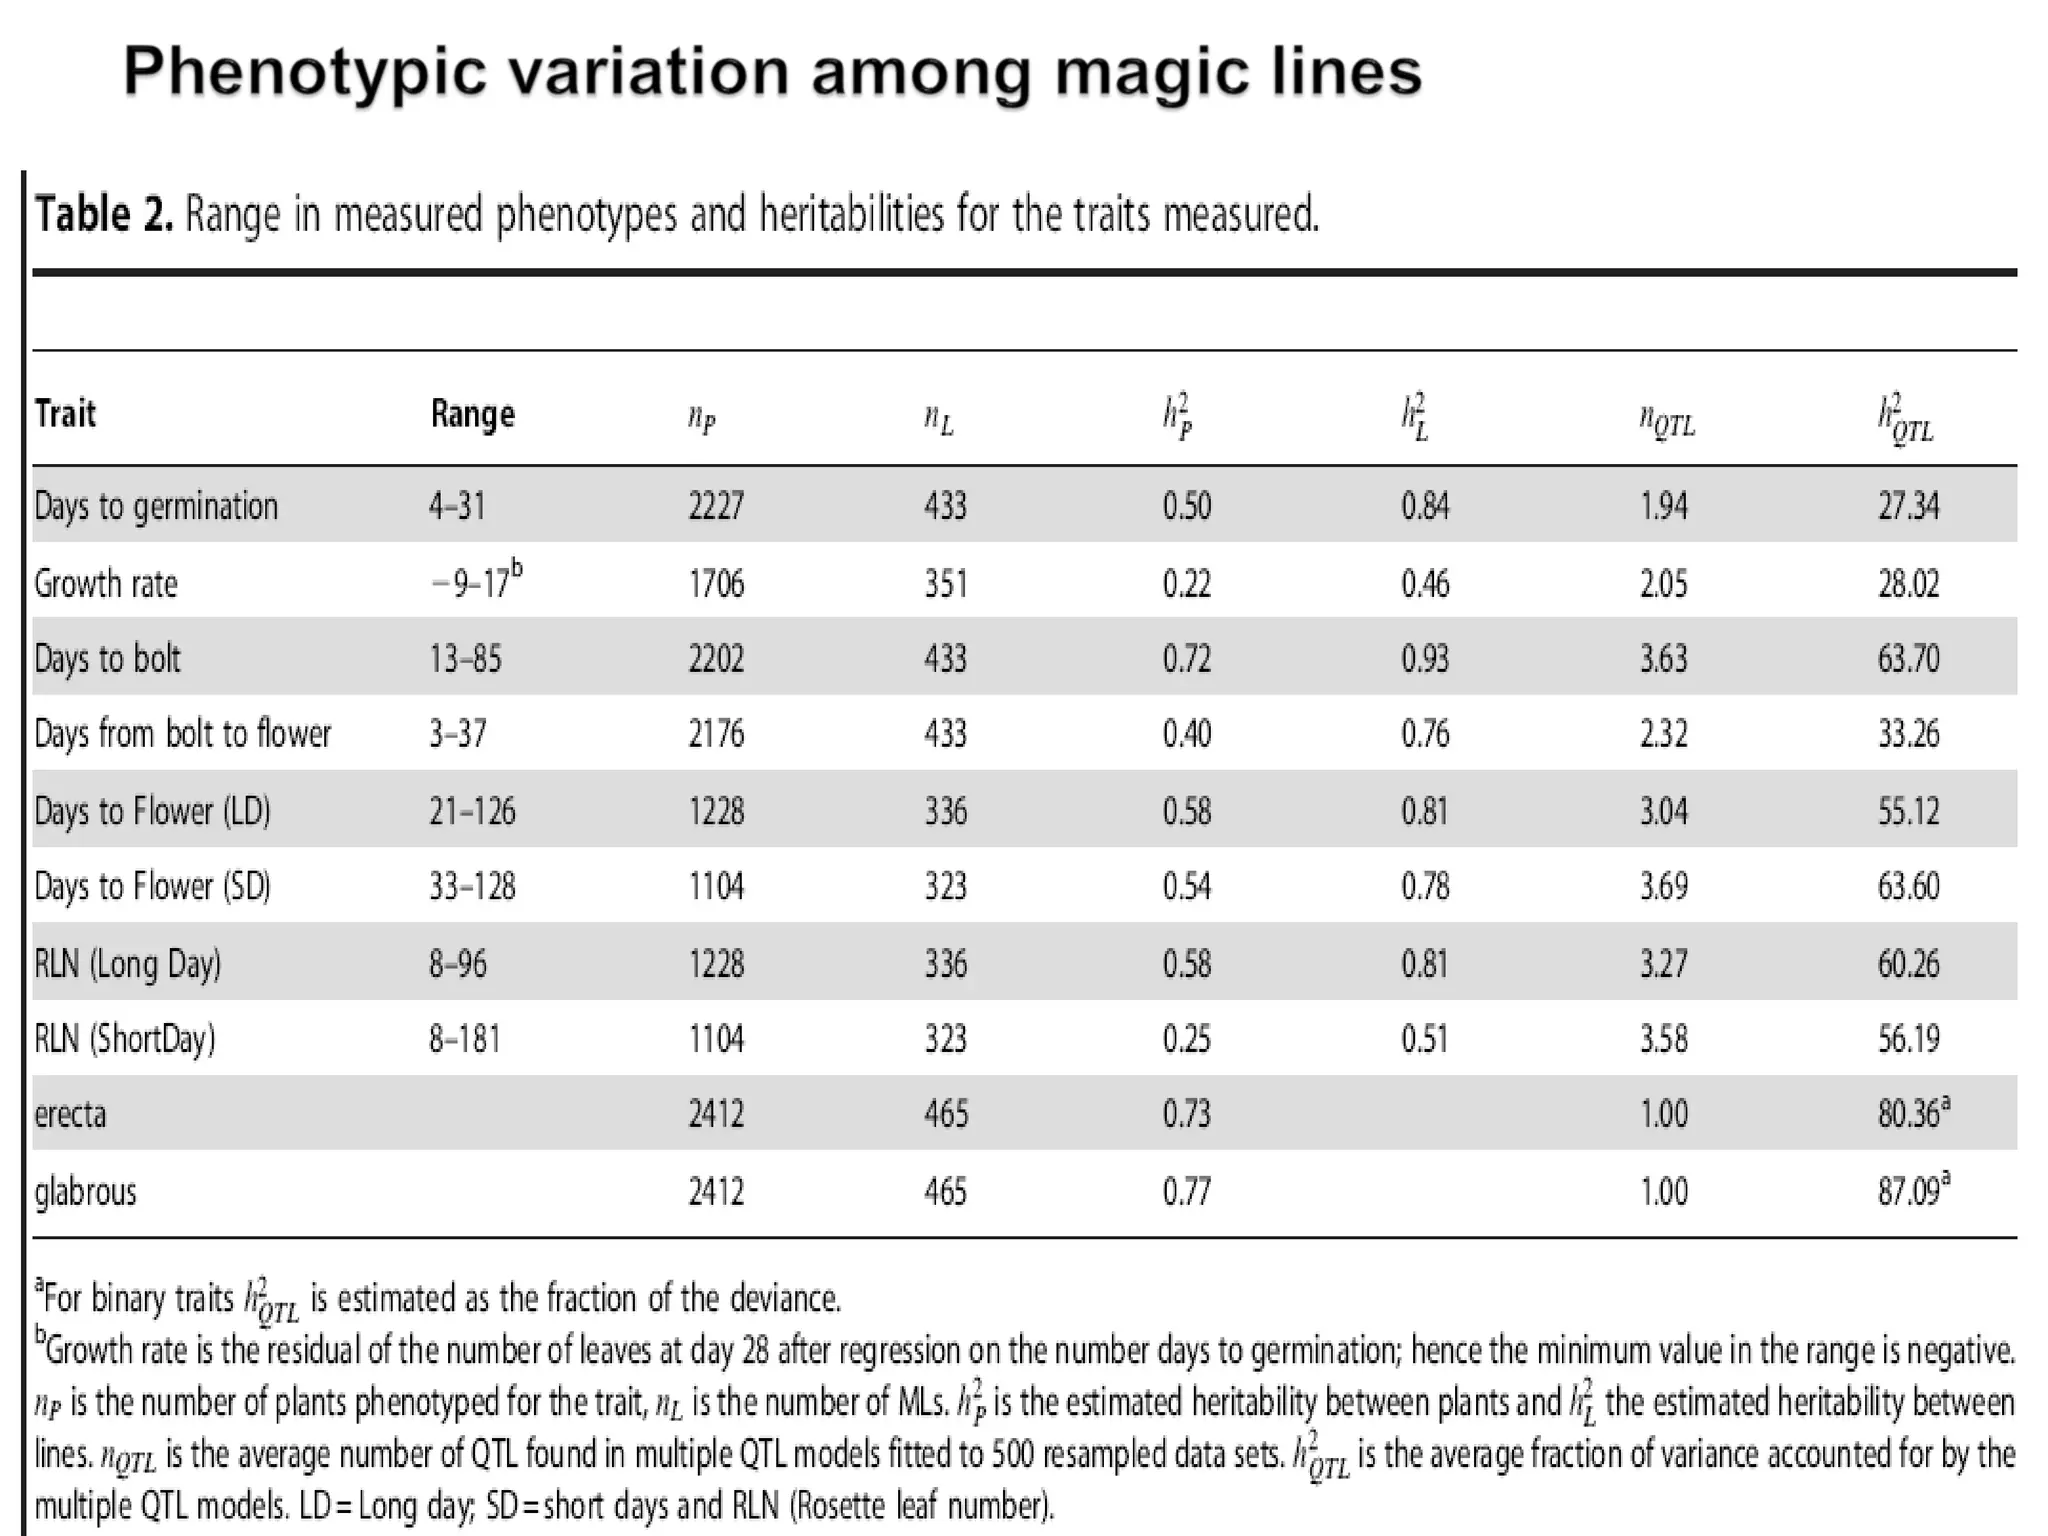
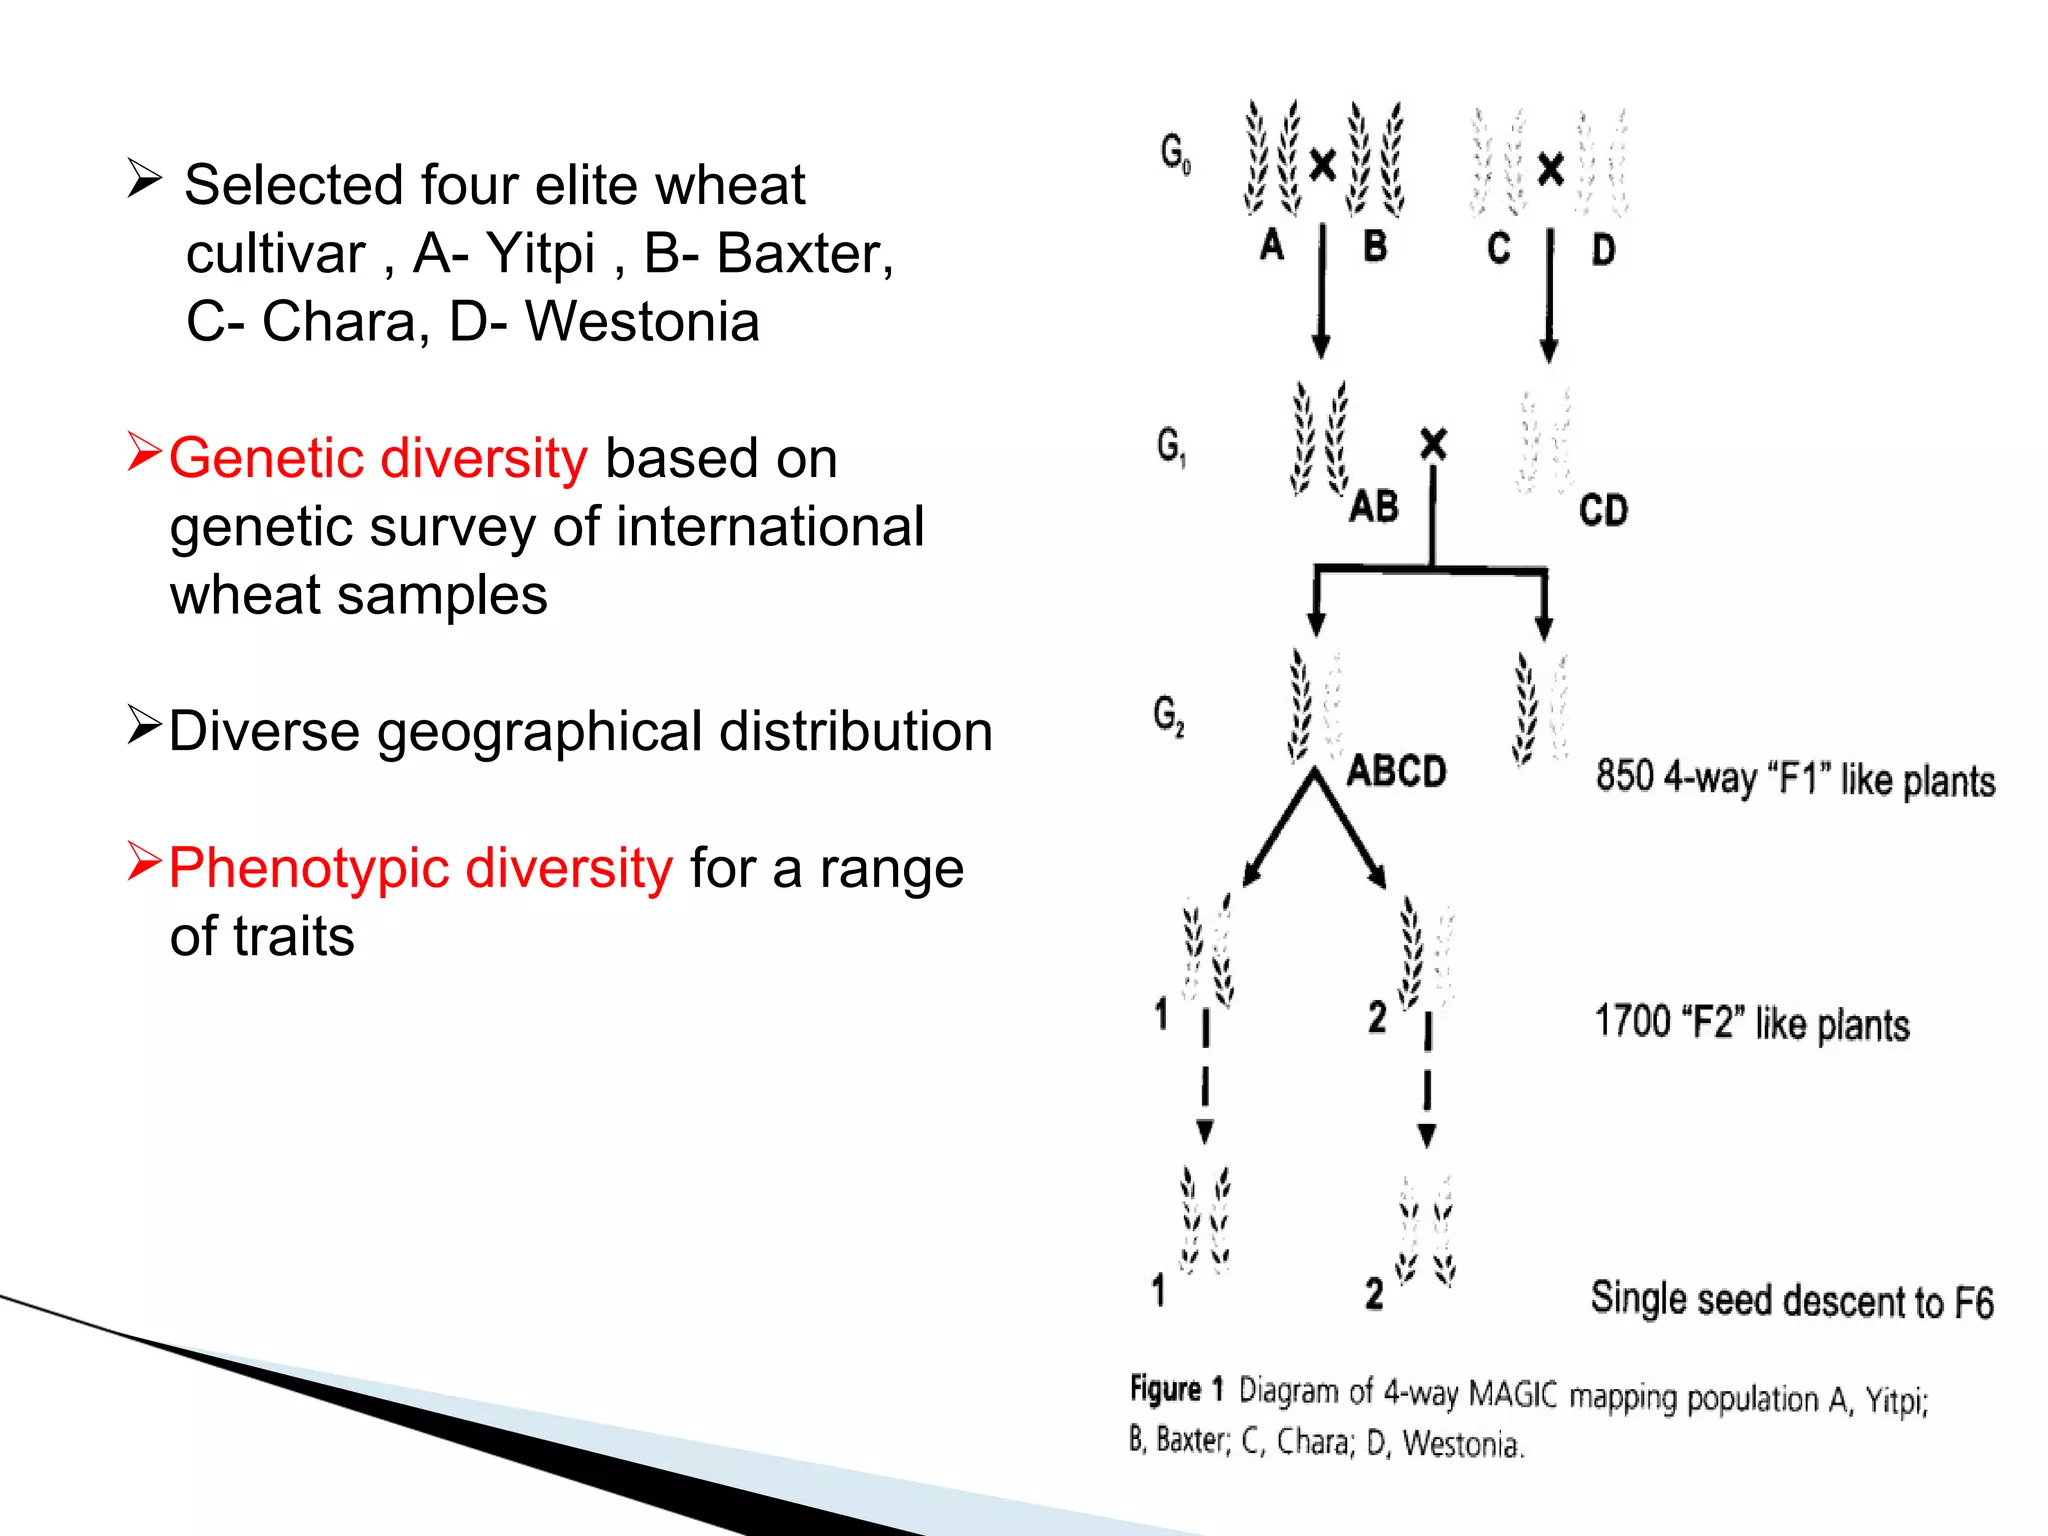

The document discusses the advantages and challenges of using multiparent advanced generation intercross (MAGIC) populations for genetic research in crops, particularly in quantitative trait loci (QTL) mapping. MAGIC populations enhance genetic diversity and facilitate more accurate QTL detection due to increased recombination, though they require significant resources and time. The ongoing research aims to improve understanding and application of these methods for crop trait improvement.


