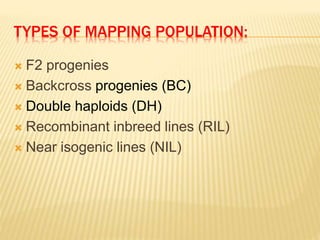
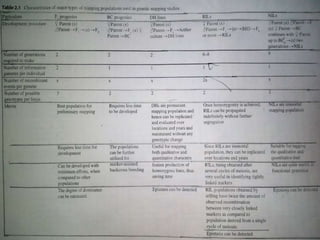
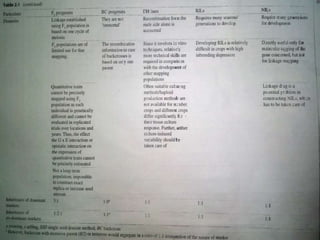
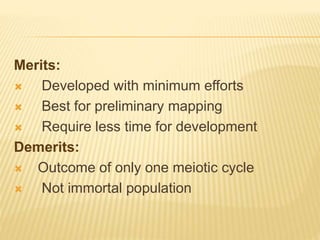
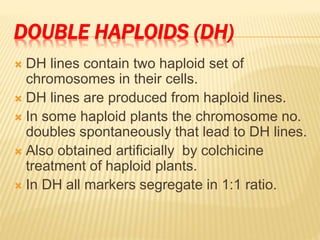
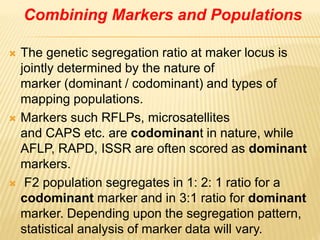
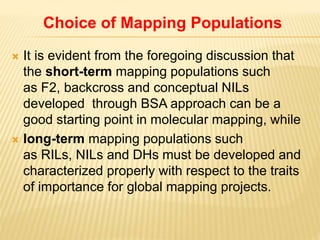
MAPPING
POPULATION
 PRESENTED BY :
SRISHTI AGGRAWAL
 M.SC BOTANY
 DEPT.OF SCIENCE
 DEI,AGRA
 PRESENTED TO :
 Dr. Ajay Kumar
 DEPT.OF SCIENCE
 DEI,AGRA
INTRODUCTION
 Population used for mapping the genes, is
commonly called as mapping population
and they usually obtained from controlled
crosses.
 Selection of parents is the 1st step for
production of mapping population.
 Parents selected to develop mapping
population should have sufficient variation for
trait of interest both at DNA sequence level
and at phenotypic level.
 Higher the variation, it is easier to find the
recombination.
 Mapping population is developed from
parents that are highly homozygous
 Both monogenic and polygenic traits can
be mapped when two parents are extremely
different for these traits.
TYPES OF MAPPING POPULATION:
 F2 progenies
 Backcross progenies (BC)
 Double haploids (DH)
 Recombinant inbreed lines (RIL)
 Near isogenic lines (NIL)
F2 POPULATION
 The simplest and rapid method of a mapping
population .
 Usually two pure lines are selected as
parents.
 Crossing of such parents will lead to produce
fertile progenies called F1 progenies.
 Individual of F1 plant is then selfed to
produce F2 population. Thus,F2 populations
is the outcome of one meiosis.
 The segregation ratio for codominant marker
is 1:2:1 while segregation ratio for each
dominant marker is 3:1.
Merits:
 Developed with minimum efforts
 Best for preliminary mapping
 Require less time for development
Demerits:
 Outcome of only one meiotic cycle
 Not immortal population
DOUBLE HAPLOIDS (DH)
 DH lines contain two haploid set of
chromosomes in their cells.
 DH lines are produced from haploid lines.
 In some haploid plants the chromosome no.
doubles spontaneously that lead to DH lines.
 Also obtained artificially by colchicine
treatment of haploid plants.
 In DH all markers segregate in 1:1 ratio.
Merits:
• Immortal/ permanent population
• Used in mapping of both qualitative and
quantitative trait
• Fast production of homozygous lines, thus
saving time.
Demerits:
• High cost involved in establishing tissue
culture.
• Recombination from the male side alone is
accounted.
BACK CROSS POPULATION (BC)
 To analyse the specific genes or other regulatory DNA
elements derived from one parent(donor) in the
background of another parent (recurrent),the hybrid F1
plant is backcrossed to recurrent parent.
Merits:
 The elite combination is not lost
 Less time require to develop
Demerits:
• Cant used for quantitative traits
• The recombination information in BC is based on only
one parent
• Not immortal
RECOMBINANT INBREED LINES (RIL)
RILs are the homozygous selfed or sibmated progeny of the
individuals of an F2 population.
Single seed descent method is best for development.
RILs with more than 98% homozygosity are produced by selfing
within 8-9 generations. Segregation ratio of RILs is 1:1.
Merits:
• Immortal population ,they can be replicated over different
locations
• Product of many meiotic cycles so useful to identify tightly linked
markers
Demerits:
• Require many seasons to develop RILs
• RIL development is difficult in crops having high inbreeding
depression.
NEAR ISOGENIC LINES (NILS)
NILs can be developed by repeated selfing or
backcrossing of F1 with recurrent parent.
Irrespective of dominant or codominant marker
NILs segregate in 1:1 ratio.
Merits:
 Immortal population
 Used for fine mapping
Demerits:
 Many generations require to develop NILs
 Increased cost, time and efforts
Combining Markers and Populations
 The genetic segregation ratio at maker locus is
jointly determined by the nature of
marker (dominant / codominant) and types of
mapping populations.
 Markers such RFLPs, microsatellites
and CAPS etc. are codominant in nature, while
AFLP, RAPD, ISSR are often scored as dominant
markers.
 F2 population segregates in 1: 2: 1 ratio for a
codominant marker and in 3:1 ratio for dominant
marker. Depending upon the segregation pattern,
statistical analysis of marker data will vary.
Choice of Mapping Populations
 It is evident from the foregoing discussion that
the short-term mapping populations such
as F2, backcross and conceptual NILs
developed through BSA approach can be a
good starting point in molecular mapping, while
 long-term mapping populations such
as RILs, NILs and DHs must be developed and
characterized properly with respect to the traits
of importance for global mapping projects.
As a matter of fact, the development and
phenotypic characterization of mapping
populations should become an integral part
of the ongoing breeding programmes in
important crops. At this point, the role of
geneticists and plant breeders becomes
crucial to reap the benefits of genetic
mapping.
Mapping population ppt

Mapping population ppt

  • 1.
    MAPPING POPULATION  PRESENTED BY: SRISHTI AGGRAWAL  M.SC BOTANY  DEPT.OF SCIENCE  DEI,AGRA  PRESENTED TO :  Dr. Ajay Kumar  DEPT.OF SCIENCE  DEI,AGRA
  • 2.
    INTRODUCTION  Population usedfor mapping the genes, is commonly called as mapping population and they usually obtained from controlled crosses.  Selection of parents is the 1st step for production of mapping population.  Parents selected to develop mapping population should have sufficient variation for trait of interest both at DNA sequence level and at phenotypic level.
  • 3.
     Higher thevariation, it is easier to find the recombination.  Mapping population is developed from parents that are highly homozygous  Both monogenic and polygenic traits can be mapped when two parents are extremely different for these traits.
  • 4.
    TYPES OF MAPPINGPOPULATION:  F2 progenies  Backcross progenies (BC)  Double haploids (DH)  Recombinant inbreed lines (RIL)  Near isogenic lines (NIL)
  • 7.
    F2 POPULATION  Thesimplest and rapid method of a mapping population .  Usually two pure lines are selected as parents.  Crossing of such parents will lead to produce fertile progenies called F1 progenies.  Individual of F1 plant is then selfed to produce F2 population. Thus,F2 populations is the outcome of one meiosis.  The segregation ratio for codominant marker is 1:2:1 while segregation ratio for each dominant marker is 3:1.
  • 8.
    Merits:  Developed withminimum efforts  Best for preliminary mapping  Require less time for development Demerits:  Outcome of only one meiotic cycle  Not immortal population
  • 9.
    DOUBLE HAPLOIDS (DH) DH lines contain two haploid set of chromosomes in their cells.  DH lines are produced from haploid lines.  In some haploid plants the chromosome no. doubles spontaneously that lead to DH lines.  Also obtained artificially by colchicine treatment of haploid plants.  In DH all markers segregate in 1:1 ratio.
  • 10.
    Merits: • Immortal/ permanentpopulation • Used in mapping of both qualitative and quantitative trait • Fast production of homozygous lines, thus saving time. Demerits: • High cost involved in establishing tissue culture. • Recombination from the male side alone is accounted.
  • 11.
    BACK CROSS POPULATION(BC)  To analyse the specific genes or other regulatory DNA elements derived from one parent(donor) in the background of another parent (recurrent),the hybrid F1 plant is backcrossed to recurrent parent. Merits:  The elite combination is not lost  Less time require to develop Demerits: • Cant used for quantitative traits • The recombination information in BC is based on only one parent • Not immortal
  • 12.
    RECOMBINANT INBREED LINES(RIL) RILs are the homozygous selfed or sibmated progeny of the individuals of an F2 population. Single seed descent method is best for development. RILs with more than 98% homozygosity are produced by selfing within 8-9 generations. Segregation ratio of RILs is 1:1. Merits: • Immortal population ,they can be replicated over different locations • Product of many meiotic cycles so useful to identify tightly linked markers Demerits: • Require many seasons to develop RILs • RIL development is difficult in crops having high inbreeding depression.
  • 13.
    NEAR ISOGENIC LINES(NILS) NILs can be developed by repeated selfing or backcrossing of F1 with recurrent parent. Irrespective of dominant or codominant marker NILs segregate in 1:1 ratio. Merits:  Immortal population  Used for fine mapping Demerits:  Many generations require to develop NILs  Increased cost, time and efforts
  • 14.
    Combining Markers andPopulations  The genetic segregation ratio at maker locus is jointly determined by the nature of marker (dominant / codominant) and types of mapping populations.  Markers such RFLPs, microsatellites and CAPS etc. are codominant in nature, while AFLP, RAPD, ISSR are often scored as dominant markers.  F2 population segregates in 1: 2: 1 ratio for a codominant marker and in 3:1 ratio for dominant marker. Depending upon the segregation pattern, statistical analysis of marker data will vary.
  • 15.
    Choice of MappingPopulations  It is evident from the foregoing discussion that the short-term mapping populations such as F2, backcross and conceptual NILs developed through BSA approach can be a good starting point in molecular mapping, while  long-term mapping populations such as RILs, NILs and DHs must be developed and characterized properly with respect to the traits of importance for global mapping projects.
  • 16.
    As a matterof fact, the development and phenotypic characterization of mapping populations should become an integral part of the ongoing breeding programmes in important crops. At this point, the role of geneticists and plant breeders becomes crucial to reap the benefits of genetic mapping.