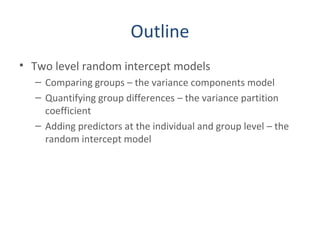
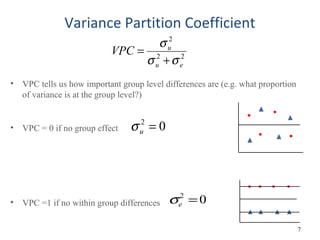
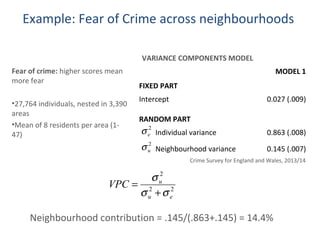
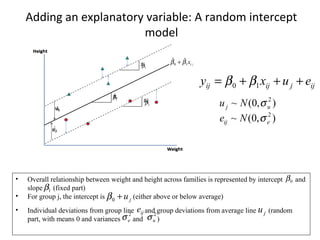
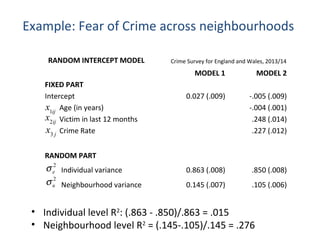
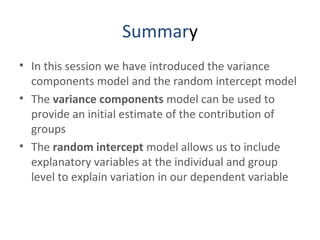
Session 2: Random intercept models
Multilevel Models
Outline
• Two level random intercept models
– Comparing groups – the variance components model
– Quantifying group differences – the variance partition
coefficient
– Adding predictors at the individual and group level – the
random intercept model
Two level random intercept models
for continuous data
• Simplest form of multilevel models in wide use
• Extends standard linear regression models by
partitioning the residual error between individual and
group components
• But assumes same relationship between x and y across
groups
• Can provide an initial assessment of importance of
groups (when no explanatory variables are included)
Single-level model for mean height
• yi = the height for the ith
individual
• is mean height in population and is residual for ith
individual
(i=1,2...,n)
• Assume are approximately normal with mean 0. The variance
summarises distribution around the mean.
ii ey += 0β
),0(~ 2
ei Ne σ
0β ie
ie
0
ˆβ
1
ˆe
2
ˆe
3
ˆe
4
ˆe
5
ˆe
6
ˆe
7
ˆe 8
ˆe
5
• But suppose we know our observations come from different groups (e.g.
families), j=1,…, J
shown here are two groups (in practice, there will be many more)
• We can capitalise on this additional information and improve our model
0
ˆβ
Single-level model for mean height
Multi-level ‘empty’ model for mean height: variance
components model
• - height for the ith
individual in jth
group (1,2,...n).
• - average height across all groups
• - group mean deviations from overall mean height
• - individual deviations from group means
• - average height in group j
ijjij euy ++= )( 0β
),0(~ 2
uj Nu σ
),0(~ 2
eij Ne σ
ijy
0β
ju
ju+0β
ije
0
ˆβ
12
ˆe
22
ˆe
32ˆe
42
ˆe
11
ˆe
21
ˆe
31
ˆe
41
ˆe
1
ˆu
2
ˆu
group 1 has above-average mean (positive u)
group 2 has below-average mean (negative u)
• VPC tells us how important group level differences are (e.g. what proportion
of variance is at the group level?)
• VPC = 0 if no group effect
• VPC =1 if no within group differences
Variance Partition Coefficient
7
22
2
eu
u
VPC
σσ
σ
+
=
2
0uσ =
2
0eσ =
Example: Fear of Crime across neighbourhoods
MODEL 1
FIXED PART
Intercept 0.027 (.009)
RANDOM PART
Individual variance 0.863 (.008)
Neighbourhood variance 0.145 (.007)
Neighbourhood contribution = .145/(.863+.145) = 14.4%
VARIANCE COMPONENTS MODEL
22
2
eu
u
VPC
σσ
σ
+
=
2
uσ
2
eσ
Fear of crime: higher scores mean
more fear
•27,764 individuals, nested in 3,390
areas
•Mean of 8 residents per area (1-
47)
Crime Survey for England and Wales, 2013/14
• Overall relationship between weight and height across families is represented by intercept and
slope (fixed part)
• For group j, the intercept is (either above or below average)
• Individual deviations from group line and group deviations from average line (random
part, with means 0 and variances and )
ijjijij euxy +++= 10 ββ
),0(~ 2
uj Nu σ
),0(~ 2
eij Ne σ
0β
1β
ju+0β
ije ju2
uσ2
eσ
ix10
ˆˆ ββ +
1
ˆβ
1
ˆβ
1
ˆβ
1
ˆu
2
ˆu
Adding an explanatory variable: A random intercept
model
Group level explanatory variables
• Multilevel models enable us to explore group level variables
simultaneously with individual
• Can be from external sources (administrative data etc), or
aggregates of individual data (depending on group size)
• No need to directly identify them as group effects, this is
accounted for by the group residual
• Standard errors generally underestimated if included in
individual level analysis
10
MODEL 1 MODEL 2
FIXED PART
Intercept 0.027 (.009) -.005 (.009)
Age (in years) -.004 (.001)
Victim in last 12 months .248 (.014)
Crime Rate .227 (.012)
RANDOM PART
Individual variance 0.863 (.008) .850 (.008)
Neighbourhood variance 0.145 (.007) .105 (.006)
Example: Fear of Crime across neighbourhoods
• Individual level R2
: (.863 - .850)/.863 = .015
• Neighbourhood level R2
= (.145-.105)/.145 = .276
RANDOM INTERCEPT MODEL
2
uσ
2
eσ
Crime Survey for England and Wales, 2013/14
x1ij
x2ij
x3 j
Summary
• In this session we have introduced the variance
components model and the random intercept model
• The variance components model can be used to
provide an initial estimate of the contribution of
groups
• The random intercept model allows us to include
explanatory variables at the individual and group
level to explain variation in our dependent variable
Useful websites for further
information
• www.understandingsociety.ac.uk (a
‘biosocial’ resource)
• www.closer.ac.uk (UK longitudinal
studies)
• www.ukdataservice.ac.uk (access data)
• www.metadac.ac.uk (genetics data)
• www.ncrm.ac.uk (training and
information)

Multi level modelling - random intercept models | Ian Brunton Smith

  • 1.
    Session 2: Randomintercept models Multilevel Models
  • 2.
    Outline • Two levelrandom intercept models – Comparing groups – the variance components model – Quantifying group differences – the variance partition coefficient – Adding predictors at the individual and group level – the random intercept model
  • 3.
    Two level randomintercept models for continuous data • Simplest form of multilevel models in wide use • Extends standard linear regression models by partitioning the residual error between individual and group components • But assumes same relationship between x and y across groups • Can provide an initial assessment of importance of groups (when no explanatory variables are included)
  • 4.
    Single-level model formean height • yi = the height for the ith individual • is mean height in population and is residual for ith individual (i=1,2...,n) • Assume are approximately normal with mean 0. The variance summarises distribution around the mean. ii ey += 0β ),0(~ 2 ei Ne σ 0β ie ie 0 ˆβ 1 ˆe 2 ˆe 3 ˆe 4 ˆe 5 ˆe 6 ˆe 7 ˆe 8 ˆe
  • 5.
    5 • But supposewe know our observations come from different groups (e.g. families), j=1,…, J shown here are two groups (in practice, there will be many more) • We can capitalise on this additional information and improve our model 0 ˆβ Single-level model for mean height
  • 6.
    Multi-level ‘empty’ modelfor mean height: variance components model • - height for the ith individual in jth group (1,2,...n). • - average height across all groups • - group mean deviations from overall mean height • - individual deviations from group means • - average height in group j ijjij euy ++= )( 0β ),0(~ 2 uj Nu σ ),0(~ 2 eij Ne σ ijy 0β ju ju+0β ije 0 ˆβ 12 ˆe 22 ˆe 32ˆe 42 ˆe 11 ˆe 21 ˆe 31 ˆe 41 ˆe 1 ˆu 2 ˆu group 1 has above-average mean (positive u) group 2 has below-average mean (negative u)
  • 7.
    • VPC tellsus how important group level differences are (e.g. what proportion of variance is at the group level?) • VPC = 0 if no group effect • VPC =1 if no within group differences Variance Partition Coefficient 7 22 2 eu u VPC σσ σ + = 2 0uσ = 2 0eσ =
  • 8.
    Example: Fear ofCrime across neighbourhoods MODEL 1 FIXED PART Intercept 0.027 (.009) RANDOM PART Individual variance 0.863 (.008) Neighbourhood variance 0.145 (.007) Neighbourhood contribution = .145/(.863+.145) = 14.4% VARIANCE COMPONENTS MODEL 22 2 eu u VPC σσ σ + = 2 uσ 2 eσ Fear of crime: higher scores mean more fear •27,764 individuals, nested in 3,390 areas •Mean of 8 residents per area (1- 47) Crime Survey for England and Wales, 2013/14
  • 9.
    • Overall relationshipbetween weight and height across families is represented by intercept and slope (fixed part) • For group j, the intercept is (either above or below average) • Individual deviations from group line and group deviations from average line (random part, with means 0 and variances and ) ijjijij euxy +++= 10 ββ ),0(~ 2 uj Nu σ ),0(~ 2 eij Ne σ 0β 1β ju+0β ije ju2 uσ2 eσ ix10 ˆˆ ββ + 1 ˆβ 1 ˆβ 1 ˆβ 1 ˆu 2 ˆu Adding an explanatory variable: A random intercept model
  • 10.
    Group level explanatoryvariables • Multilevel models enable us to explore group level variables simultaneously with individual • Can be from external sources (administrative data etc), or aggregates of individual data (depending on group size) • No need to directly identify them as group effects, this is accounted for by the group residual • Standard errors generally underestimated if included in individual level analysis 10
  • 11.
    MODEL 1 MODEL2 FIXED PART Intercept 0.027 (.009) -.005 (.009) Age (in years) -.004 (.001) Victim in last 12 months .248 (.014) Crime Rate .227 (.012) RANDOM PART Individual variance 0.863 (.008) .850 (.008) Neighbourhood variance 0.145 (.007) .105 (.006) Example: Fear of Crime across neighbourhoods • Individual level R2 : (.863 - .850)/.863 = .015 • Neighbourhood level R2 = (.145-.105)/.145 = .276 RANDOM INTERCEPT MODEL 2 uσ 2 eσ Crime Survey for England and Wales, 2013/14 x1ij x2ij x3 j
  • 12.
    Summary • In thissession we have introduced the variance components model and the random intercept model • The variance components model can be used to provide an initial estimate of the contribution of groups • The random intercept model allows us to include explanatory variables at the individual and group level to explain variation in our dependent variable
  • 13.
    Useful websites forfurther information • www.understandingsociety.ac.uk (a ‘biosocial’ resource) • www.closer.ac.uk (UK longitudinal studies) • www.ukdataservice.ac.uk (access data) • www.metadac.ac.uk (genetics data) • www.ncrm.ac.uk (training and information)

Editor's Notes

  • #8 VPC = 1, all the variation is between the groups, no individual level variation within a group