Downloaded 167 times

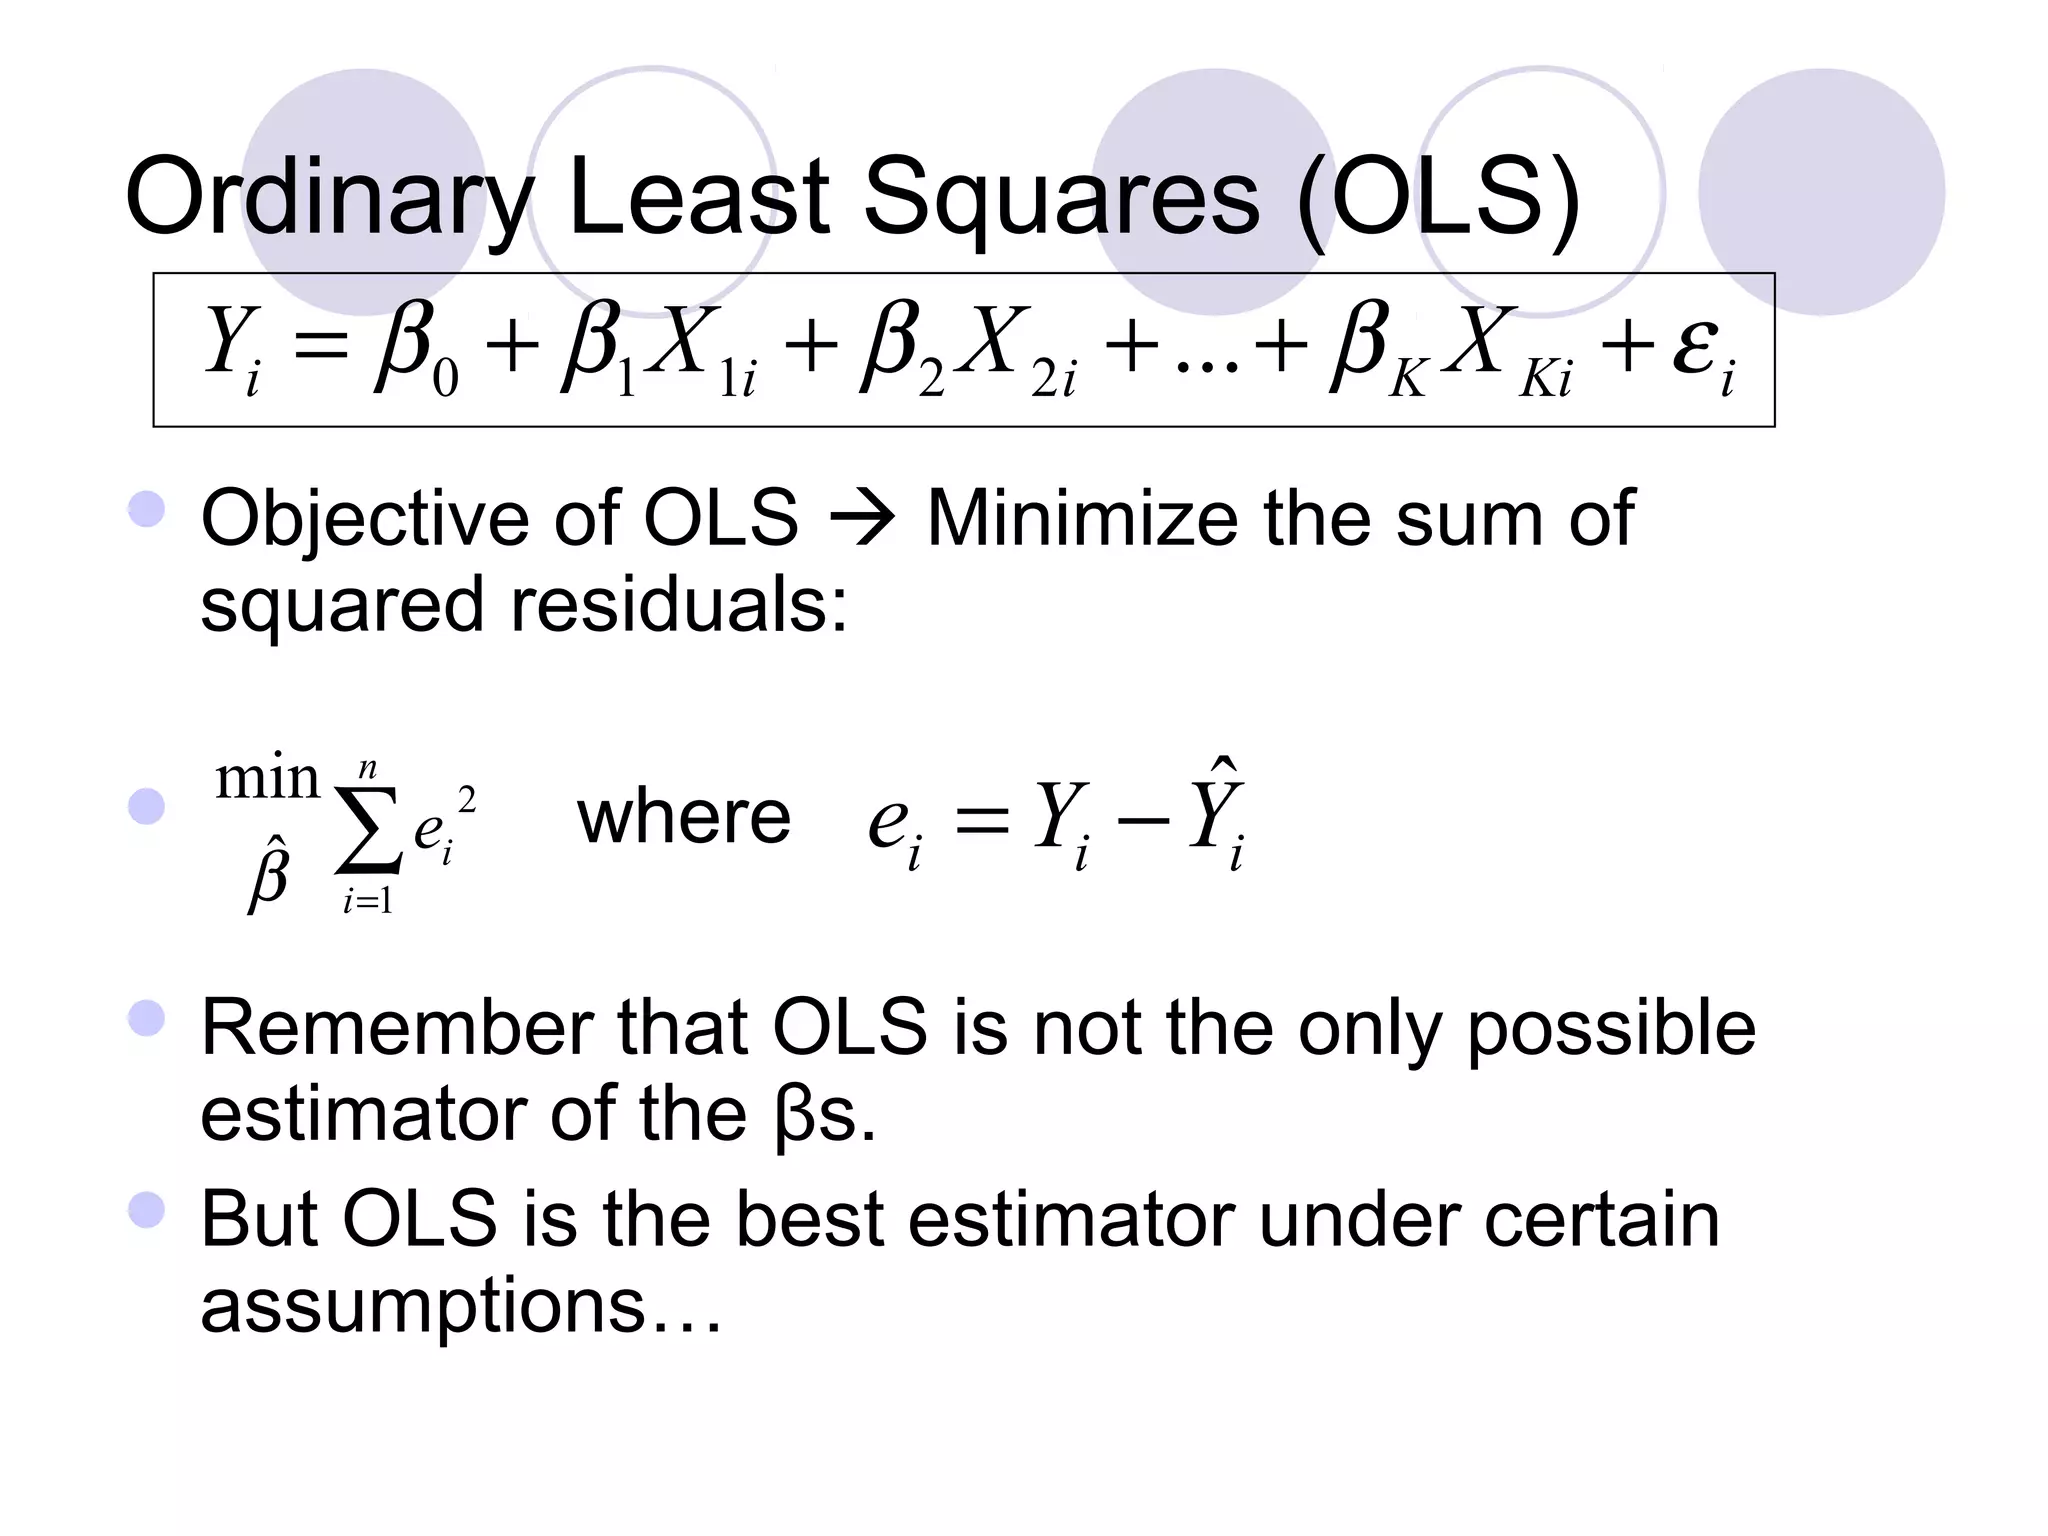
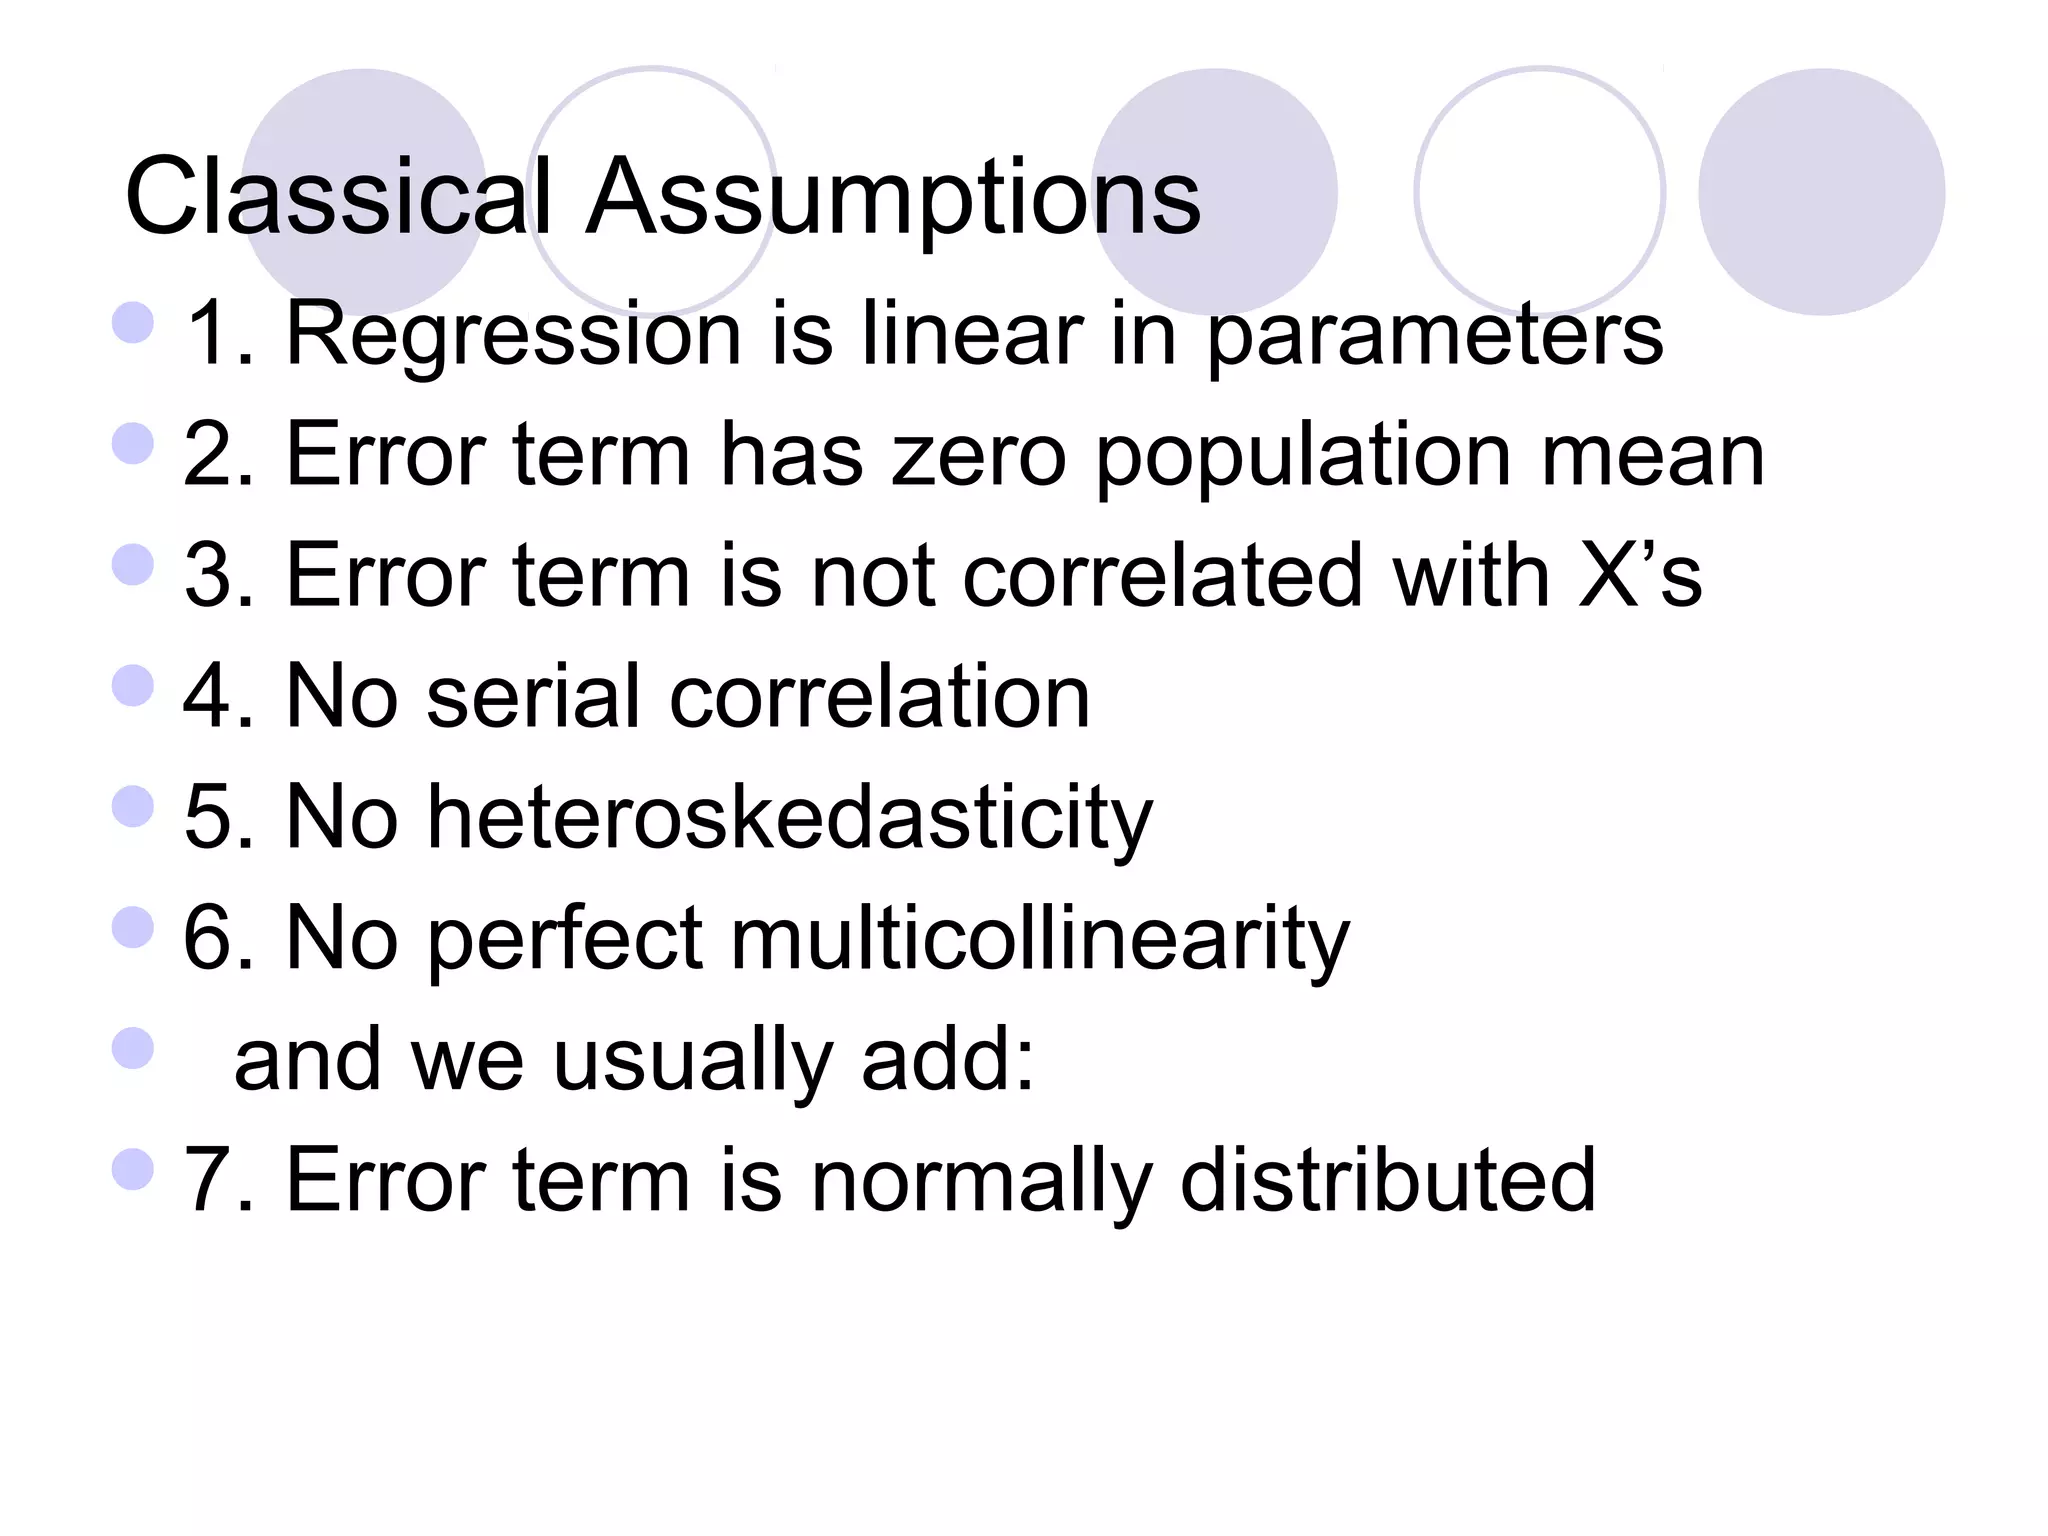
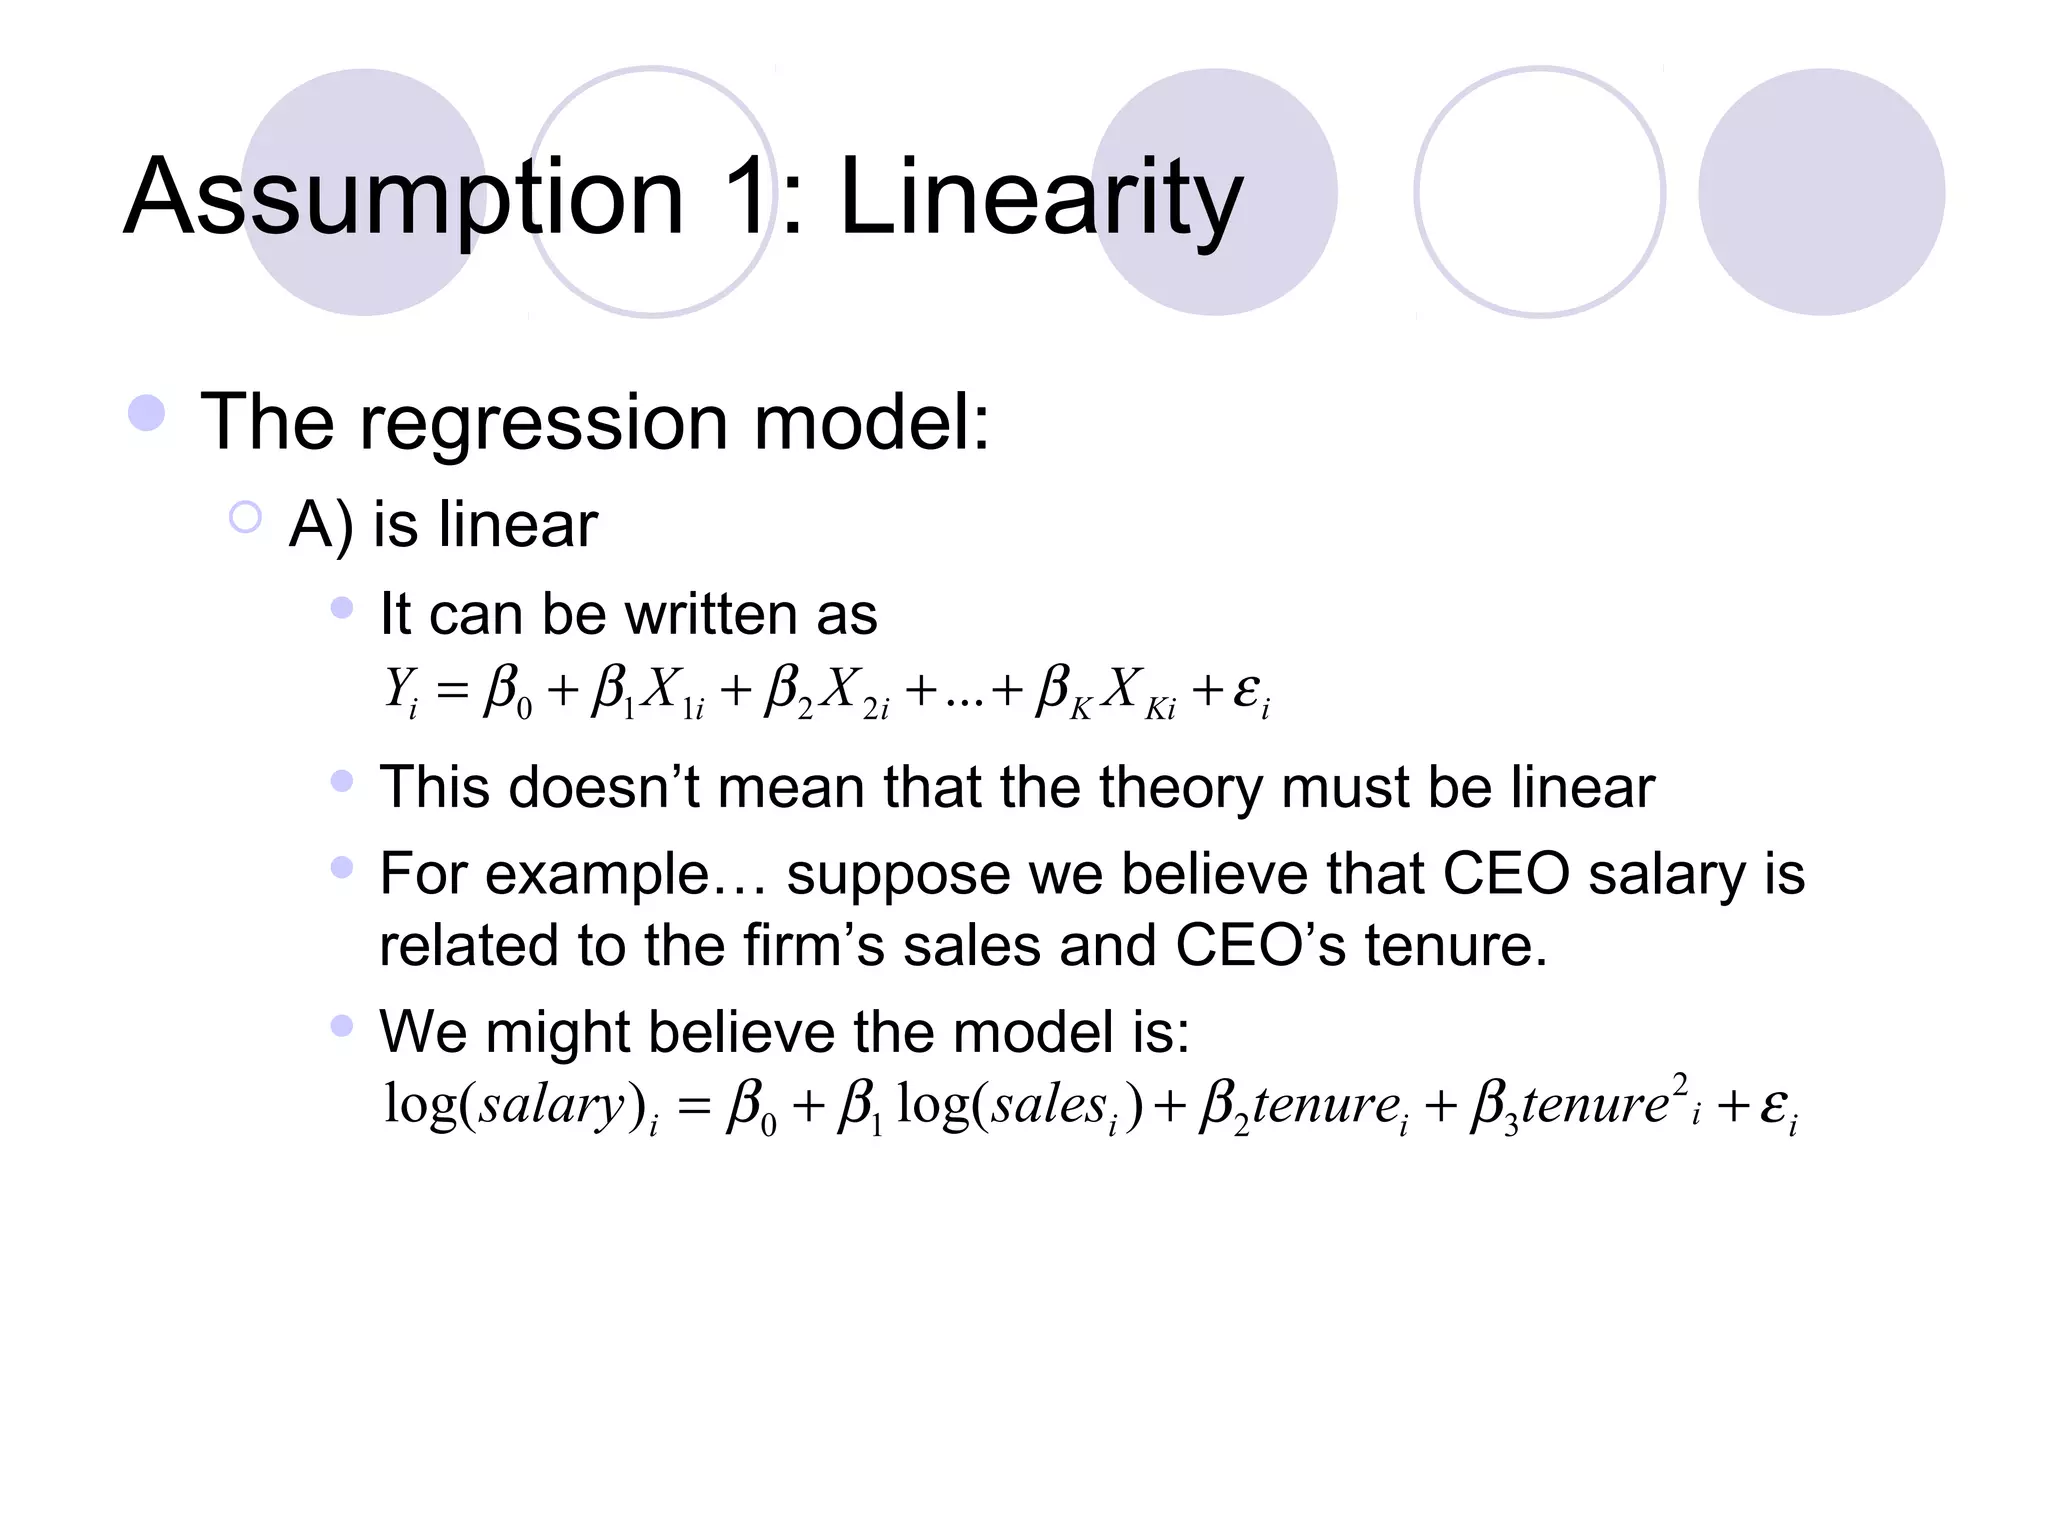
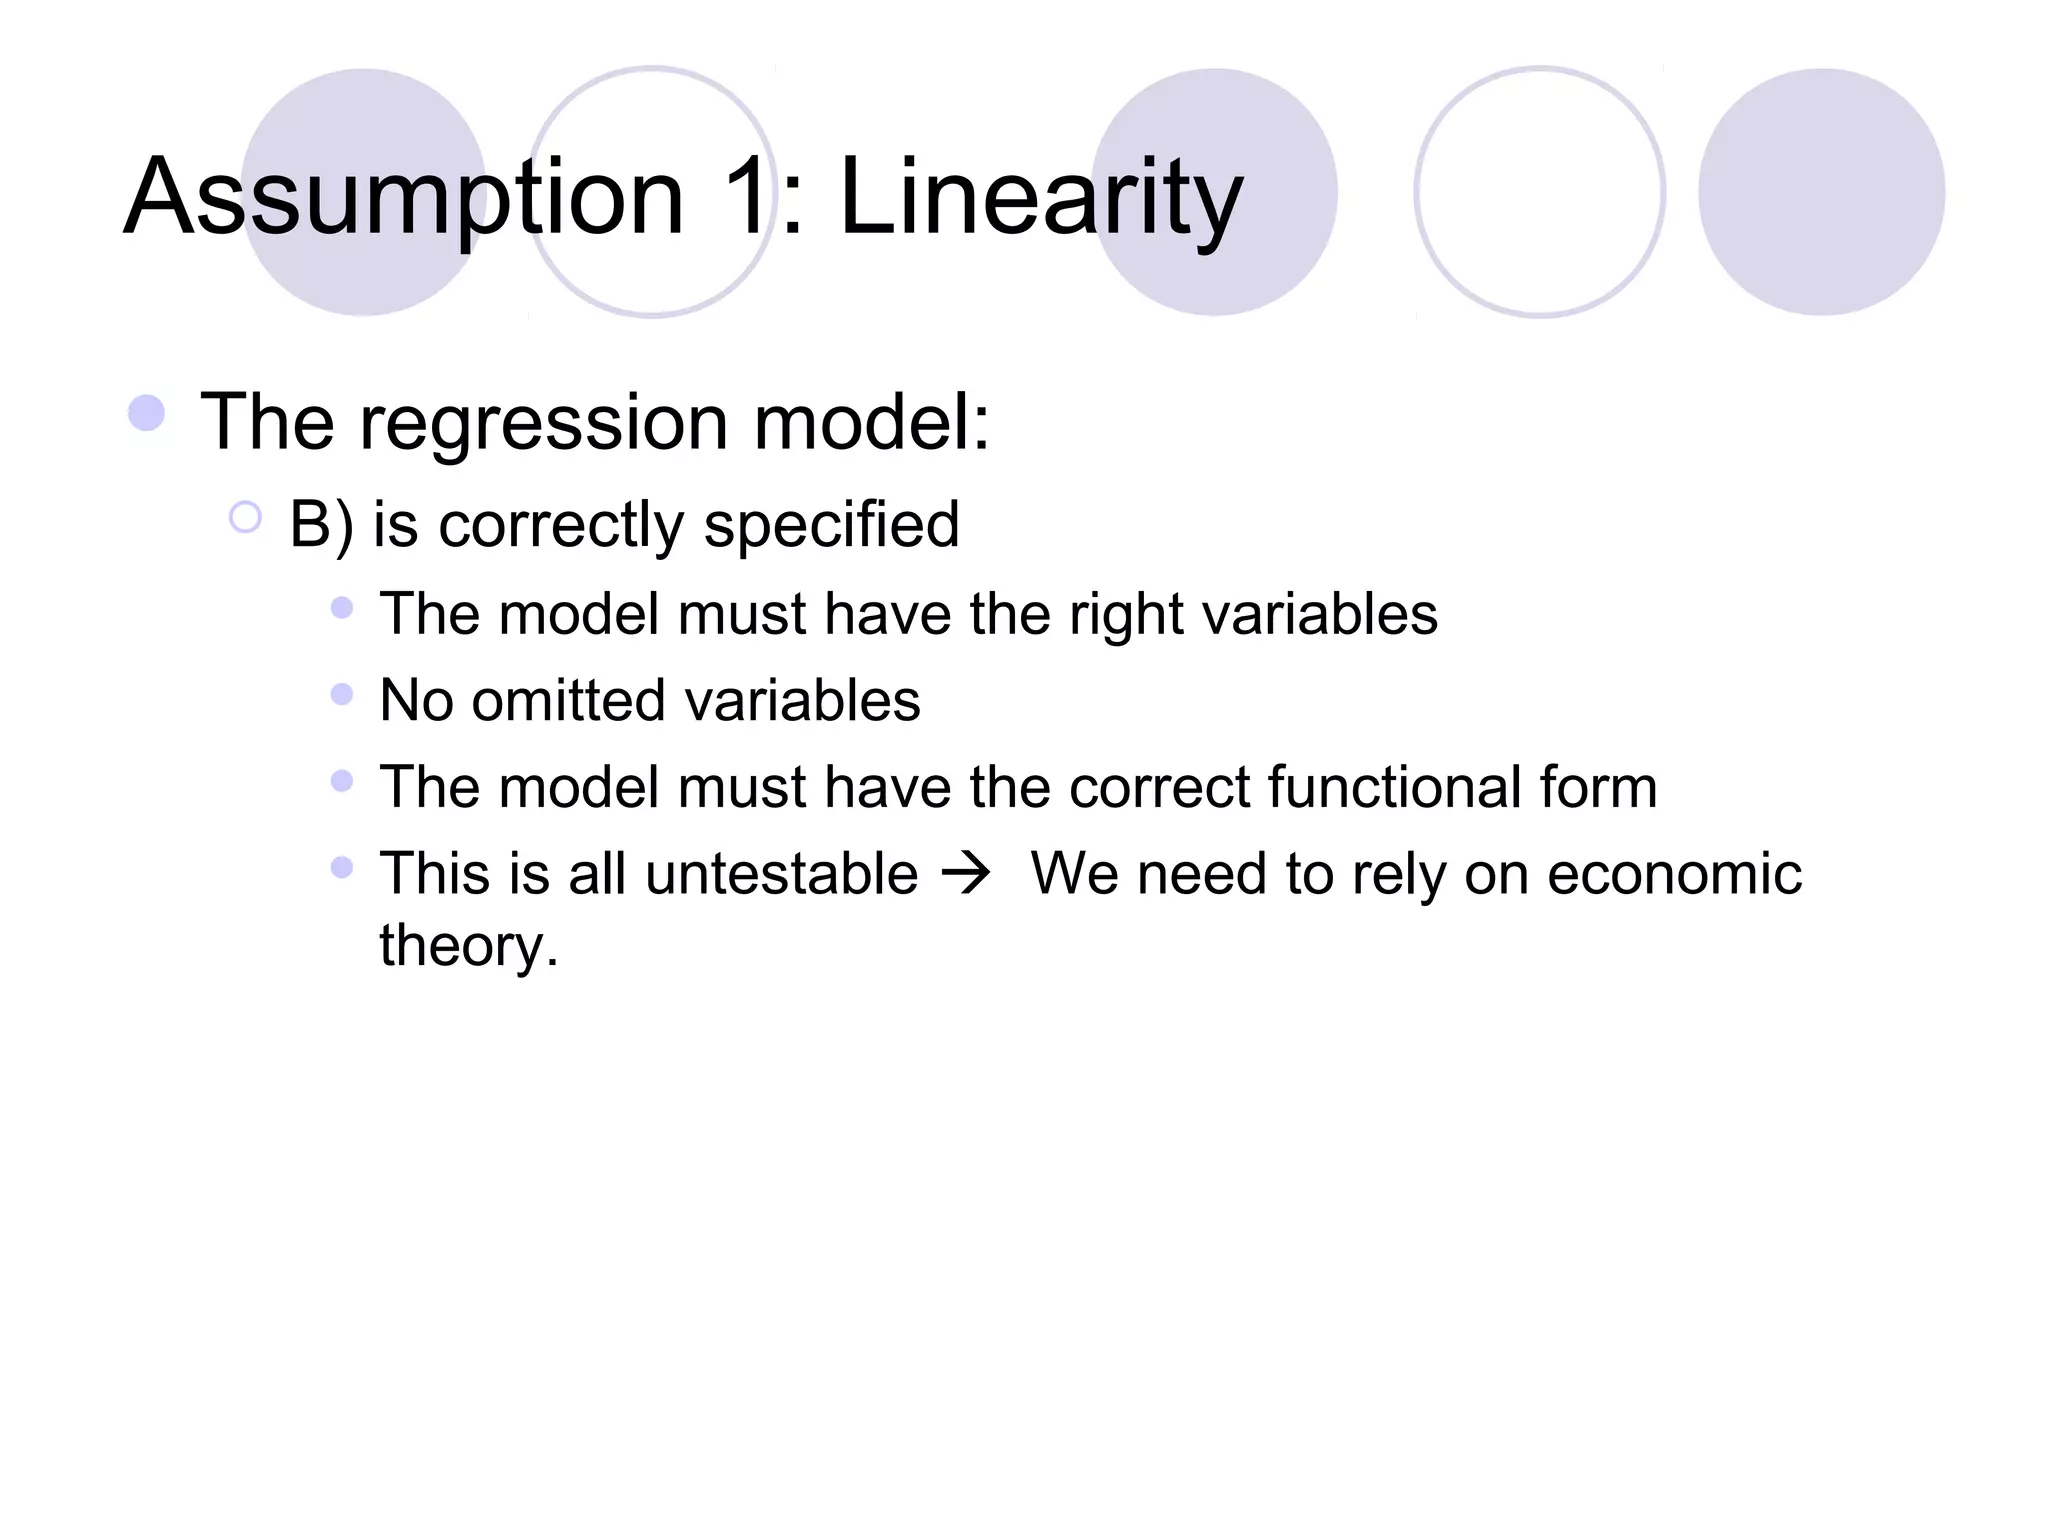
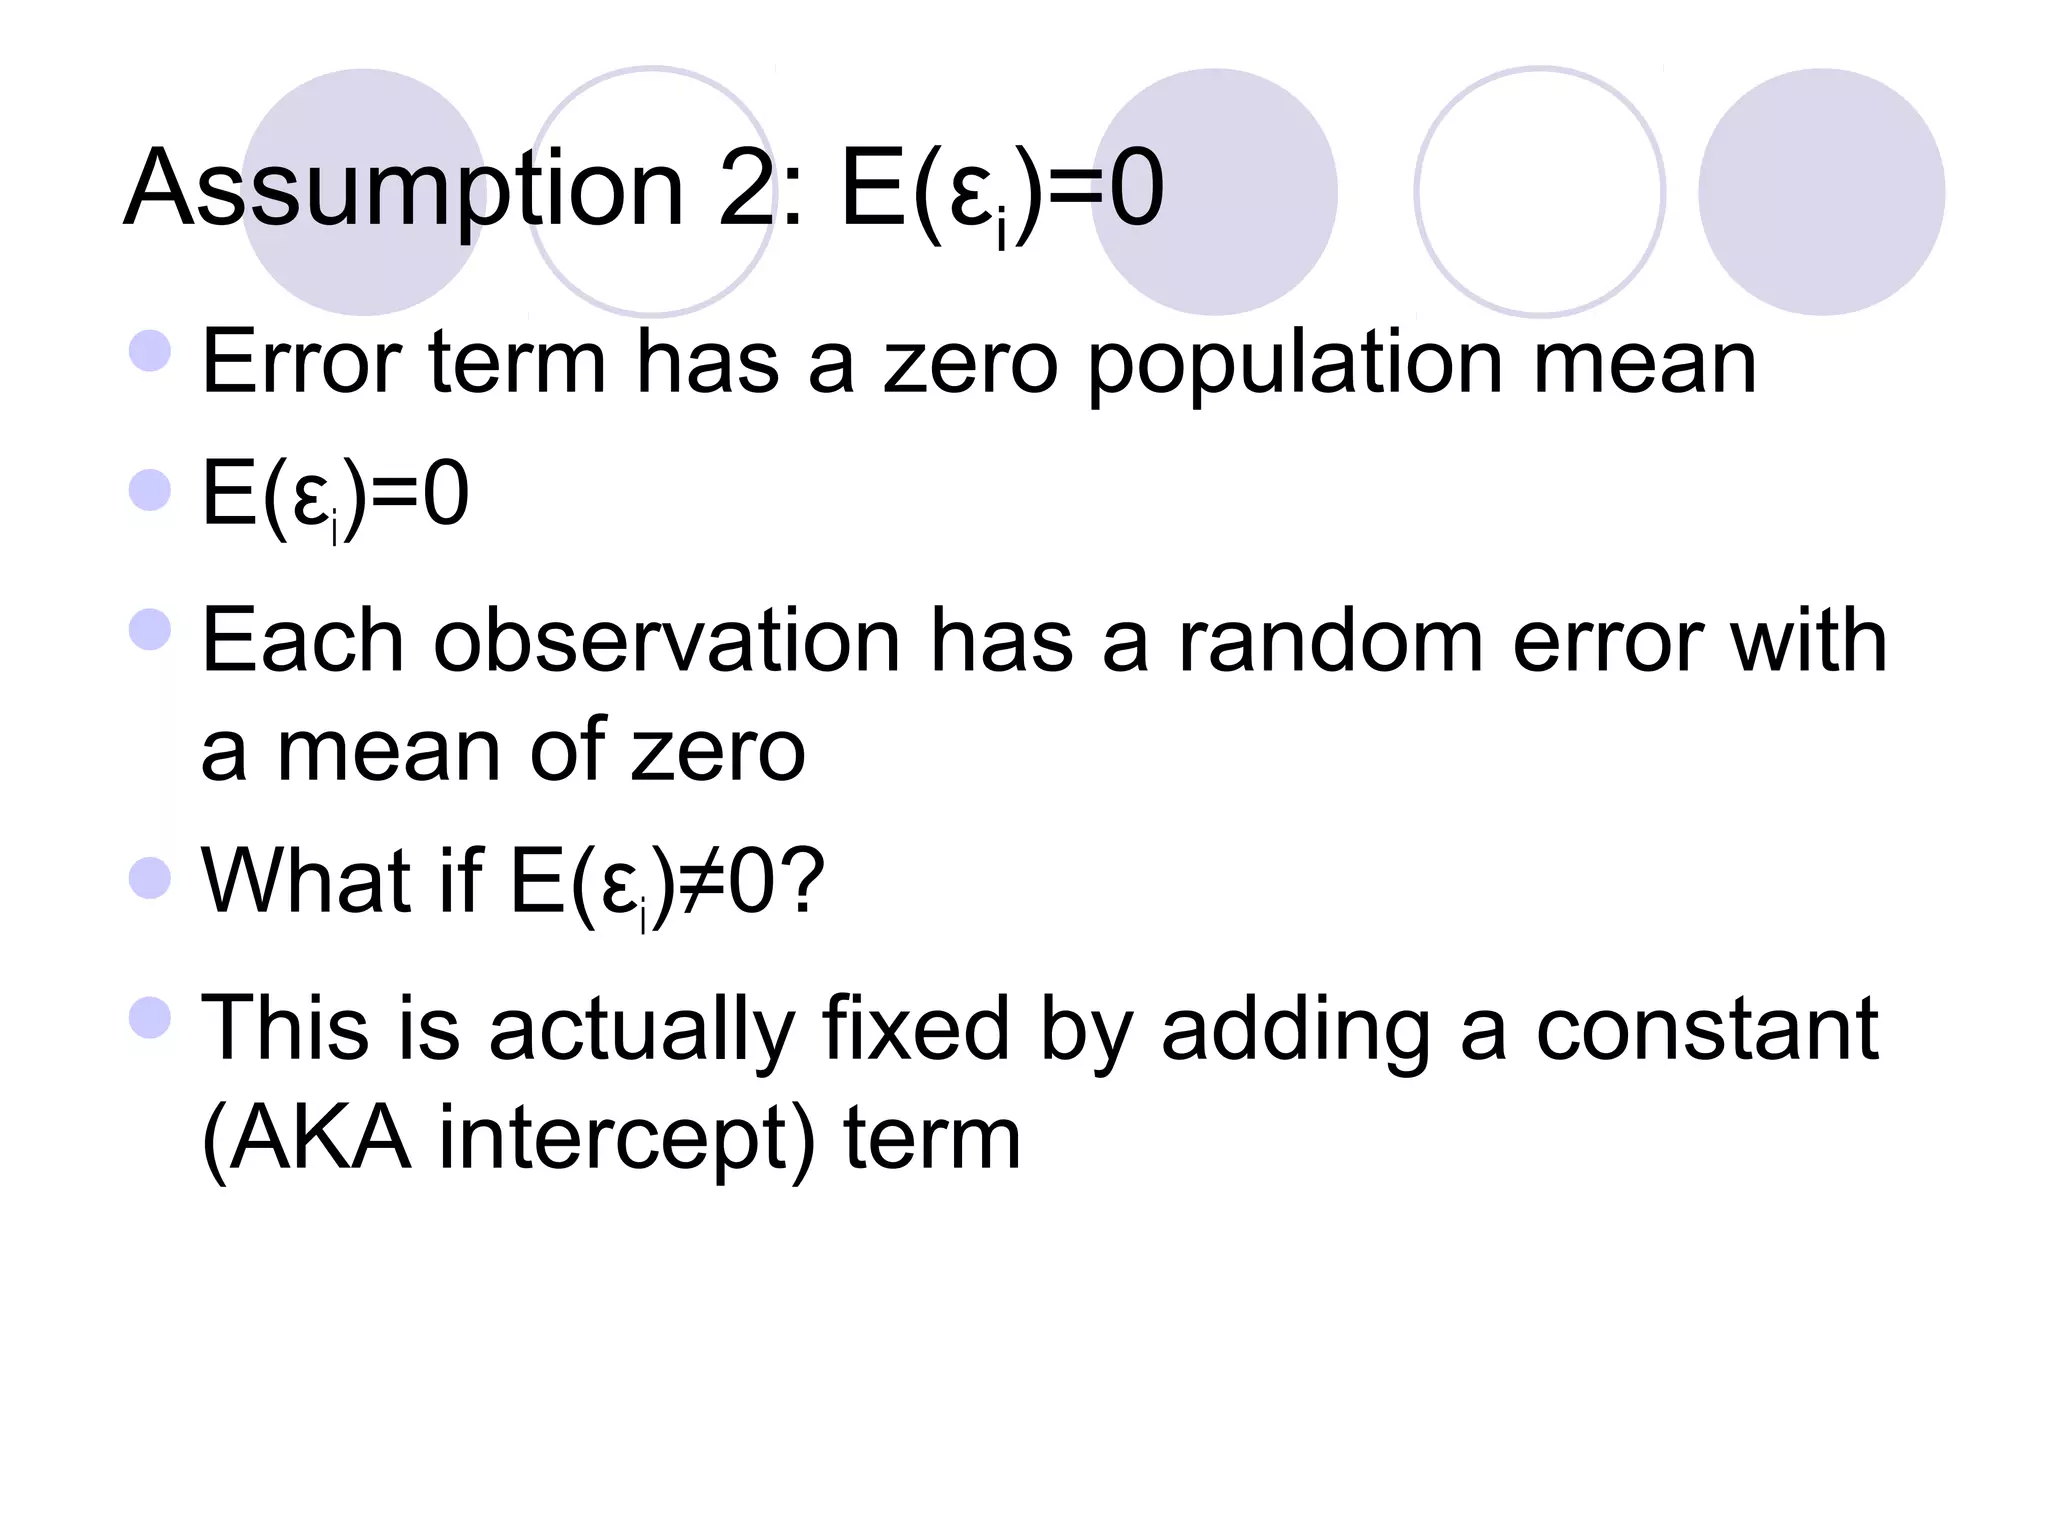
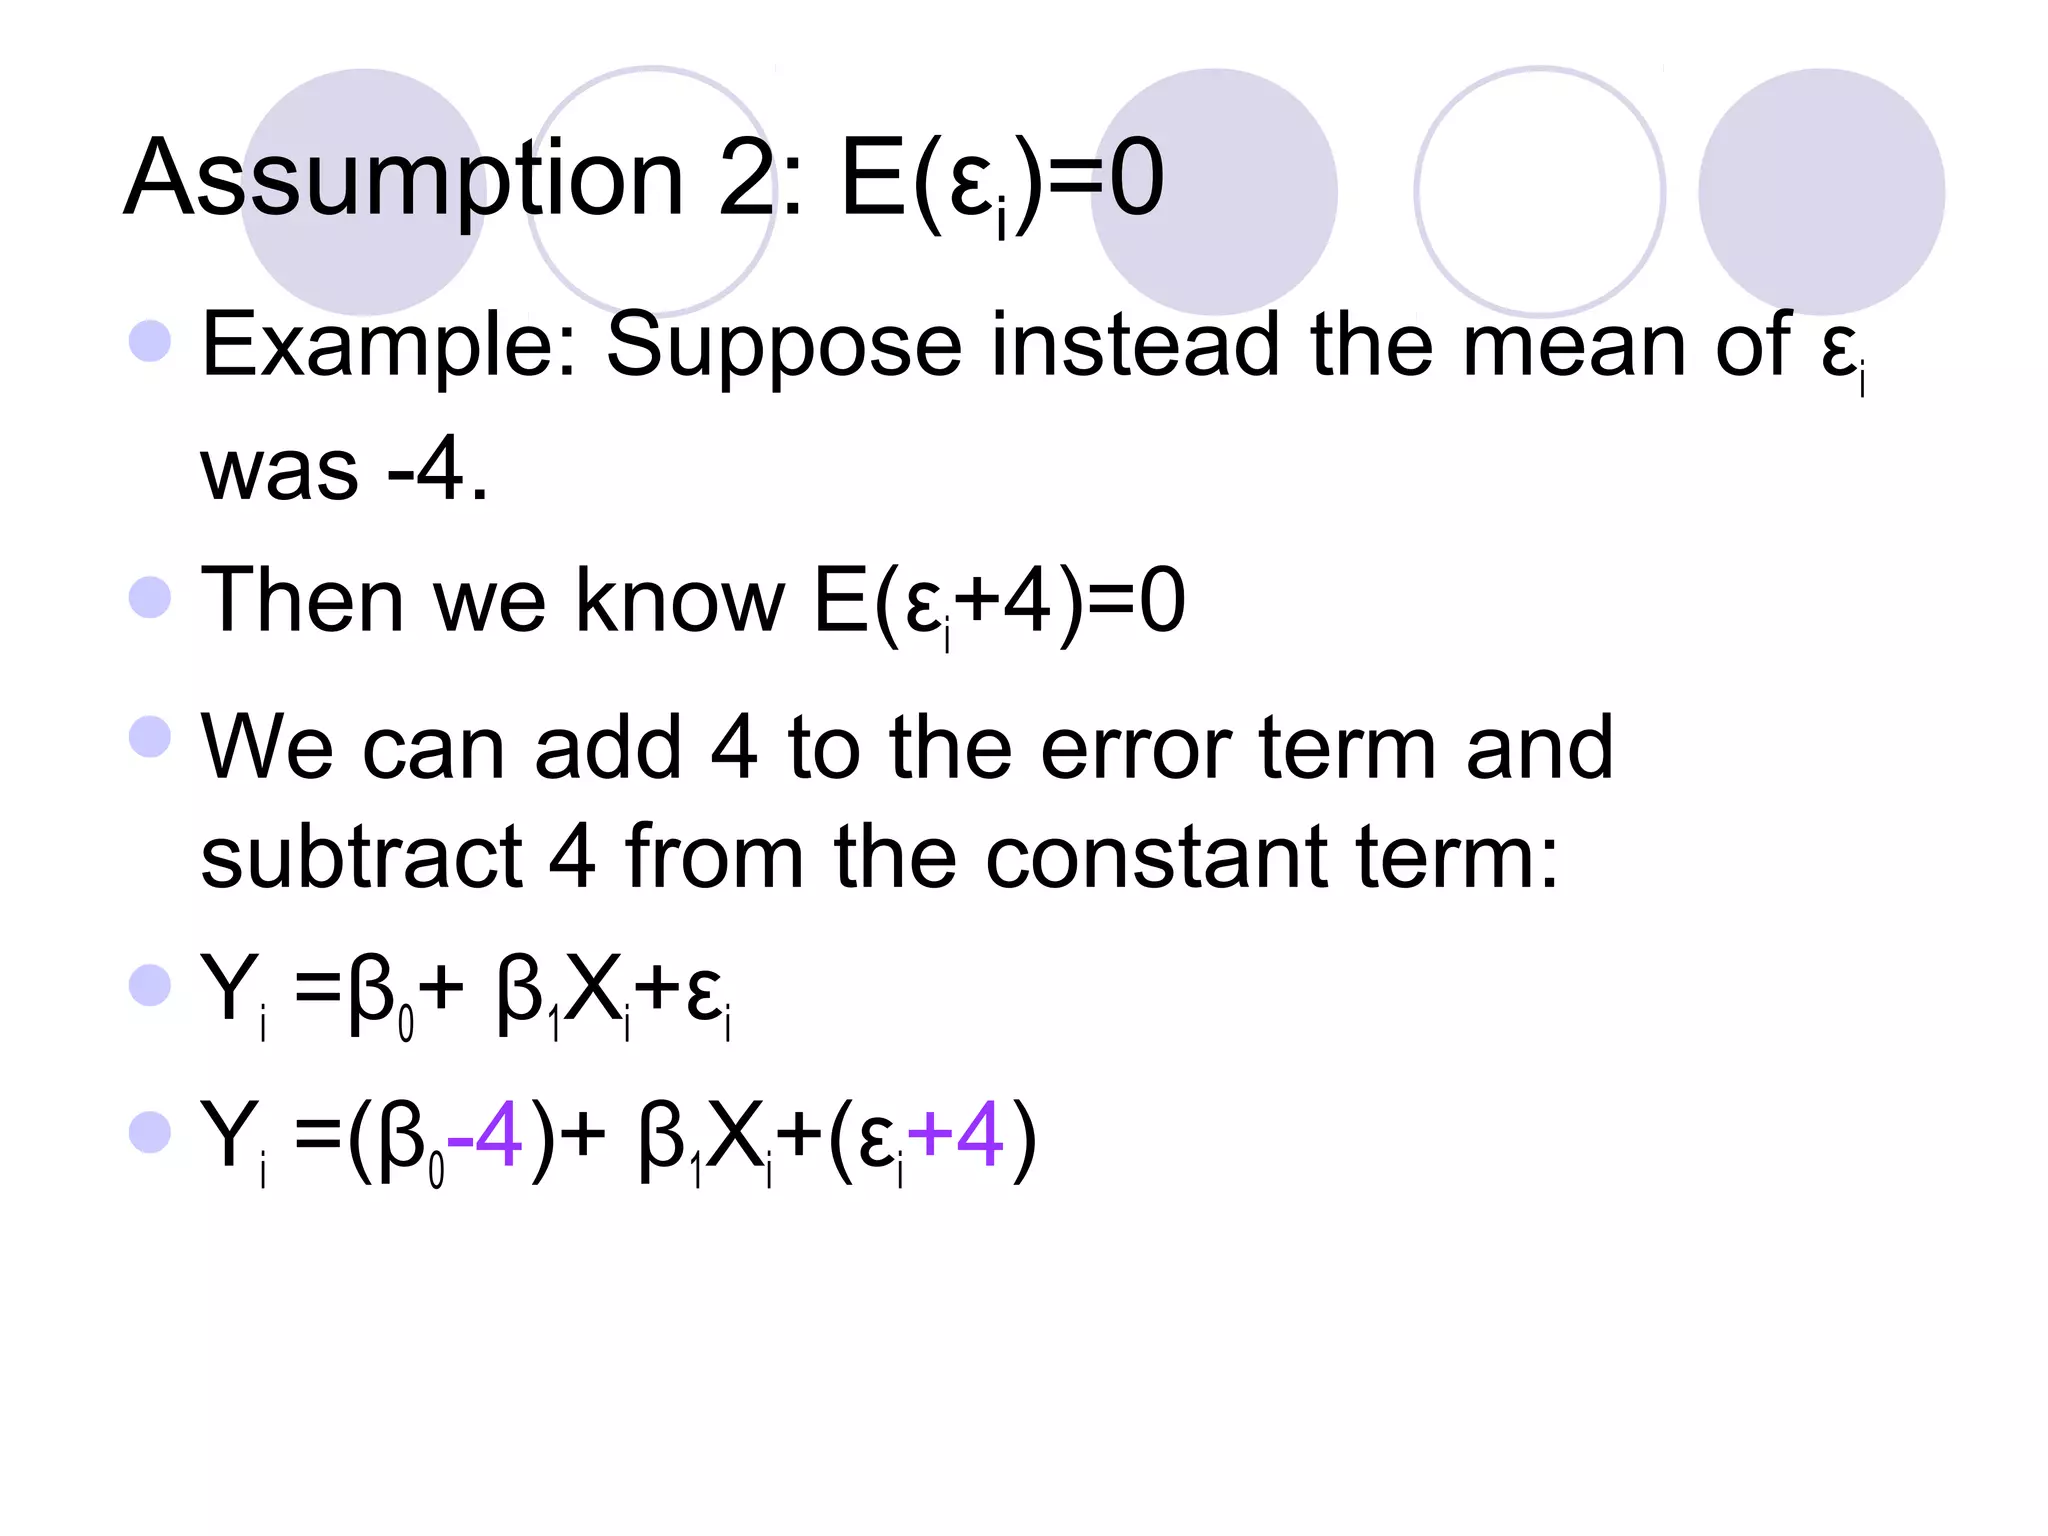
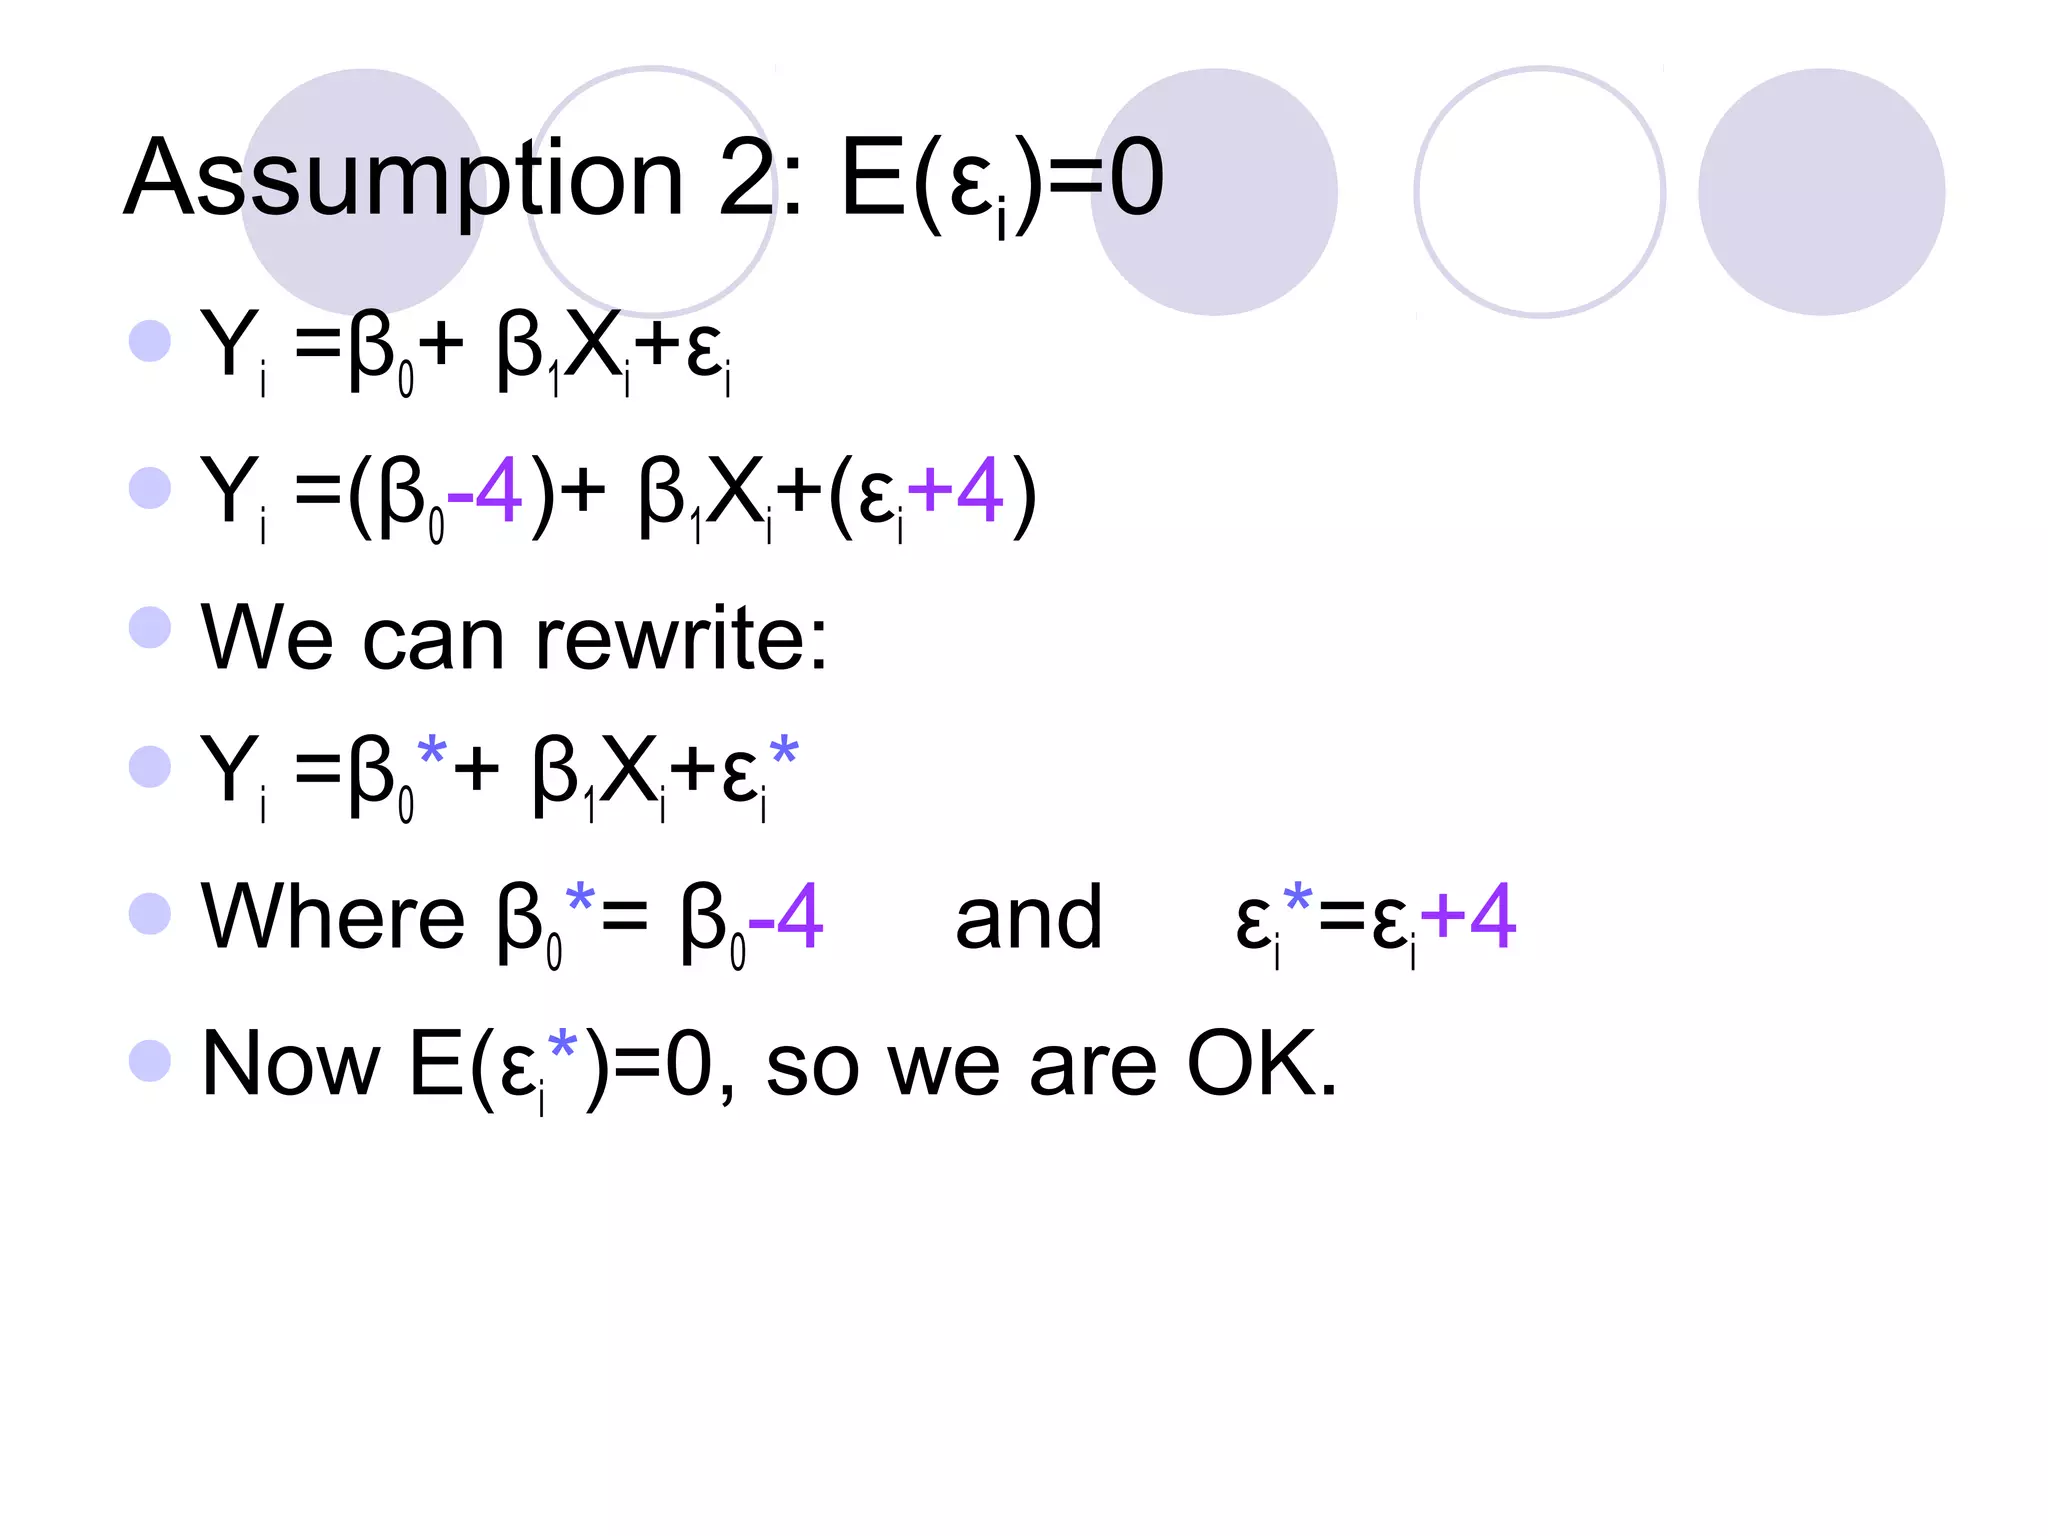
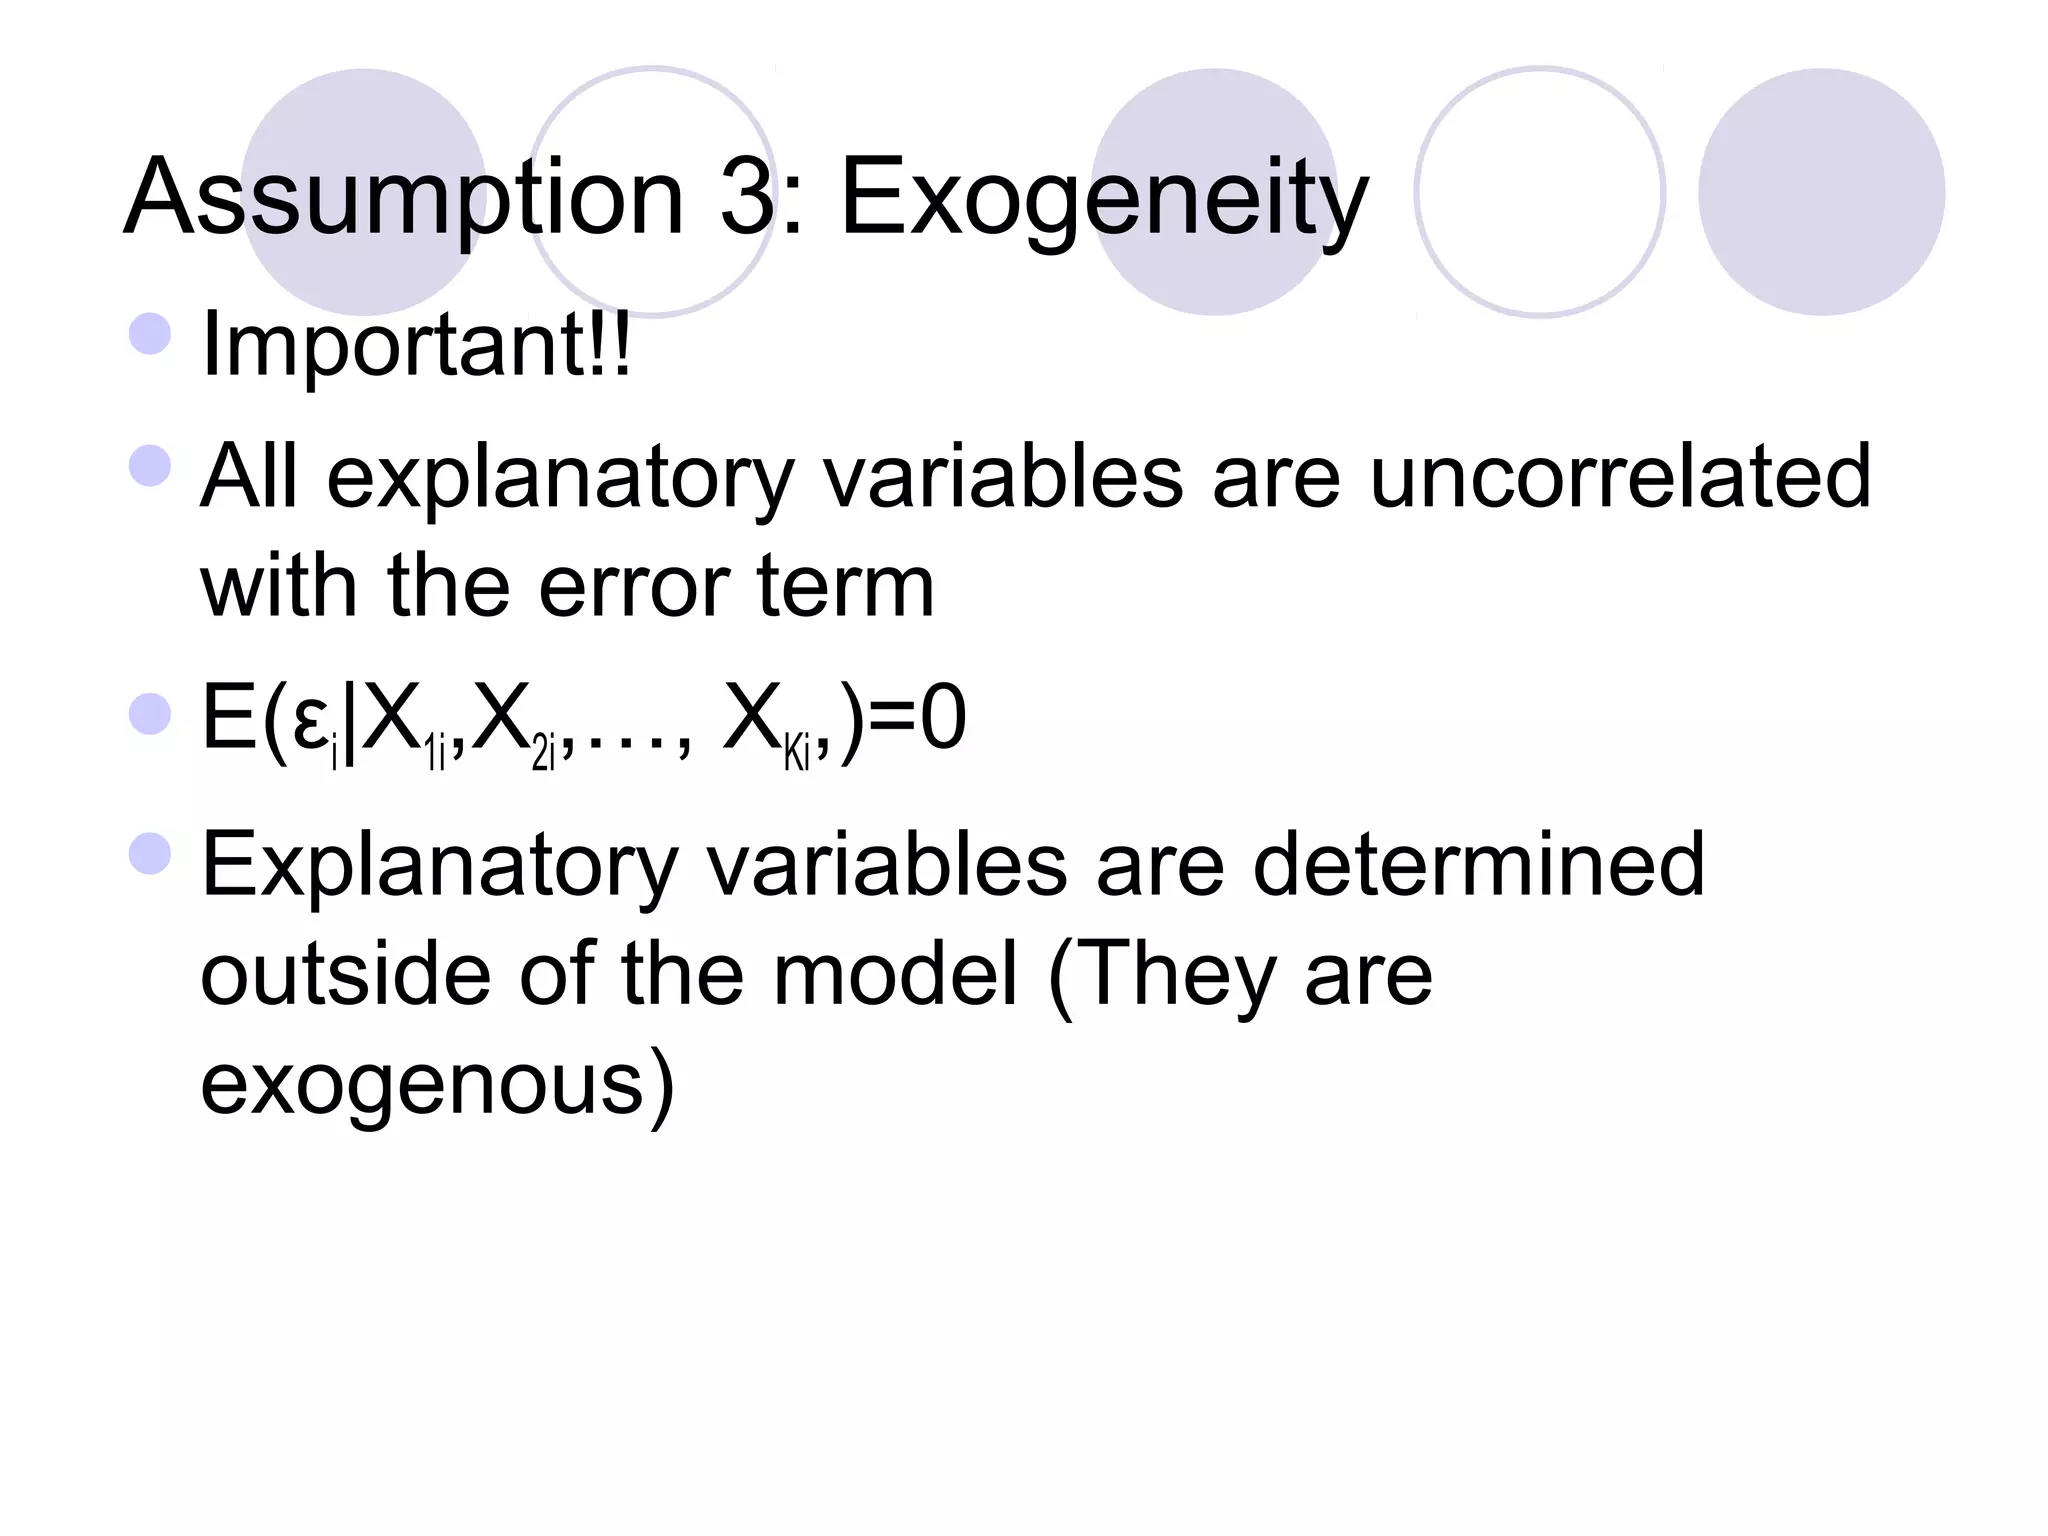
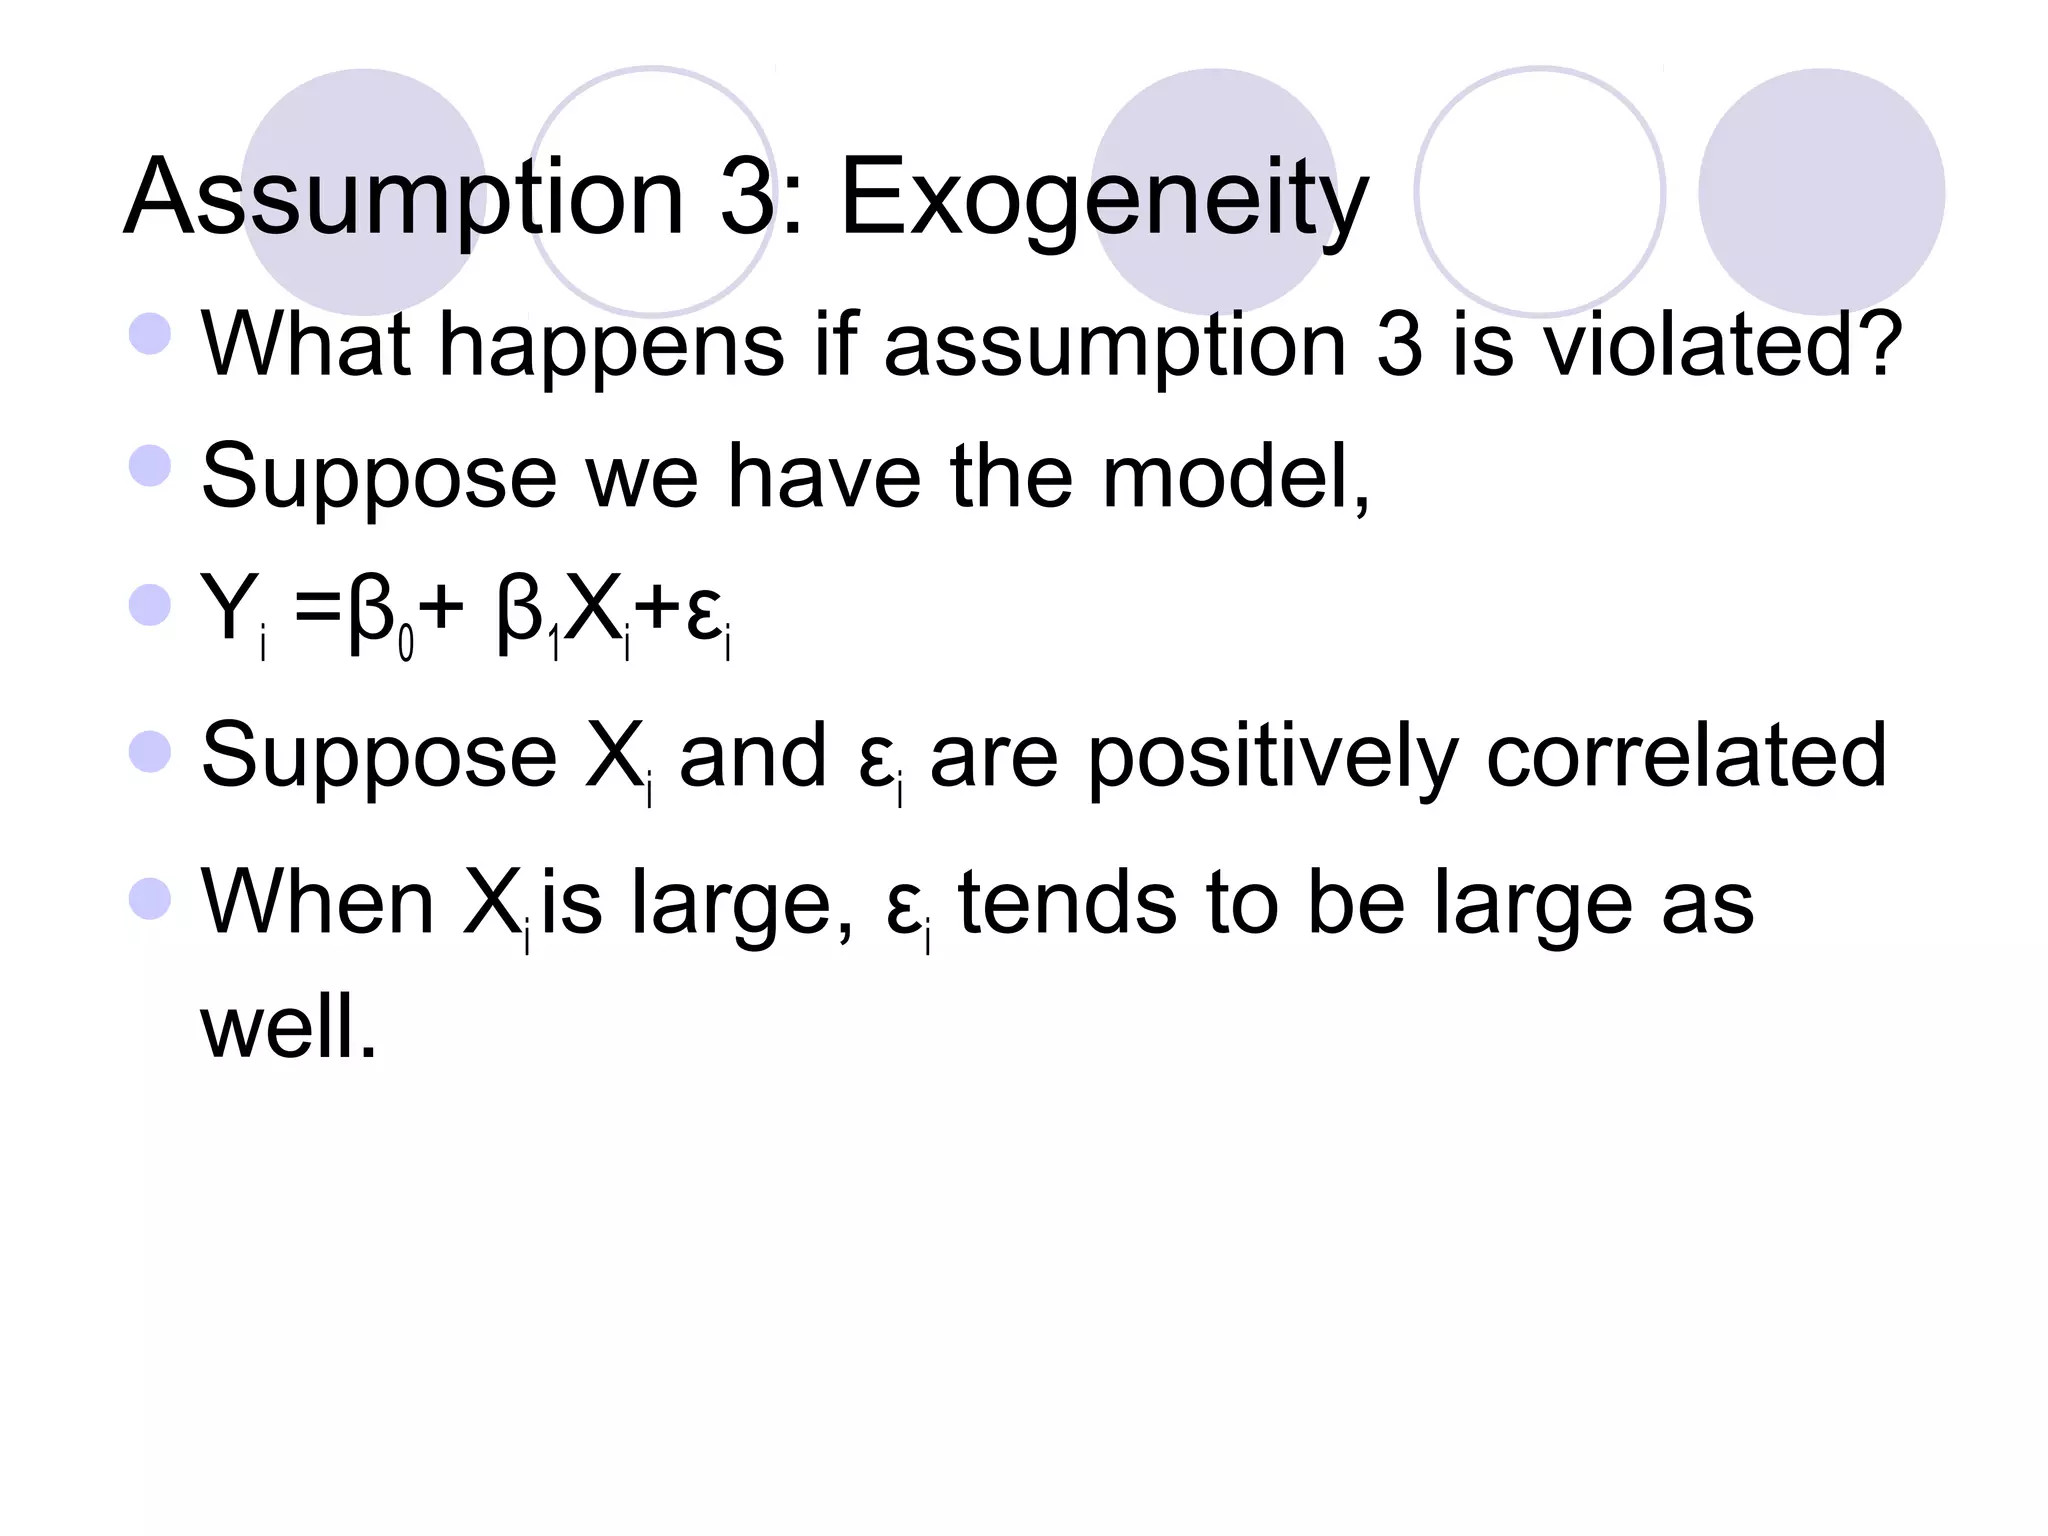
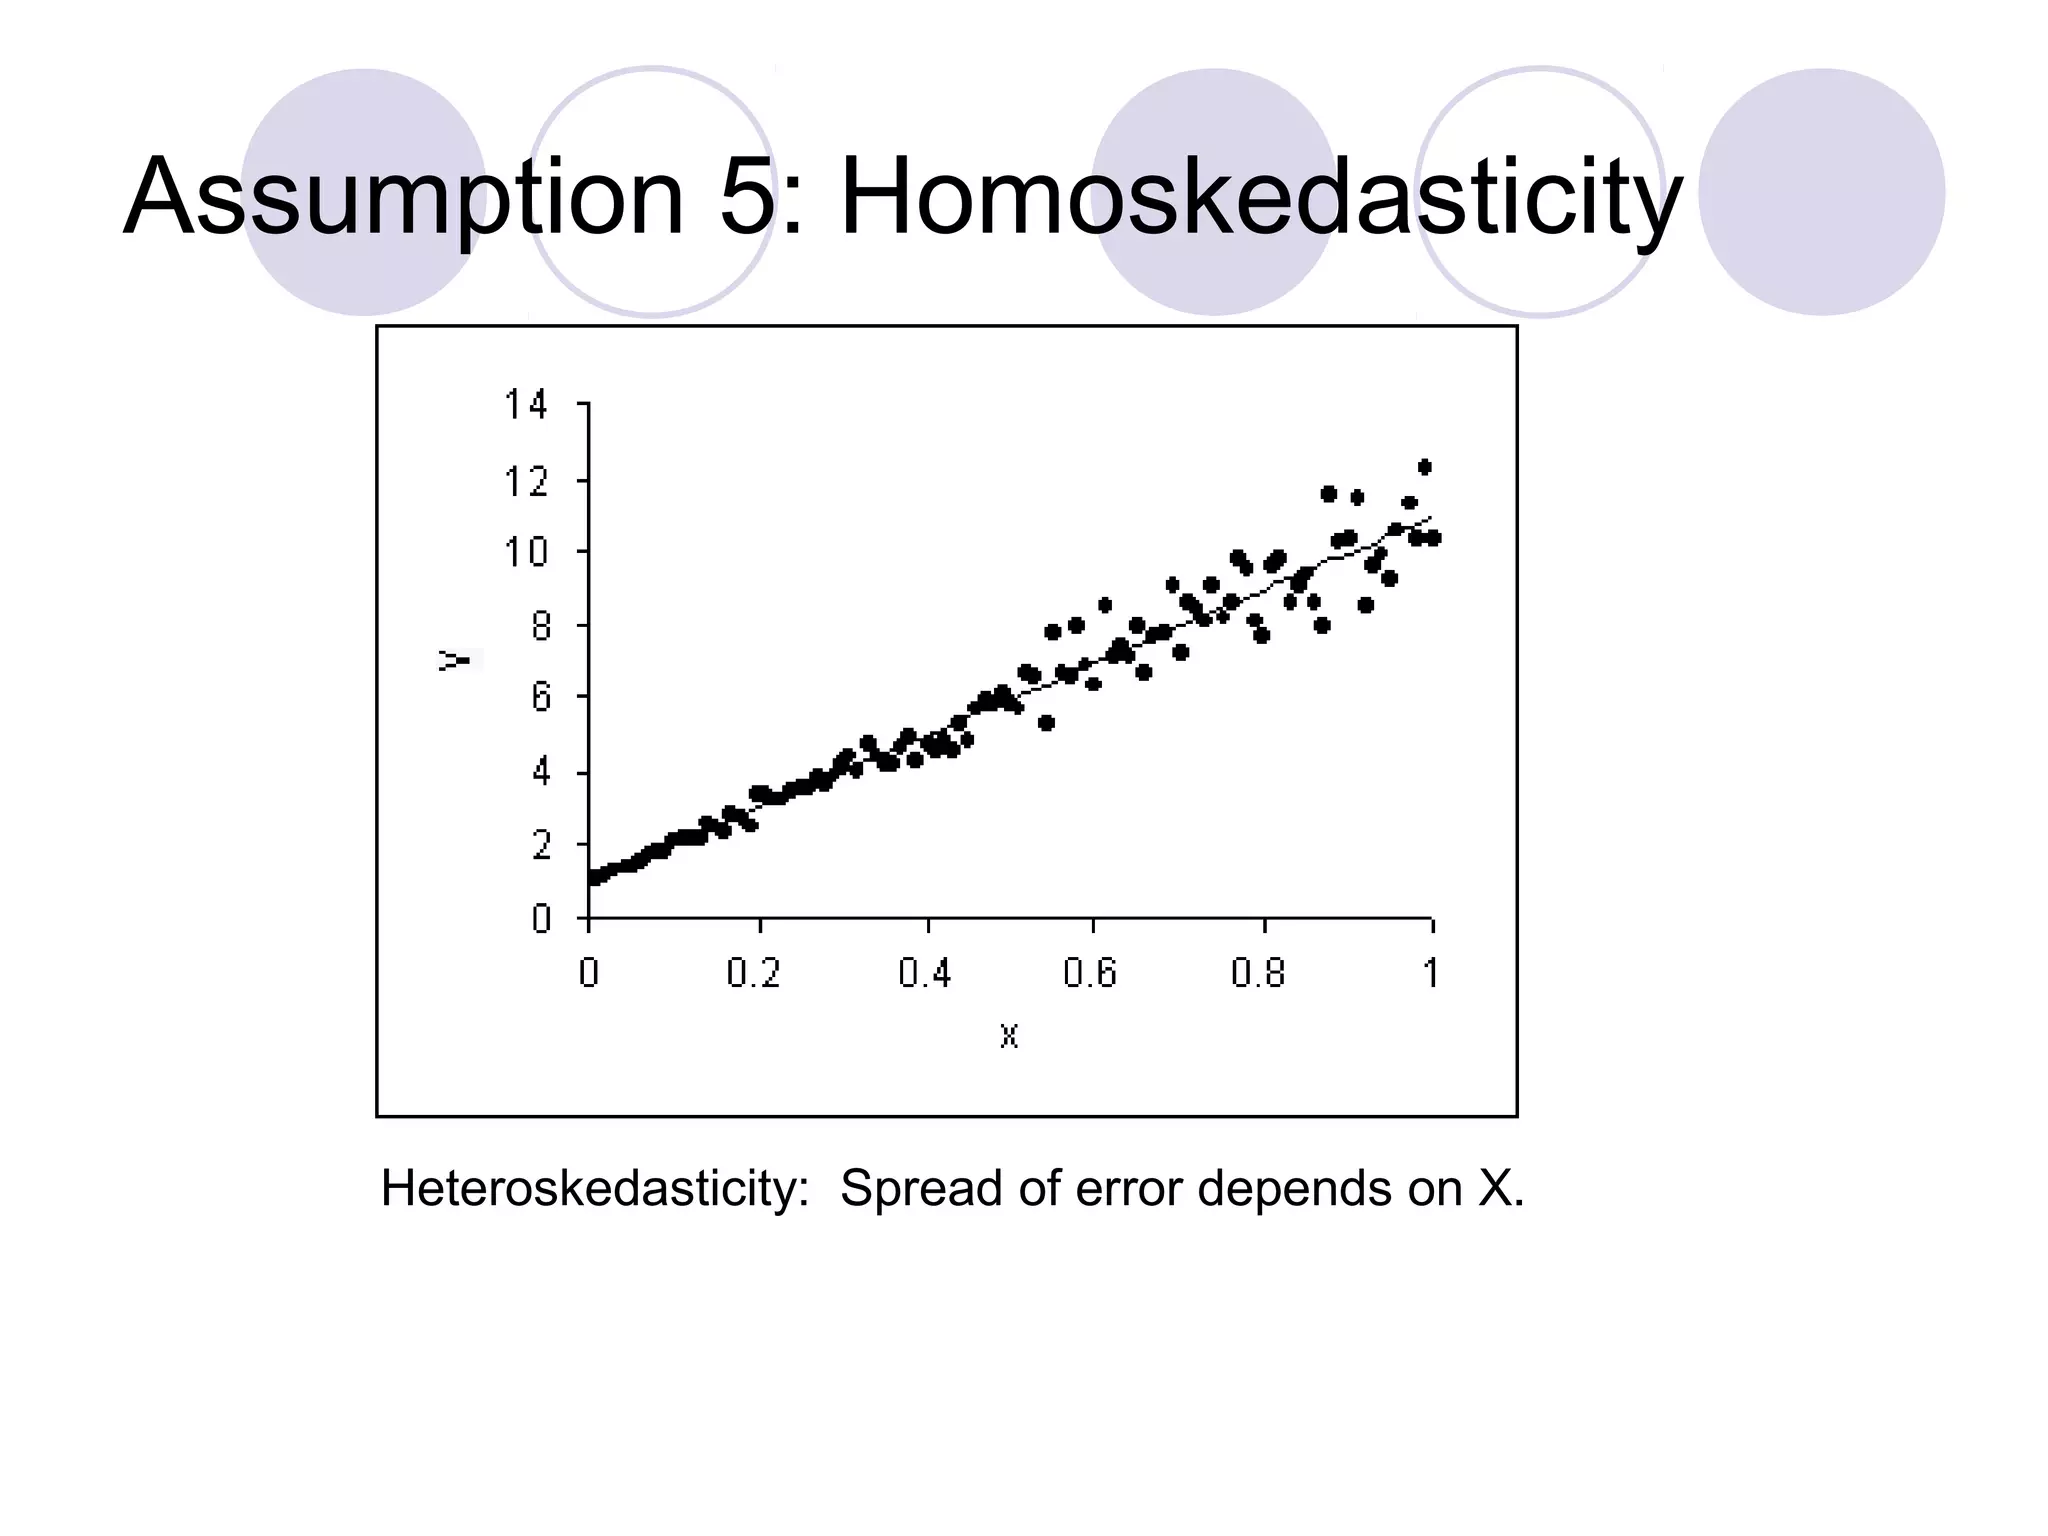
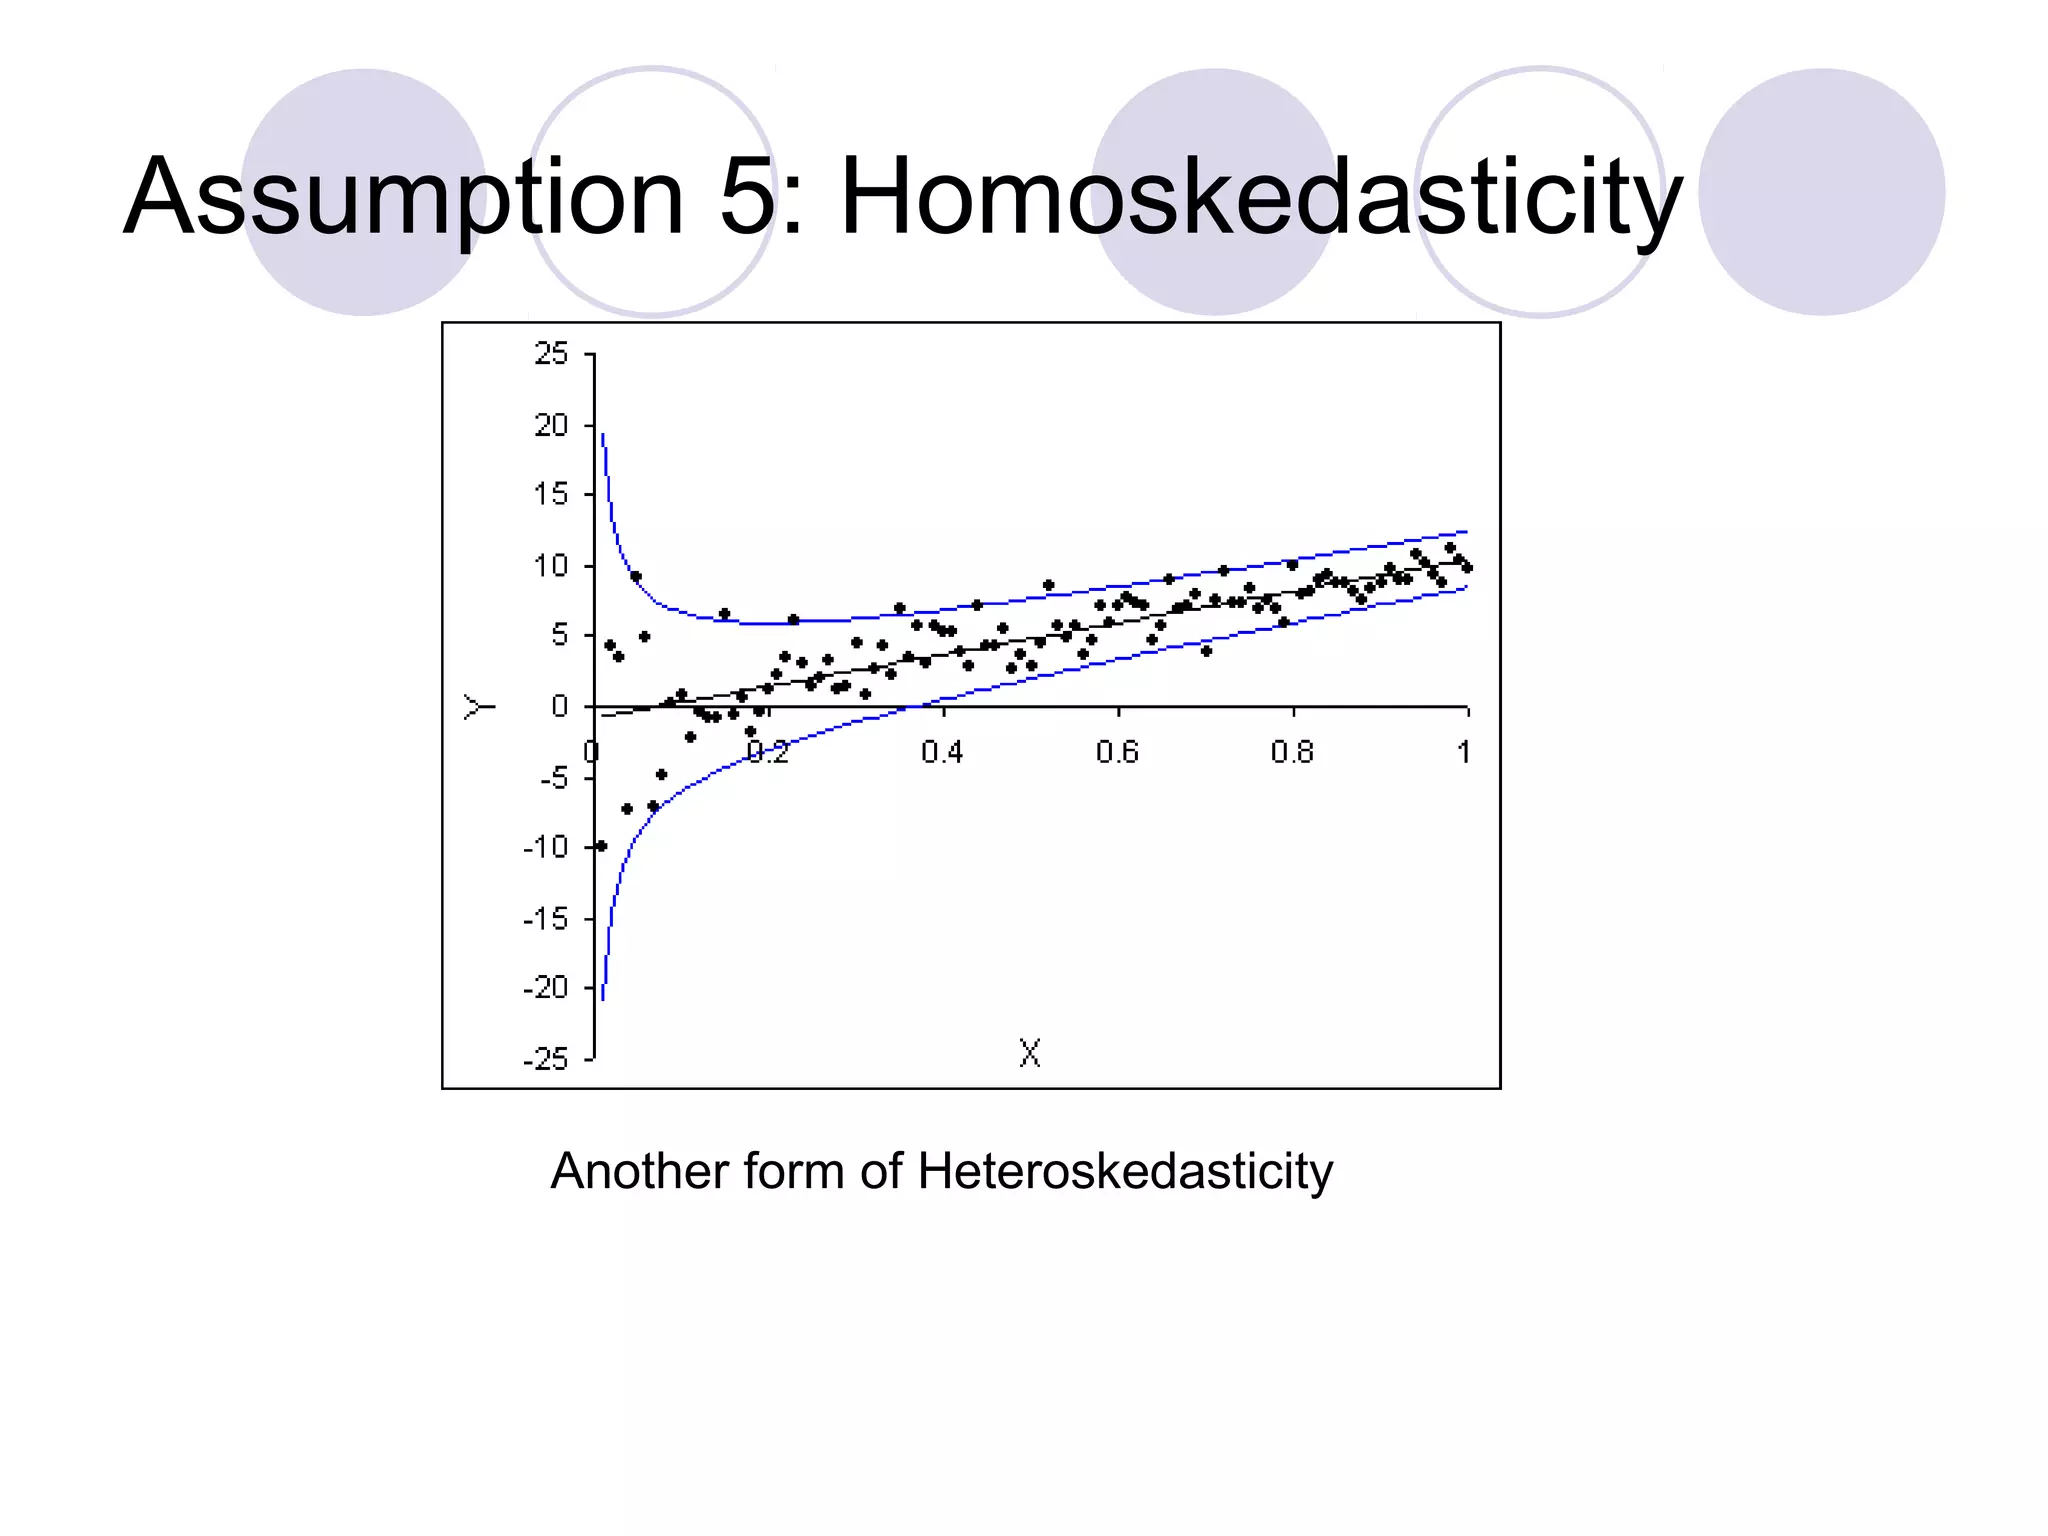
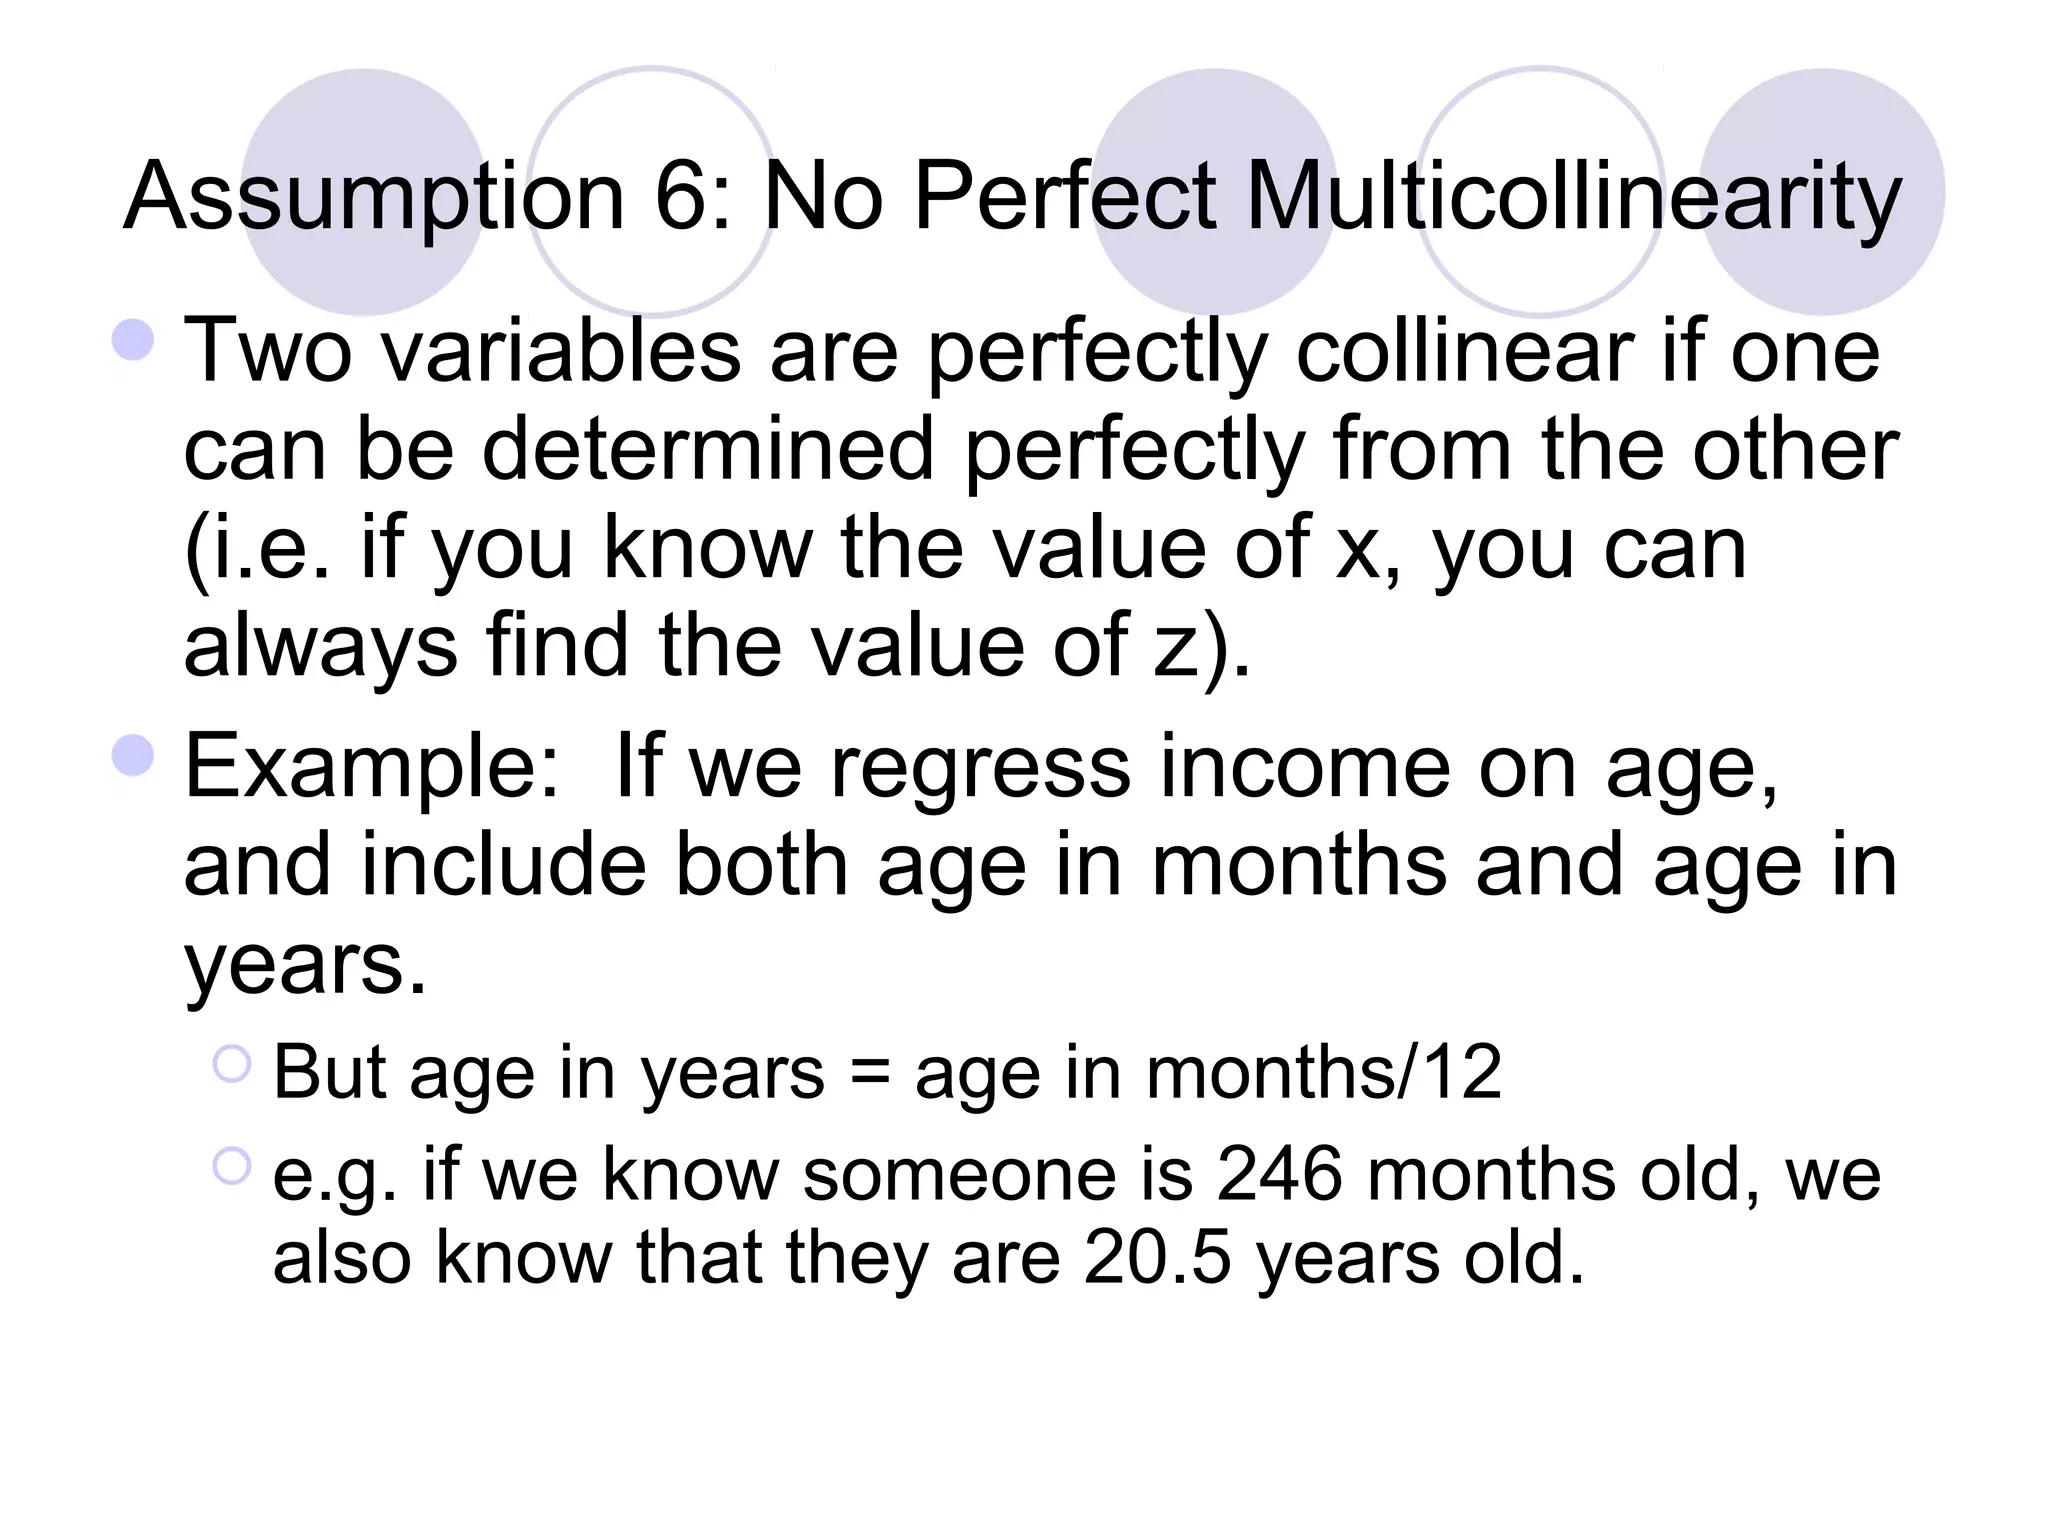
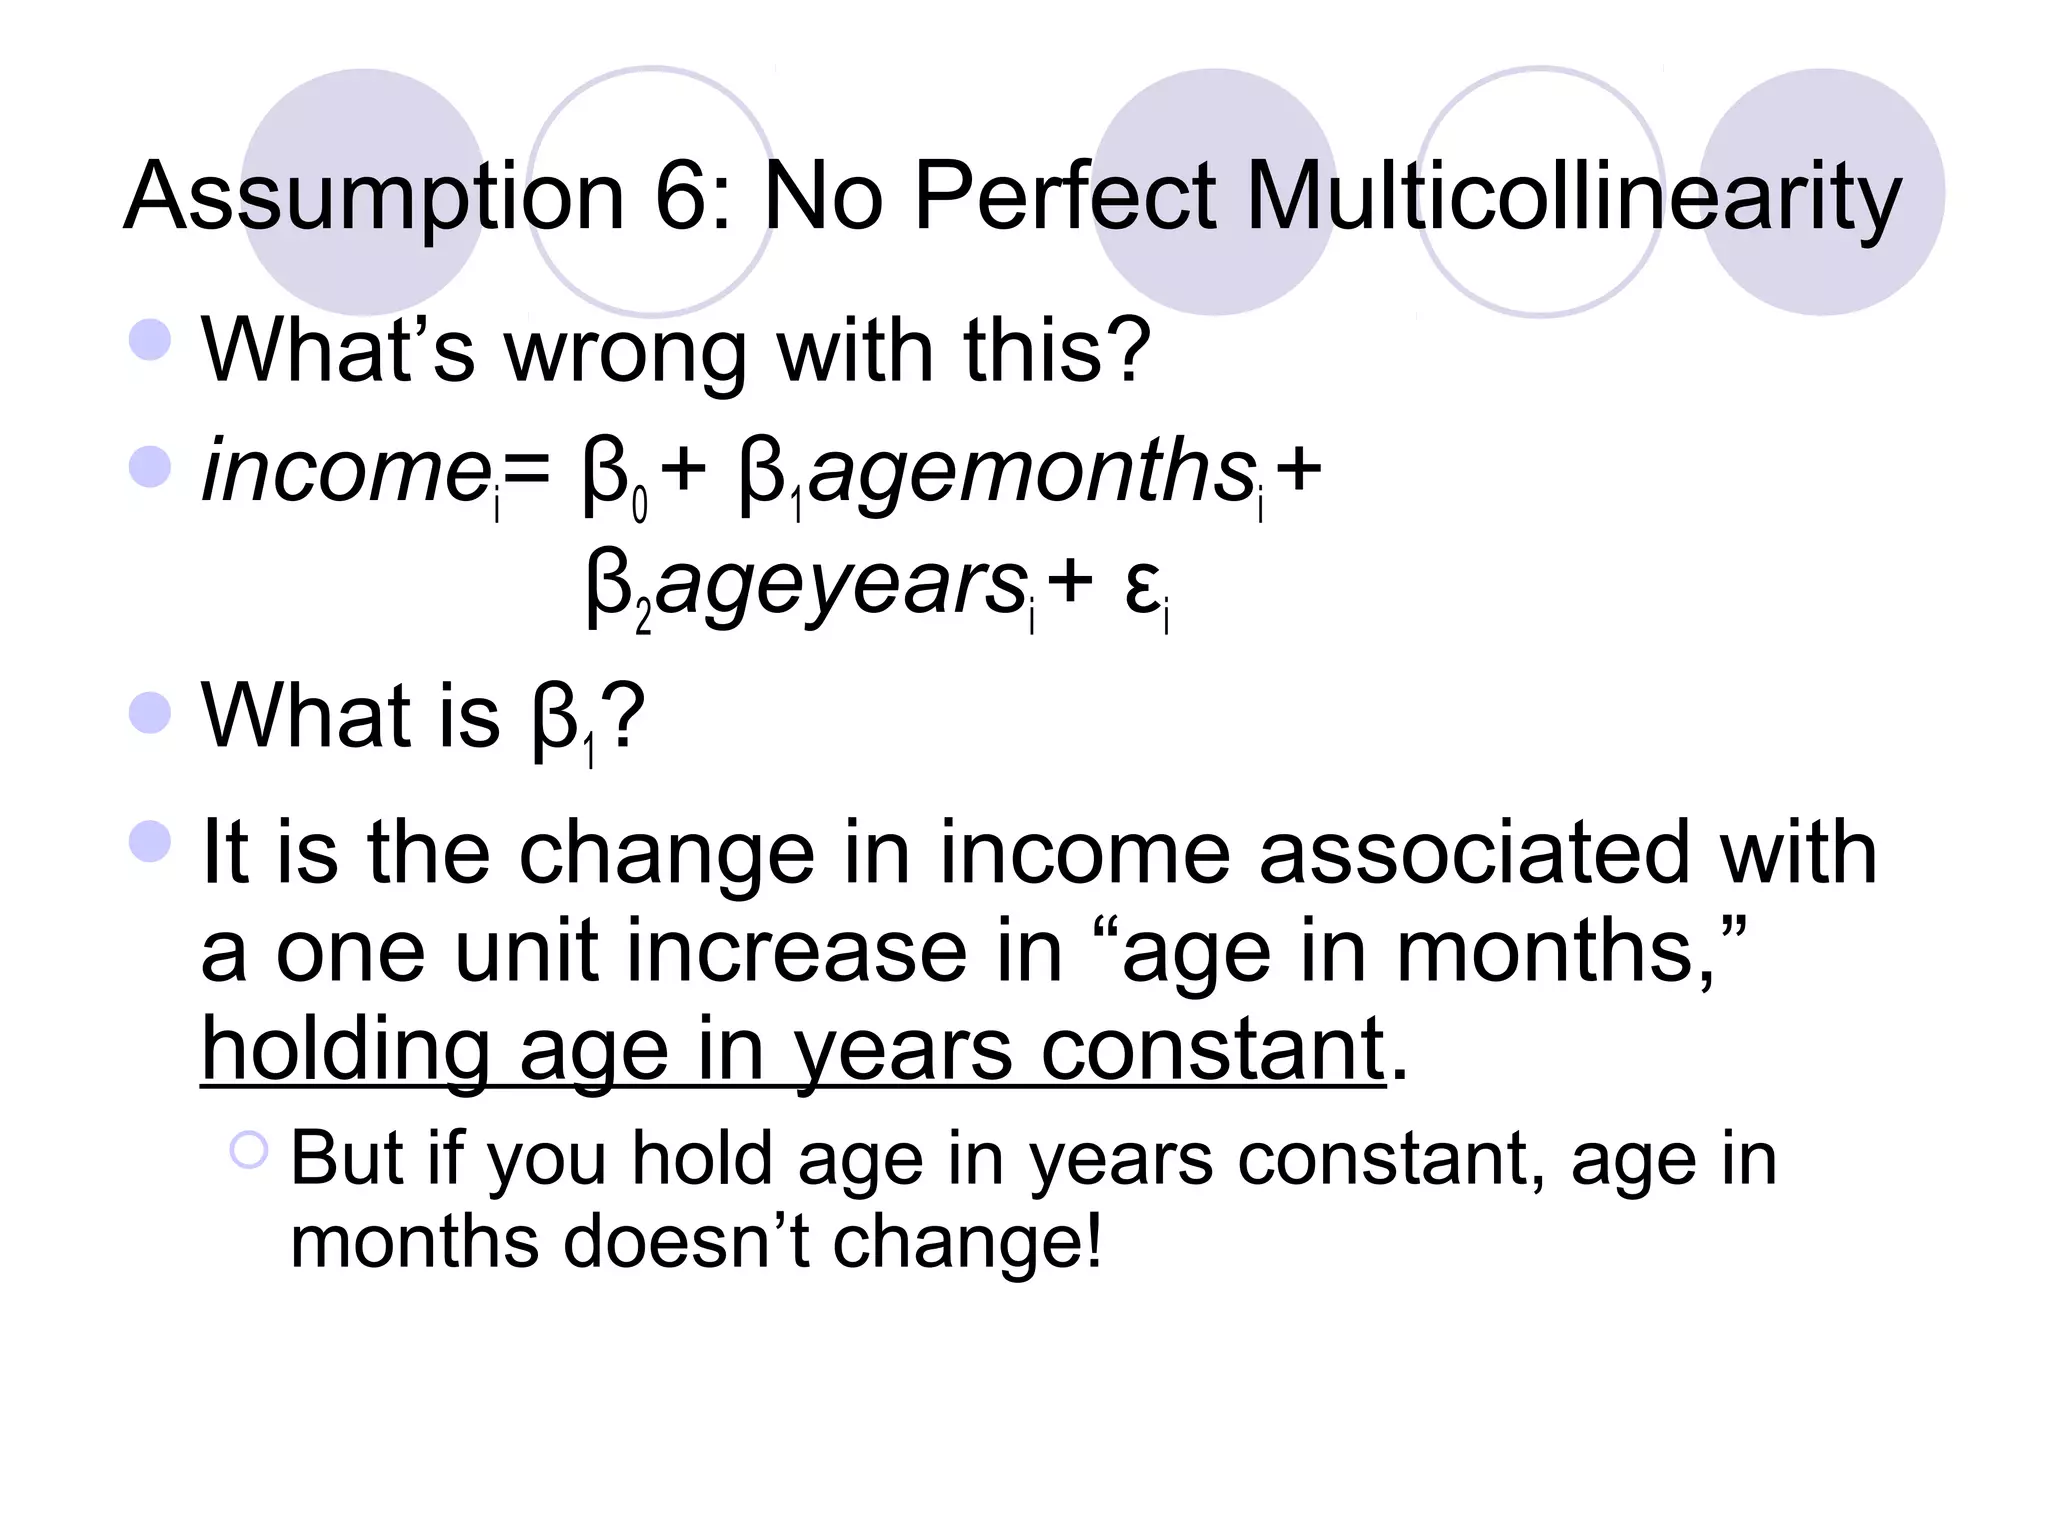
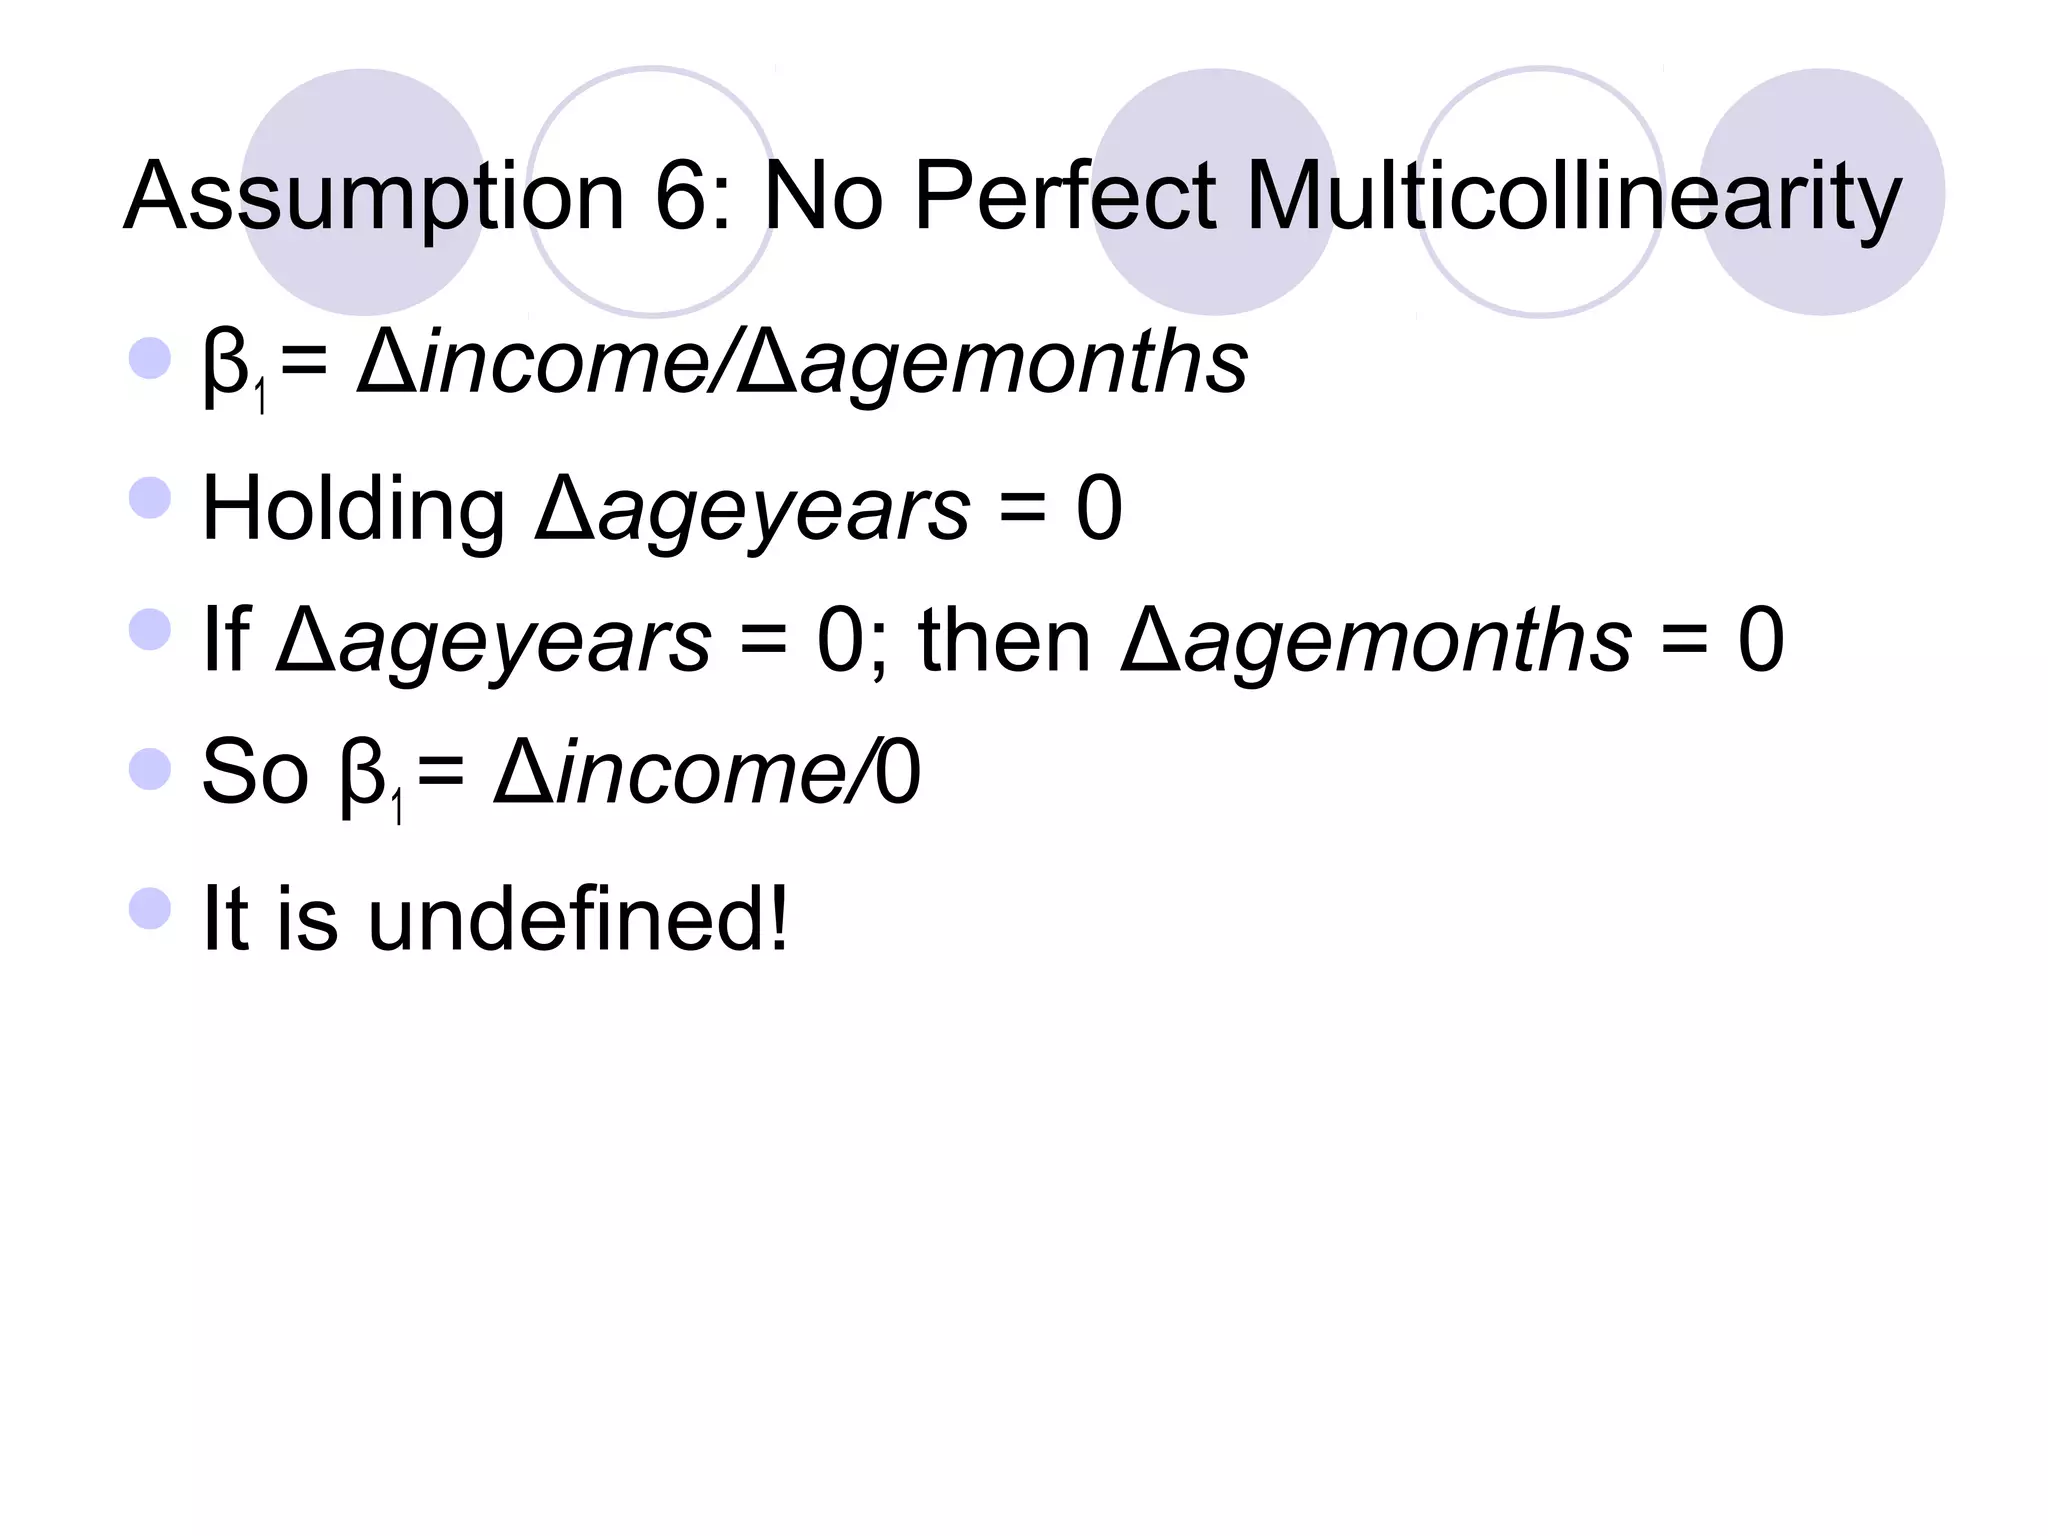
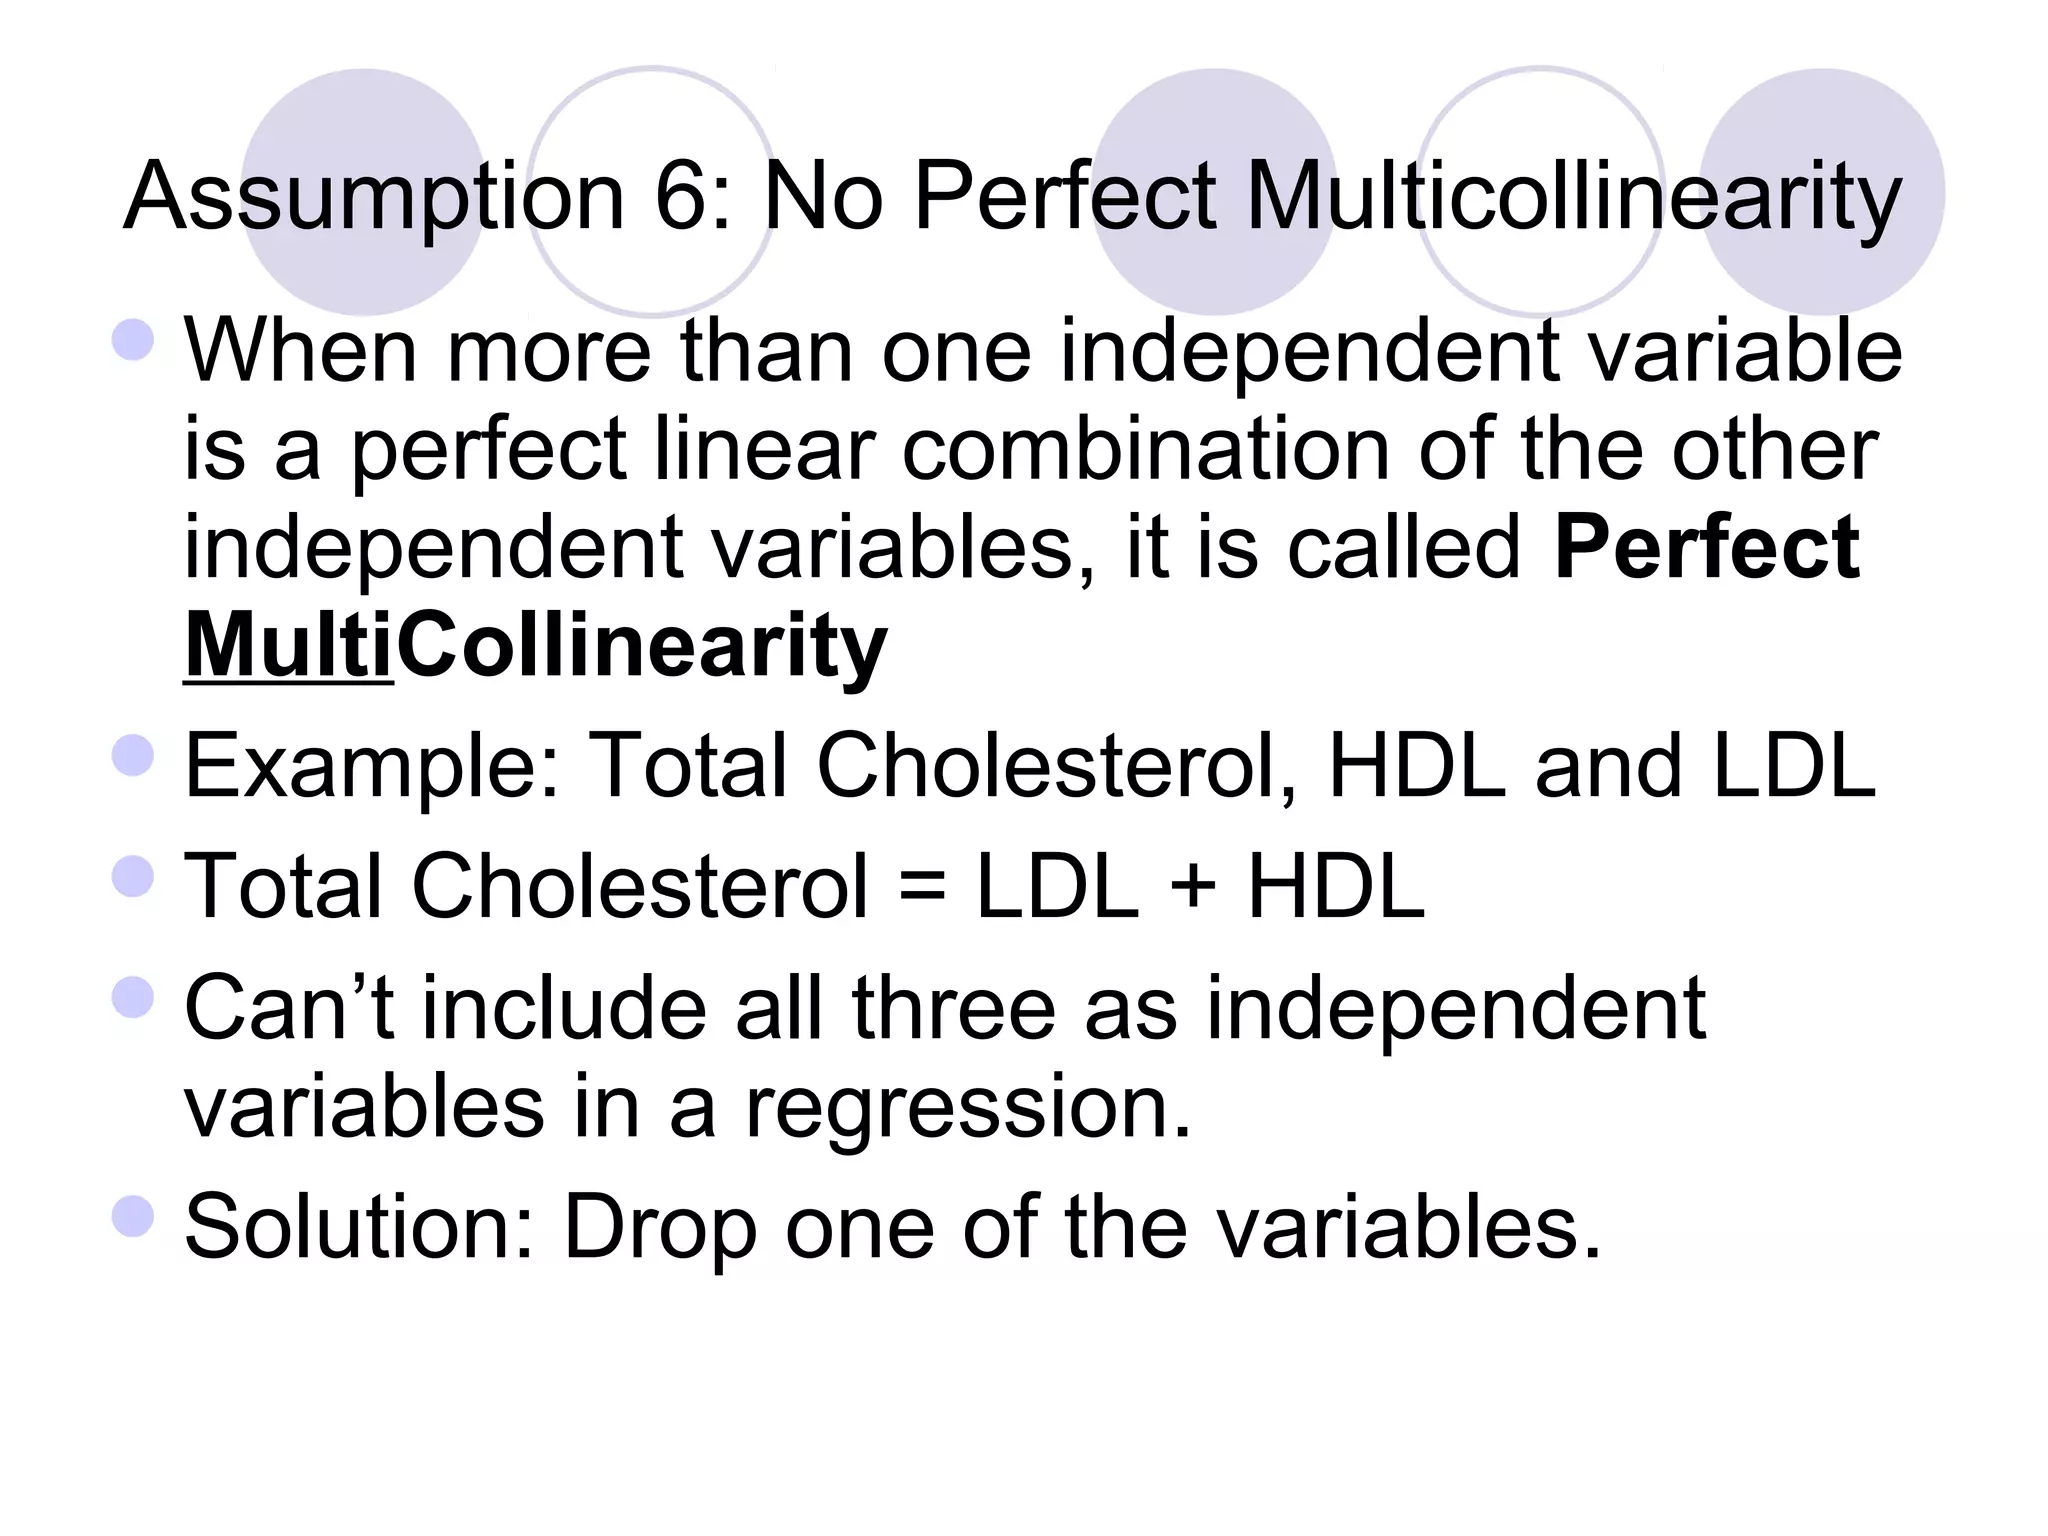
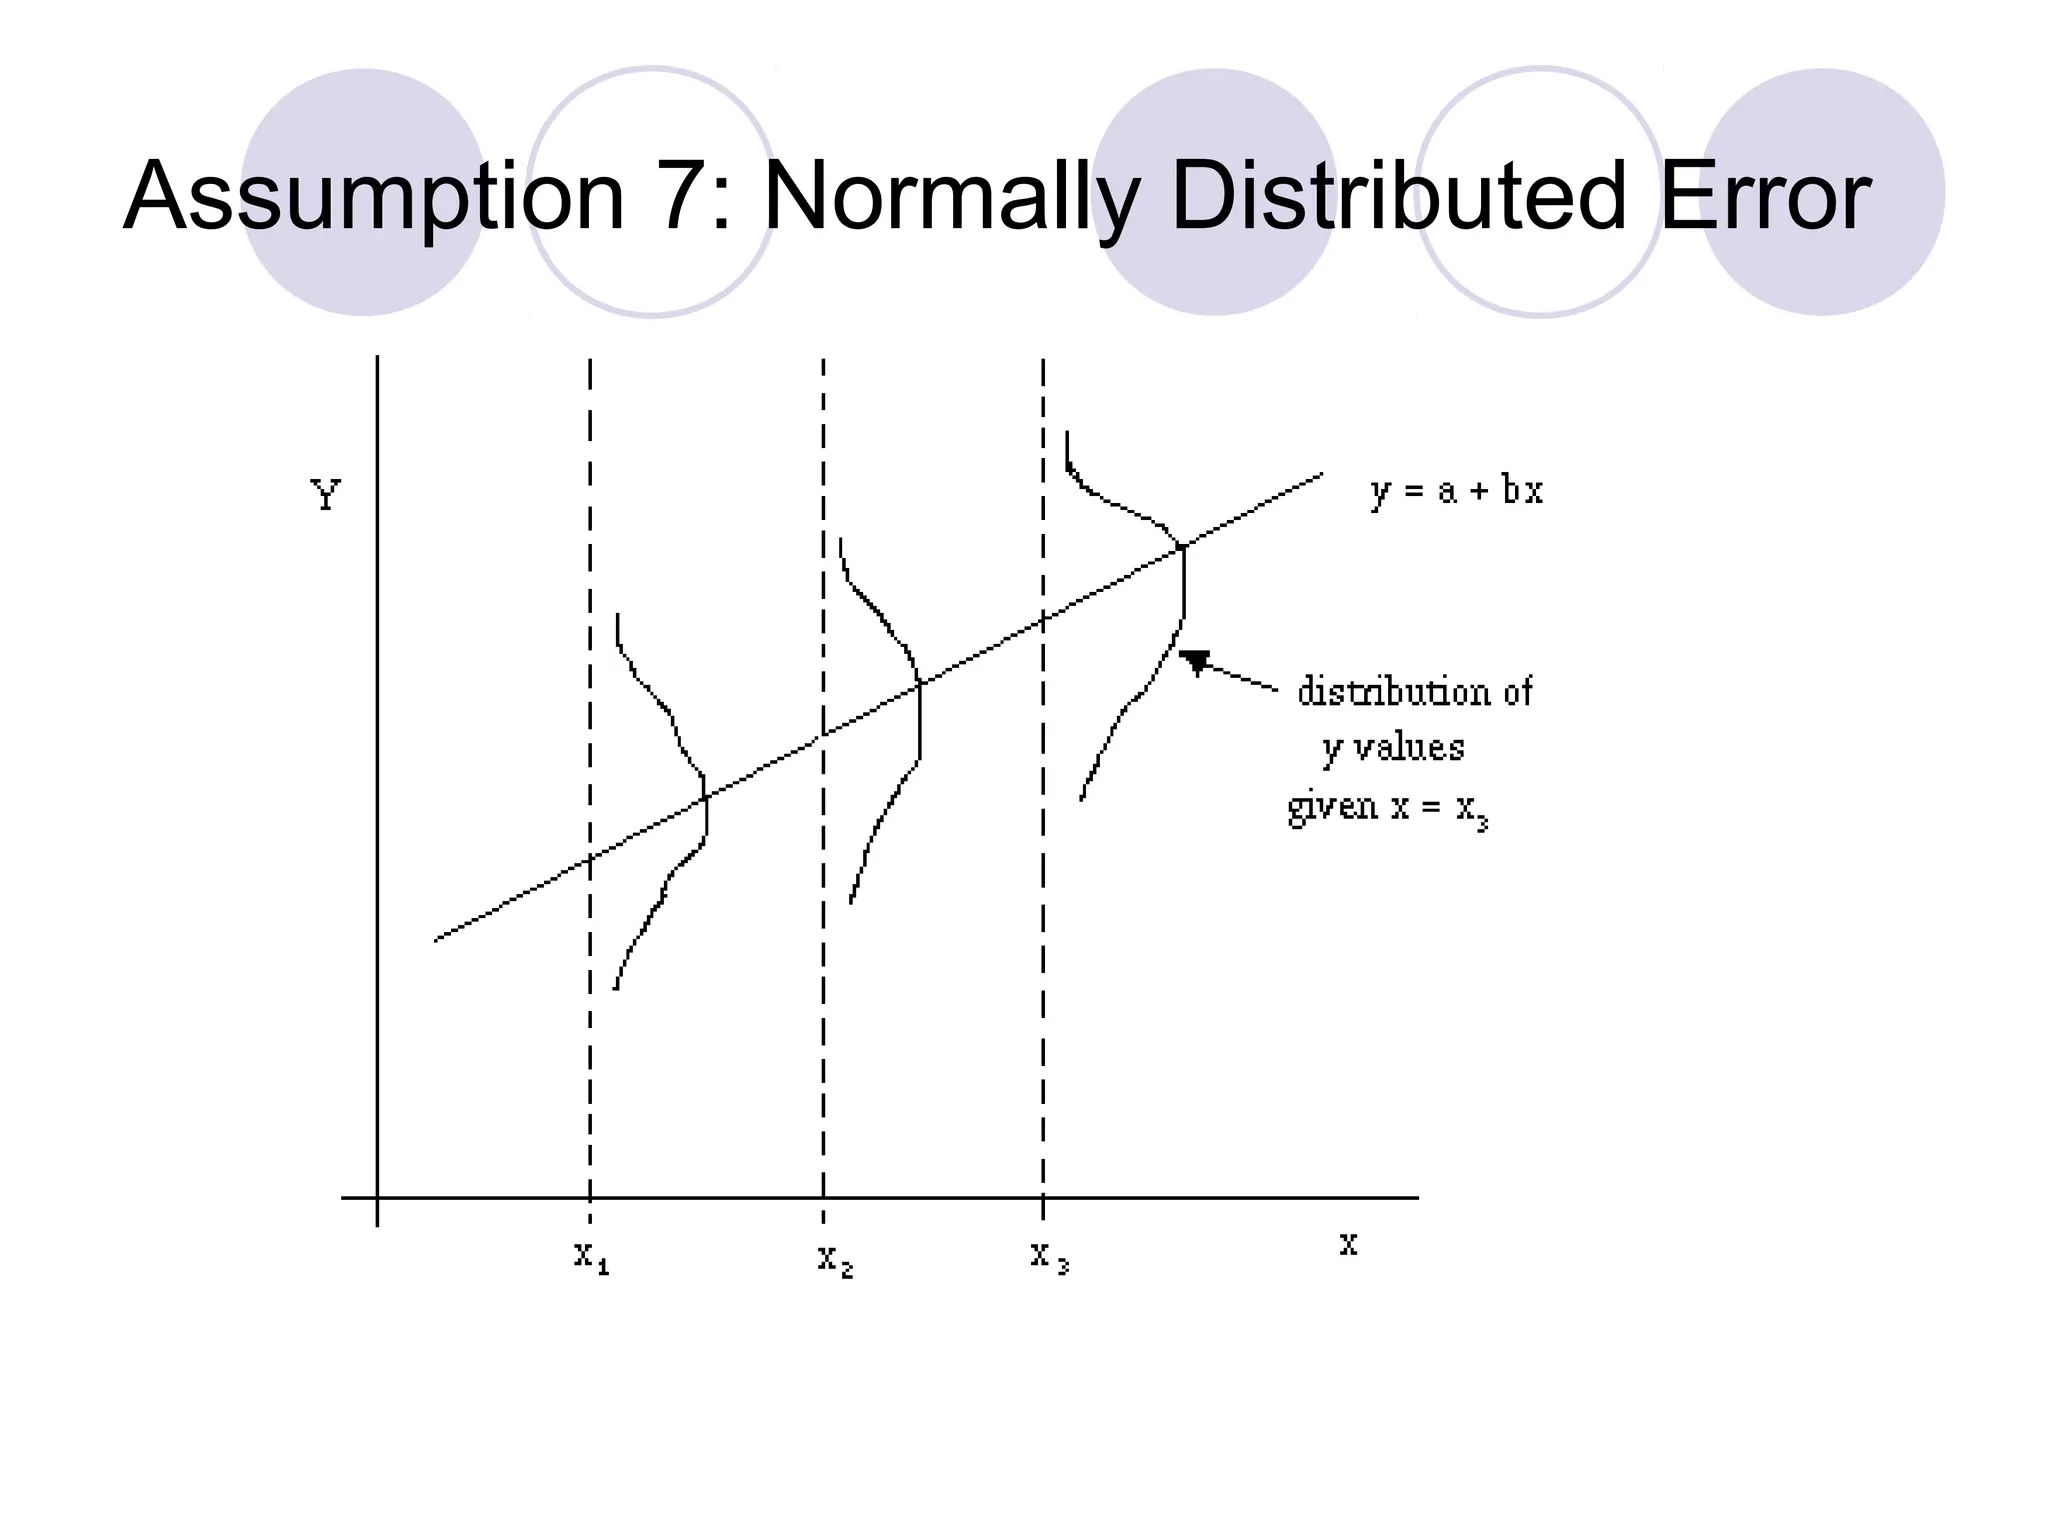

This document summarizes the key assumptions and properties of Ordinary Least Squares (OLS) regression. OLS aims to minimize the sum of squared residuals by estimating the beta coefficients. It provides the best linear unbiased estimates if its assumptions are met. The key assumptions are: 1) the regression is linear in parameters; 2) the error term has a mean of zero; 3) the error term is uncorrelated with the independent variables; 4) there is no serial correlation or autocorrelation in the error term; 5) the error term has constant variance (homoskedasticity); and 6) there is no perfect multicollinearity among independent variables. When all assumptions are met, OLS estimates