Download to read offline

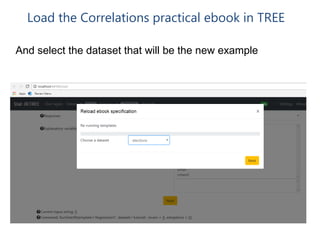
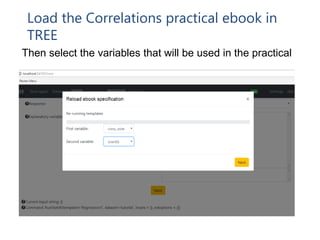
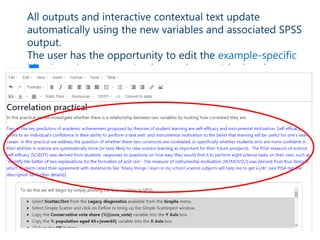
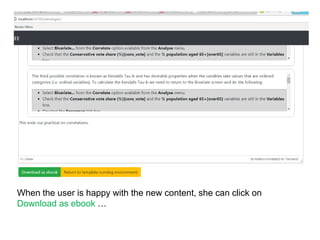
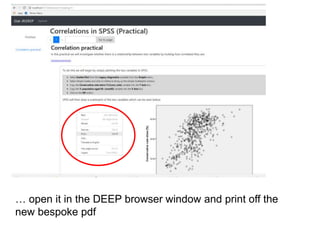
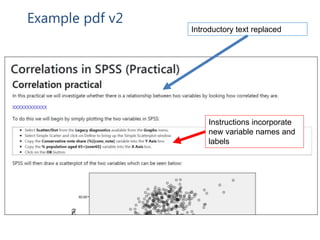


The document discusses the development of SPSS training materials using the StatJR software system, which allows for interoperability with various statistical software. It outlines a project aimed at creating customizable e-books for teaching undergraduate students quantitative methods through practical exercises using SPSS. These materials are designed to guide students in implementing statistical techniques while enabling educators to use their own datasets for tailored learning experiences.


![[Paper Introduction] Training a Natural Language Generator From Unaligned Data](https://cdn.slidesharecdn.com/ss_thumbnails/arthur-mtstudygroup-20150903-150903031320-lva1-app6892-thumbnail.jpg?width=640&height=640&fit=bounds)