Download to read offline

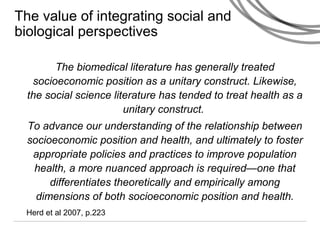
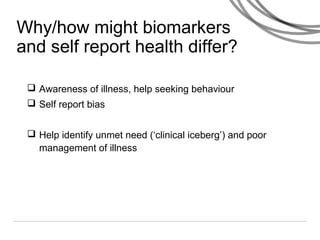
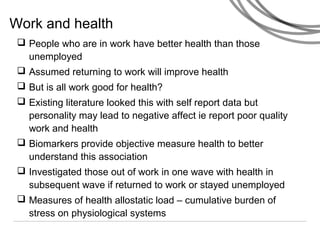


1) Integrating biological and social data can help answer questions about how socioeconomic factors influence health through various pathways and help identify those most in need by using biomarkers to provide earlier and more precise measures of health. 2) Biomarkers measured in blood and other samples can provide objective measures of established disease risks, stress responses, and health over the lifecourse that complement self-reported measures and help understand illness behavior. 3) Combining biomarker and survey data on work status and health in Understanding Society showed that returning to work did not necessarily improve health as measured by allostatic load, suggesting not all work is good for health and personality may influence self-reported associations between work and health.