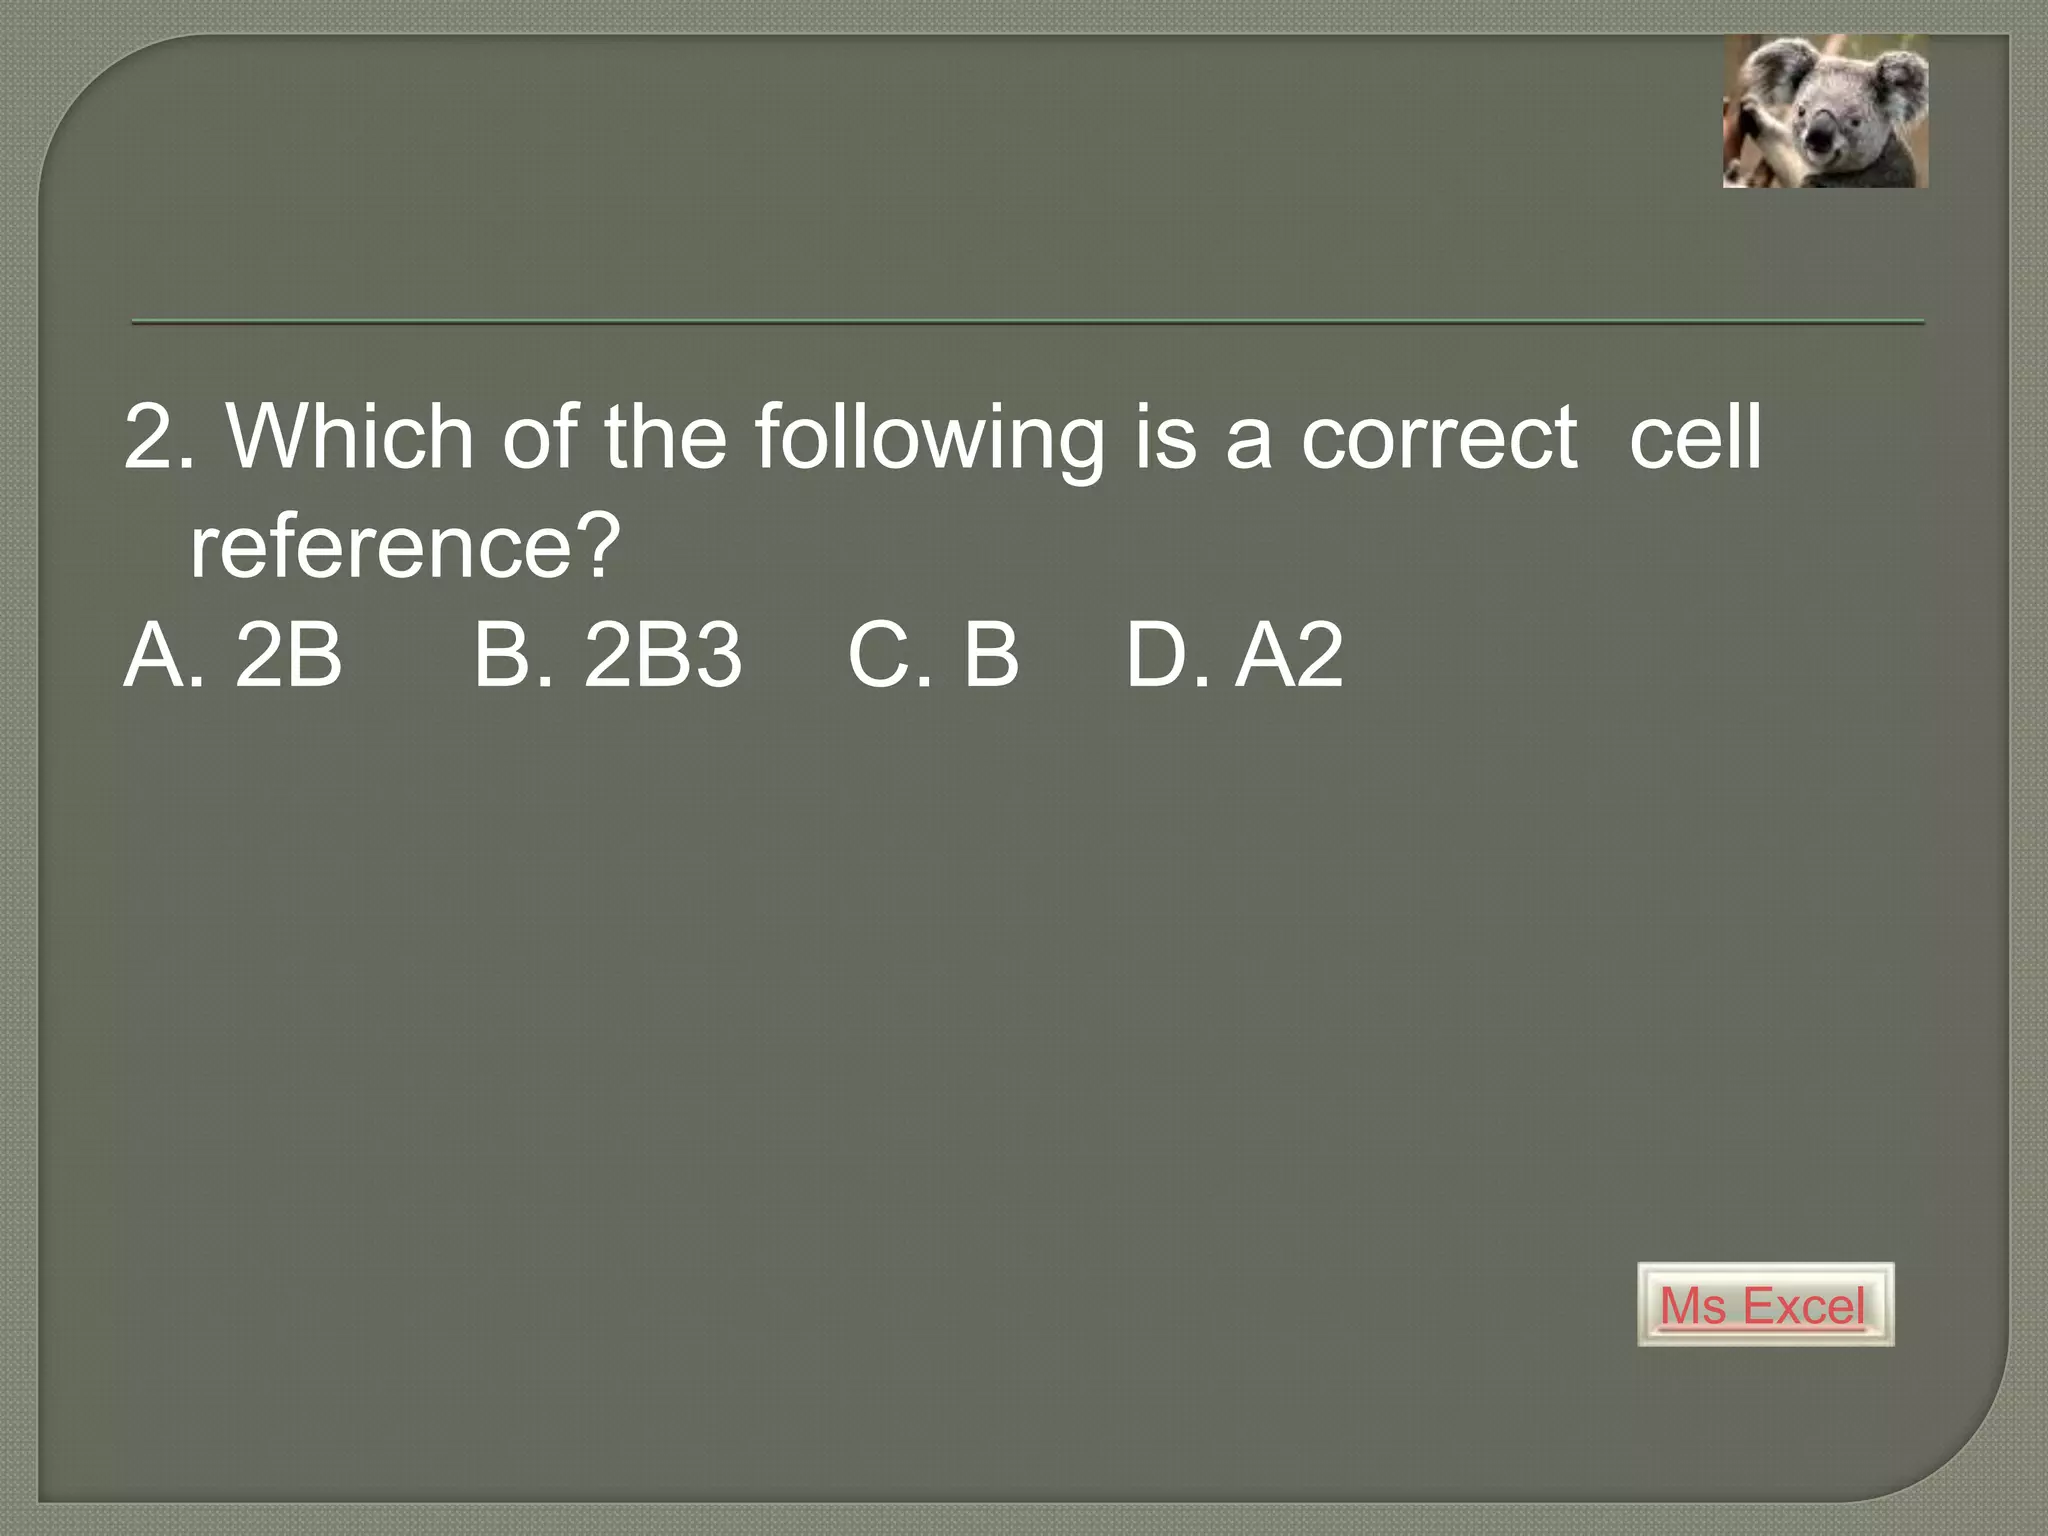
Spreadsheets allow users to enter and organize tabular data in a grid of rows and columns. Cells can contain numbers, text, or formulas. Formulas like SUM, AVERAGE, IF, and MAX allow calculations on cell values. To create a spreadsheet, the user opens a program like Excel and enters data into cells. Formulas update automatically when cell values change. Spreadsheets are useful for tasks like accounting, financial reports, contact lists, and more.
The document discusses spreadsheets and Microsoft Excel. It defines a spreadsheet as a configuration of rows and columns, also known as a worksheet. Spreadsheets are used to calculate and compare numerical or financial data. Microsoft Excel, part of the Microsoft Office suite, allows users to understand and work with spreadsheets. The document reviews the history and features of different Excel versions. It provides an overview of basic spreadsheet concepts such as workbooks, worksheets, cells, and cell references. It also reviews keyboard shortcuts for navigating within a spreadsheet.
This document provides an overview of key aspects of Microsoft Excel including its features, file formats, navigation keys, worksheets, formatting, cells and ranges, formulas, functions, and error values. It describes Excel's abilities for number crunching, creating charts and graphs, organizing lists, and accessing other data. It also outlines the basic components of formulas in Excel including operators, cell references, values/text, and functions. Finally, it provides examples of commonly used functions like SUM, AVERAGE, VLOOKUP, and COUNTIF.
A spreadsheet is a program that displays data in a table format called a worksheet. It can be used to create budgets, financial statements, manage inventory, and create charts. A worksheet is made up of columns, rows, and cells, which are the intersections of the rows and columns. Cells can contain labels, values, or formulas. Formulas in spreadsheets use functions and operation symbols like addition and multiplication to perform calculations on cell references. Spreadsheets allow users to organize and analyze data easily through features like sorting, filtering, and creating charts.
Microsoft Excel is a component of MS Office used to enter, analyze, and present quantitative data. It uses a spreadsheet format laid out in a grid of rows and columns. Excel is commonly used in business for tasks like budgeting, inventory management, and decision making. The Excel window interface includes elements like the ribbon, tabs, quick access toolbar, worksheet, formula bar, and status bar that allow the user to navigate, enter data and formulas, and view information. Formulas in Excel use operators to calculate and return values based on cell data.
A spreadsheet is an arrangement of cells organized in columns and rows that is used to store and manipulate data. A workbook contains one or more spreadsheets. Microsoft Excel is the most common program used to create spreadsheets. Spreadsheets have rows, columns, and cells identified by letters and numbers. Formulas use mathematical operators and cell references to perform calculations within a spreadsheet. Functions are predefined formulas that perform common tasks like summing a range of cells. Common uses of spreadsheets include budgets, grades, financial statements, data analysis, inventory, and forecasts.
This document provides an overview of spreadsheet concepts and features. It discusses what a spreadsheet is, how to create and enter data into a spreadsheet, different types of cell references, using charts and what-if analysis, and how spreadsheets can be used on the web. The document is a presentation on spreadsheet concepts presented by Group K, which includes four group members. It covers these topics over 15 slides.
Microsoft Excel is a spreadsheet program developed by Microsoft as part of the Microsoft Office suite. It was originally released in 1985 for Macintosh and later for Windows in 1987. Excel features calculation, graphing, and data organization tools. It allows users to perform arithmetic operations on data in a grid of cells and display results in charts and graphs. Common features include formulas, functions, formatting options, and data analysis tools. Excel has become one of the most popular spreadsheet programs due to its power and flexibility in organizing and analyzing various types of data.
This document provides an overview of Microsoft Access and how to create and manage databases. It discusses database files, tables, fields, and data types. It then explains how to create new databases and tables, enter and manipulate data, and generate forms and reports. The key steps covered include using wizards to easily set up databases, tables, forms and reports, and switching between design and datasheet views to enter and edit information.
The document discusses pivot tables and pivot charts in Microsoft Excel. It provides instructions on how to create a basic pivot table by selecting data and dragging fields, and how to modify and filter the pivot table. It also explains how to create a pivot chart based on a pivot table and change the chart type. The document demonstrates multiple examples of advanced pivot table features like two-dimensional tables, calculated fields, and multi-level tables with multiple row and filter fields.
Excel is an application used to perform numeric calculations, analyze data, and present results. It contains worksheets made up of cells organized into rows and columns that can hold numbers, text, formulas, or a combination. Each cell is identified by its row and column address. Users can enter or edit data directly into cells or with formulas and select ranges of multiple cells to perform actions on groups of cells at once.
Microsoft Excel is a spreadsheet program that organizes data into rows and columns. It contains various tools to format, analyze, and visualize data using functions, formulas, charts, and other features. Common Excel tools include formatting cells, adding formulas and functions like SUM and AVERAGE, and inserting pie charts and column charts. Excel is widely used by accountants, marketers, students, teachers, and others to organize numeric information.
Excel is an electronic spreadsheet program that allows users to store, organize, and manipulate data in a grid of rows and columns called a worksheet. Worksheets contain cells that can hold text, numbers, or formulas. Excel provides tools like functions, charts, and data analysis features to help work with large amounts of data. Users can enter values, edit data, search, zoom, and print worksheets.
This document discusses Microsoft Excel and its features. It introduces Excel as a spreadsheet program that allows users to organize, format and calculate data. It describes the basic interface of Excel including cells, columns, rows and sheets. It also provides information on common Excel functions and formulas for calculations, examples of using Excel to create simple reports and bills, and a formula for calculating age based on date of birth and the current year.
The document provides an outline for a course on electronic spreadsheets. It covers topics like the history of spreadsheets, definitions of key terms, how to use menus and toolbars, different types of data and formulas, and basic navigation commands. Sections include the history of the electronic spreadsheet, advantages of using a calculator, definitions of spreadsheet concepts like cells and worksheets, how to use menus and common toolbars, data types, formula types and operators, and ways of using formulas.
Microsoft Excel is the world's most widely used spreadsheet program and part of the Microsoft Office suite. Excel excels at creating charts, solving numerical problems, and handling non-numerical problems. Formulas in Excel use mathematical instructions and references to cells or ranges to perform calculations using operators, constants, and functions. Scenarios in Excel allow users to model different outcomes by changing inputs and seeing updated results.
- The document provides a tutorial on using Microsoft Excel. It begins with an introduction to Excel and its widespread use.
- The tutorial then covers basic Excel functions like opening and saving worksheets, formatting cells, using formulas to perform calculations, and creating a checkbook register to track expenses and balances.
- An example is provided to demonstrate setting up a basic checkbook in Excel with columns for date, description, withdrawals, deposits and balance. Formulas are used to automatically calculate the running balance.
This document provides an introduction to Microsoft Excel. It begins with opening Excel and navigating within workbooks and worksheets. It describes entering different types of data like numbers, text, formulas. It discusses selecting cells, entering and editing data, copying and moving data using fill handle. It also covers saving workbooks in compatibility mode to allow opening in older Excel versions. The document is presented by Abdulbasit H. Mhdi and contains guidance, instructions and screenshots to explain key Excel concepts.
Spreadsheets have evolved from simple paper ledgers used by merchants to complex computer programs like Excel. The first electronic spreadsheet was VisiCalc, created in 1979. It popularized the grid-based interface and was succeeded by Lotus 1-2-3 in 1983. Microsoft Excel, first released in 1985, became the dominant spreadsheet as it transitioned to Windows. Excel continues advancing with new data analysis tools and versions that work on mobile devices, ensuring spreadsheets remain a key tool for organizing and calculating data.
This document provides an overview of key Excel concepts and functions across multiple pages. It covers topics such as the Excel interface, working with cells and sheets, formatting text, inserting rows and columns, sorting data, using shortcuts, creating pivot tables, freezing rows/columns, removing duplicates, making charts and bar graphs, printing sheets, and concludes by stating the importance of professional skills for career success.
This document provides an overview of Microsoft Access, including that it is a relational database management system (RDBMS) that stores data in its own format. It can import or link to data from other sources. Access allows users to create databases and define data types for tables. Key objects in Access include tables, queries, forms and reports. Tables contain the data fields, queries retrieve specific data, forms provide interfaces for data entry and extraction, and reports organize data for presentation.
A spreadsheet is a grid of rows and columns used to organize and analyze numerical data in cells. A workbook contains one or more spreadsheets and allows users to perform calculations on the data. Spreadsheets are commonly used for household budgets, grades, finances, and payroll in businesses. A spreadsheet displays data in cells that are identified by their column letter and row number. A range refers to a group of adjacent cells, while the cell address specifies a single cell's location using its column and row.
Excel allows users to enter formulas to perform calculations on worksheet data. Formulas begin with an equal sign and can reference cell addresses to manipulate cell values using mathematical operators like addition and subtraction. Common functions like SUM, AVERAGE, and MAX simplify calculations. Formulas can be copied and filled using relative or absolute cell references.
This document provides an overview of Microsoft Excel. It discusses that Excel is a spreadsheet application used to organize data into tables and perform calculations. Key points covered include:
- Excel uses a grid of rows and columns to display data in worksheets.
- Common tasks in Excel include entering data, formatting cells, adjusting worksheet layout, printing, using formulas and functions, and creating charts and pivot tables.
- Advanced features include conditional formatting, comments, grouping worksheets, and sharing workbooks with other users.
Microsoft Excel 2016 Basics Course contentsAnil Kumar
Microsoft Excel 2016 Basics course for Beginners
Objective: This is free Microsoft Excel 2016 Basics course. In this course, you will learn about working with Microsoft Excel 2016.
After completion of this course, you will be familiar to work with Microsoft Excel 2016.
Microsoft Excel 2016 Basics Course Contents
1. Introduction to Microsoft Excel 2016
2. Microsoft Excel 2016 New Features
3. Microsoft Excel 2016 Application Interface
4. Data Entry in Excel, Cells and Ranges
5. Formatting Data and Conditional Formatting
6. Introduction to Tables
7. Saving Workbooks in Multiple Formats
8. Basic Functions in Excel
9. Creating Charts
10. Printing Options in Excel 2016
check out more details about this course from http://msofficeguru.in (Anil Kumar Devarasetti)
This document provides a tutorial on using Microsoft Excel. It covers getting started with Excel, customizing Excel, working with workbooks and sheets, entering and modifying data, using formulas and functions, sorting and filtering data, adding graphics and charts, formatting worksheets, printing, and more. The tutorial contains over 15 sections that progressively introduce the user to Excel's main features and capabilities.
This document provides an overview of common spreadsheet concepts and features found in spreadsheet applications like Microsoft Excel. It defines key terms like active cell, auto-fill, auto-sum, cell, cell reference, chart, worksheet, workbook and others. It also lists examples of commonly used predefined data types in spreadsheets like number, date, text, currency and others.
This document is a handbook for basic Excel tasks. It contains 4 parts that cover background information, Excel 101 tasks, formatting and appearance, and tips for working efficiently. Key topics include Excel terminology, inserting and deleting rows and columns, formatting cells, sorting data, adding headers and footers, and printing options. The handbook is intended as a reference for users who will view and print Excel reports.
The document discusses key concepts in Microsoft Excel including worksheets, cells, ranges, charts, and functions. It provides an overview of the Excel window and interface elements such as the ribbon, name box, and status bar. Common Excel features are explained like entering text and numeric data, using functions and formulas, summing ranges, merging cells, and creating embedded charts linked to worksheet data.
This document provides an introduction and overview of spreadsheets and Microsoft Excel. It defines what a spreadsheet is, outlines key features and elements of Excel including cells, worksheets, formatting, formulas, functions, charts and pivot tables. It also describes various data analysis tools in Excel like sorting, filtering, conditional formatting, and how to perform tasks like what-if analysis using goal seek and scenario manager. The document is intended as a reference for using spreadsheets, especially Microsoft Excel, in a business context.
Microsoft Excel is a spreadsheet application developed by Microsoft for creating and formatting spreadsheets. Spreadsheets allow information to be organized in rows and columns and analyzed using automatic mathematics. Excel workbooks can contain multiple worksheets which are made up of a grid of cells organized into rows and columns where data can be stored and analyzed using formulas. Excel offers various features for working with spreadsheets including formatting options, functions, charts and more.
Spreadsheets allow users to organize and calculate data. Key features include the ability to create and modify workbooks containing multiple worksheets with rows and columns. Worksheets can contain numbers, formulas, and functions to automatically calculate values. Common spreadsheet programs like Microsoft Excel allow users to format and visualize data through graphs and charts.
Microsoft Excel is a spreadsheet program used to organize data in grids with formulas and functions, allowing users to perform calculations, analyze data, and create charts. It provides tools for entering and manipulating data, performing calculations with functions, and creating charts to visualize data. Excel allows users to efficiently store, manipulate, and gain insights from large amounts of data.
Excel is a spreadsheet application from Microsoft. It allows users to enter data, calculate values, and format cells. The latest version is Excel 2013. Excel uses workbooks that contain worksheets where data is entered into cells organized in columns and rows. Formulas can be used to perform calculations with functions. Data is formatted for appearance. A sample worksheet is created to track student course information and calculate GPA.
This document defines a spreadsheet and its purpose. It begins by stating that a spreadsheet is a program that organizes data into rows and columns to perform operations on numerical data easily. Examples are given of where spreadsheets can be used, such as for statistics, budgeting, and keeping accounts. The elements of the Excel window like the title bar, menu bar, and worksheet tabs are identified. Finally, it describes the basic components of a spreadsheet including rows, columns, cells, and the different types of information - like labels, values, and formulas - that can be entered into cells.
Microsoft Excel is a spreadsheet program that allows users to organize and calculate data. It can display statistical data and compute factors automatically from large datasets using formulas. Excel has tools like functions, formatting, formulas and cell references that allow users to manipulate data visually and through calculations. Functions like SUM, AVERAGE, MAX, MIN, COUNT and IF are predefined formulas that perform specific calculations based on cell values and references provided as arguments or parameters.
A spreadsheet is a grid of rows and columns used to organize numeric and text data. It allows complex calculations through the use of formulas in cells. Key components include worksheets, cells addressed by row and column labels, and two types of formulas - equation formulas using math operators and function formulas using predefined functions. Functions like SUM, AVERAGE, MIN, and MAX allow calculations on cell ranges.
This document provides an overview of the menus in Microsoft Excel. It discusses the main functions of the Home, Insert, Page Layout, Formulas, Data, Review, and View menus. It also demonstrates how to insert and format charts using built-in Excel functions. Additional topics covered include PivotTables, removing duplicate entries, conditional formatting, and some commonly used Excel formulas. The overall purpose is to help users better understand the Excel interface and utilize key tools and features.
This document provides an overview of Microsoft Excel. It introduces the Excel interface including the ribbon, worksheets, and formula bar. It describes how to navigate between workbooks and worksheets. It also covers entering and formatting data, using formulas and functions, creating charts and graphs, and printing and sharing worksheets. The document provides tips for working more efficiently using features like keyboard shortcuts, AutoFill, and macros.
MS Excel is a spreadsheet program used to store and manipulate data in rows and columns divided into cells using worksheets, allowing users to easily write equations and functions. Excel has numerous functions, formulas, shortcuts, and tools that increase its usefulness for accounting, business, and other tasks. The Excel interface includes ribbons, tabs, groups, command buttons, and other components to access its various capabilities.
Microsoft Excel is a spreadsheet application that allows users to organize and calculate data across rows and columns in a workbook. It can import various data types and formats them for analysis. Excel uses formulas and functions to perform calculations on cell values. Common functions include SUM to add values and AVERAGE to calculate means. Charts and graphs can visually represent spreadsheet data. Workbooks may contain multiple worksheets to organize different data sets.
Microsoft Excel is a spreadsheet application that allows users to organize and calculate data across rows and columns in a workbook. It can import various data types and formats them for analysis. Excel uses formulas and functions to perform calculations on cell values. Common functions include SUM to add values and AVERAGE to calculate means. Charts and graphs can visually represent data. Workbooks may contain multiple worksheets to organize related data in different tables.
Microsoft Excel is a spreadsheet application that allows users to organize and calculate data across rows and columns in a workbook. It can import various data types and formats them for analysis. Excel uses formulas and functions to perform calculations on cell values. Common functions include SUM to add values and AVERAGE to calculate means. Charts and graphs can visually represent spreadsheet data. Workbooks may contain multiple worksheets to organize different data sets.
Similar to Introduction to Spreadsheet Applications (20)
4th Modern Marketing Reckoner by MMA Global India & Group M: 60+ experts on W...Social Samosa
The Modern Marketing Reckoner (MMR) is a comprehensive resource packed with POVs from 60+ industry leaders on how AI is transforming the 4 key pillars of marketing – product, place, price and promotions.
The Building Blocks of QuestDB, a Time Series Databasejavier ramirez
Talk Delivered at Valencia Codes Meetup 2024-06.
Traditionally, databases have treated timestamps just as another data type. However, when performing real-time analytics, timestamps should be first class citizens and we need rich time semantics to get the most out of our data. We also need to deal with ever growing datasets while keeping performant, which is as fun as it sounds.
It is no wonder time-series databases are now more popular than ever before. Join me in this session to learn about the internal architecture and building blocks of QuestDB, an open source time-series database designed for speed. We will also review a history of some of the changes we have gone over the past two years to deal with late and unordered data, non-blocking writes, read-replicas, or faster batch ingestion.
Analysis insight about a Flyball dog competition team's performanceroli9797
Insight of my analysis about a Flyball dog competition team's last year performance. Find more: https://github.com/rolandnagy-ds/flyball_race_analysis/tree/main
End-to-end pipeline agility - Berlin Buzzwords 2024Lars Albertsson
We describe how we achieve high change agility in data engineering by eliminating the fear of breaking downstream data pipelines through end-to-end pipeline testing, and by using schema metaprogramming to safely eliminate boilerplate involved in changes that affect whole pipelines.
A quick poll on agility in changing pipelines from end to end indicated a huge span in capabilities. For the question "How long time does it take for all downstream pipelines to be adapted to an upstream change," the median response was 6 months, but some respondents could do it in less than a day. When quantitative data engineering differences between the best and worst are measured, the span is often 100x-1000x, sometimes even more.
A long time ago, we suffered at Spotify from fear of changing pipelines due to not knowing what the impact might be downstream. We made plans for a technical solution to test pipelines end-to-end to mitigate that fear, but the effort failed for cultural reasons. We eventually solved this challenge, but in a different context. In this presentation we will describe how we test full pipelines effectively by manipulating workflow orchestration, which enables us to make changes in pipelines without fear of breaking downstream.
Making schema changes that affect many jobs also involves a lot of toil and boilerplate. Using schema-on-read mitigates some of it, but has drawbacks since it makes it more difficult to detect errors early. We will describe how we have rejected this tradeoff by applying schema metaprogramming, eliminating boilerplate but keeping the protection of static typing, thereby further improving agility to quickly modify data pipelines without fear.
ViewShift: Hassle-free Dynamic Policy Enforcement for Every Data LakeWalaa Eldin Moustafa
Dynamic policy enforcement is becoming an increasingly important topic in today’s world where data privacy and compliance is a top priority for companies, individuals, and regulators alike. In these slides, we discuss how LinkedIn implements a powerful dynamic policy enforcement engine, called ViewShift, and integrates it within its data lake. We show the query engine architecture and how catalog implementations can automatically route table resolutions to compliance-enforcing SQL views. Such views have a set of very interesting properties: (1) They are auto-generated from declarative data annotations. (2) They respect user-level consent and preferences (3) They are context-aware, encoding a different set of transformations for different use cases (4) They are portable; while the SQL logic is only implemented in one SQL dialect, it is accessible in all engines.
#SQL #Views #Privacy #Compliance #DataLake
06-04-2024 - NYC Tech Week - Discussion on Vector Databases, Unstructured Data and AI
Round table discussion of vector databases, unstructured data, ai, big data, real-time, robots and Milvus.
A lively discussion with NJ Gen AI Meetup Lead, Prasad and Procure.FYI's Co-Found
STATATHON: Unleashing the Power of Statistics in a 48-Hour Knowledge Extravag...sameer shah
"Join us for STATATHON, a dynamic 2-day event dedicated to exploring statistical knowledge and its real-world applications. From theory to practice, participants engage in intensive learning sessions, workshops, and challenges, fostering a deeper understanding of statistical methodologies and their significance in various fields."
State of Artificial intelligence Report 2023kuntobimo2016
Artificial intelligence (AI) is a multidisciplinary field of science and engineering whose goal is to create intelligent machines.
We believe that AI will be a force multiplier on technological progress in our increasingly digital, data-driven world. This is because everything around us today, ranging from culture to consumer products, is a product of intelligence.
The State of AI Report is now in its sixth year. Consider this report as a compilation of the most interesting things we’ve seen with a goal of triggering an informed conversation about the state of AI and its implication for the future.
We consider the following key dimensions in our report:
Research: Technology breakthroughs and their capabilities.
Industry: Areas of commercial application for AI and its business impact.
Politics: Regulation of AI, its economic implications and the evolving geopolitics of AI.
Safety: Identifying and mitigating catastrophic risks that highly-capable future AI systems could pose to us.
Predictions: What we believe will happen in the next 12 months and a 2022 performance review to keep us honest.
2. Ms Excel
What is spreadsheet? A spreadsheet is a
table of values arranged in rows and
columns. This lesson covers some basic
spreadsheet concepts, but also will
introduce you to the common screen
elements (features in the Spreadsheet
window) found in this application.
3. Ms Excel
What is spreadsheet? Cont’d
The following are some examples of
spreadsheet applications: Microsoft Excel,
Lotus 1 2 3, Quattro pro, Ability Spread,
Xoom Office, Google Docs, EditGrid,
Smartsheet Boeing Calc.
4. Ms Excel
Active Cell: The worksheet cell with a
dark border; text or numbers you type
appear in this cell and in the formula bar.
Alignment: The placement of cell data in a
cell.
Auto Fill: A feature that enables you to fill
in a series of numbers, dates, or other
items automatically in a specified range.
5. Ms Excel
Auto Sum: A feature that enables insertion of
a formula to sums up a range of cells
automatically.
Bar Chart: Compares individual items.
Categories are organized vertically, values
horizontally to place more emphasis on
comparing values than on time.
Cell: The intersection of a row and column.
Cell Reference: identifies the location of a
cell or group of cells in the spreadsheet.
6. Ms Excel
Absolute Reference: A cell reference that
does not adjust when the formula is pasted to
a new location.
Relative Reference: A cell reference that
adjust to reflect the current location in
formula.
Chart: Graphic representation of worksheet
data.
Chart Title: Identifies the purpose of the
chart.
7. Ms Excel
Chart Wizard: A series of dialog boxes that
lets you create a chart and customize it.
Column Chart: Shows changes in data over
a period of time or comparisons among items.
Data Label: Identifies specific points or
series.
Data Series: A group of related data points
plotted in a chart that originates from rows or
columns on a single worksheet.
8. Ms Excel
Fill Handle: The small black square on the
bottom right corner of a selected cell.
Formula: A sequence of values, cell
references and operators used to produce a
new value from existing cells.
Formula Bar: Displays the contents of the
current or active cell, located above the
worksheet column headings.
Function: built-in formulae that enable users
perform common calculations on data without
the need to write entire formulae from
scratch.
9. Ms Excel
Gridlines: Optional lines on a chart.
Insert Function: A button located on the
formula bar that allows quick access to the
Insert Function dialog box.
Legend: Key to the data represented by a
chart.
Line Chart: Shows trends in data at equal
interv
10. Ms Excel
Merge and Center: To combine adjacent, or
contiguous, cells into one large cell and
center the data.
Operators: Addition (+), Subtraction (-),
Multiplication (*), and Division (/), also the
colon (:) that separates cells in a range.
Order of Precedence: The order in which
Excel processes operations in a formula
containing more than one operation.
Pie Chart: Shows the relationship of items
that make up data series to the sum of the
items.
11. Ms Excel
Range: A range is a group of cells in a
worksheet that have been highlighted or
specified in a formula. In a formula, it is
denoted by “colon” (:) usually placed between
two cell references
Sheet Tab: A means to access the different
sheets in a workbook, located at the bottom
of the spreadsheet.
Spreadsheet: A table of values arranged in
rows and columns.
12. Ms Excel
Task Pane: Provides a quick means to
execute commands. Displays when you start
Excel and enables you to create new
workbooks or open and existing one.
Templates: ready-made pages format,
complete with margins, fonts, headers and
footers, numbering, logos or any other kind of
formatting the designer wants to appear on
each page.
Toolbars: A series of buttons and menus in
an application, which allows the user to
perform functions quickly using the mouse.
13. Ms Excel
Workbook: An Excel file that contains one
or more worksheets.
Worksheet: A work area comprised of
rows and columns, also known as a
spreadsheet.
Value: The number resulting from the
execution of a formula.
14. Ms Excel
Spreadsheet applications contain
predefined data types for specific
purposes. The type of data used depends
on the type or the category (Financial, date
& time, statistical, database etc) of
document being processed.
15. Ms Excel
Commonly used predefined data types
used in spreadsheet: cont’d
• Number – for documents in which there is the
need to perform calculations using numerical
figures
• Date – used for a field or cell that is supposed to
contain date
• Text – Defined for a cells that is supposed to
contain textual string data
• Currency – Defined for cells that are supposed to
hold value for money
16. Ms Excel
Commonly used predefined data types used
in spreadsheet: cont’d
• Fraction – defined for fields that are supposed to hold
fractional numbers
• Time – defined for cells that supposed to contain time
values
• Integer – defined for fields that are supposed to hold
whole numbers
• Float – defined for fields that are supposed to contain
floating point (decimal) numbers
• Boolean – defined for cells containing true/false
values
17. Ms Excel
1. …………………………: The worksheet cell with
a dark border; text or numbers you type appear in
this cell and in the formula bar.
2. ………………………….: A feature that enables
you to fill in a series of numbers, dates, or other
items automatically in a specified range.
3. …………………………: A feature that you can
use to insert a formula that sums a range of cells
automatically.
4. ……………………………...: The intersection of a
row and column.
5. ………………………….: Identifies a particular
cell on a spreadsheet or worksheet.