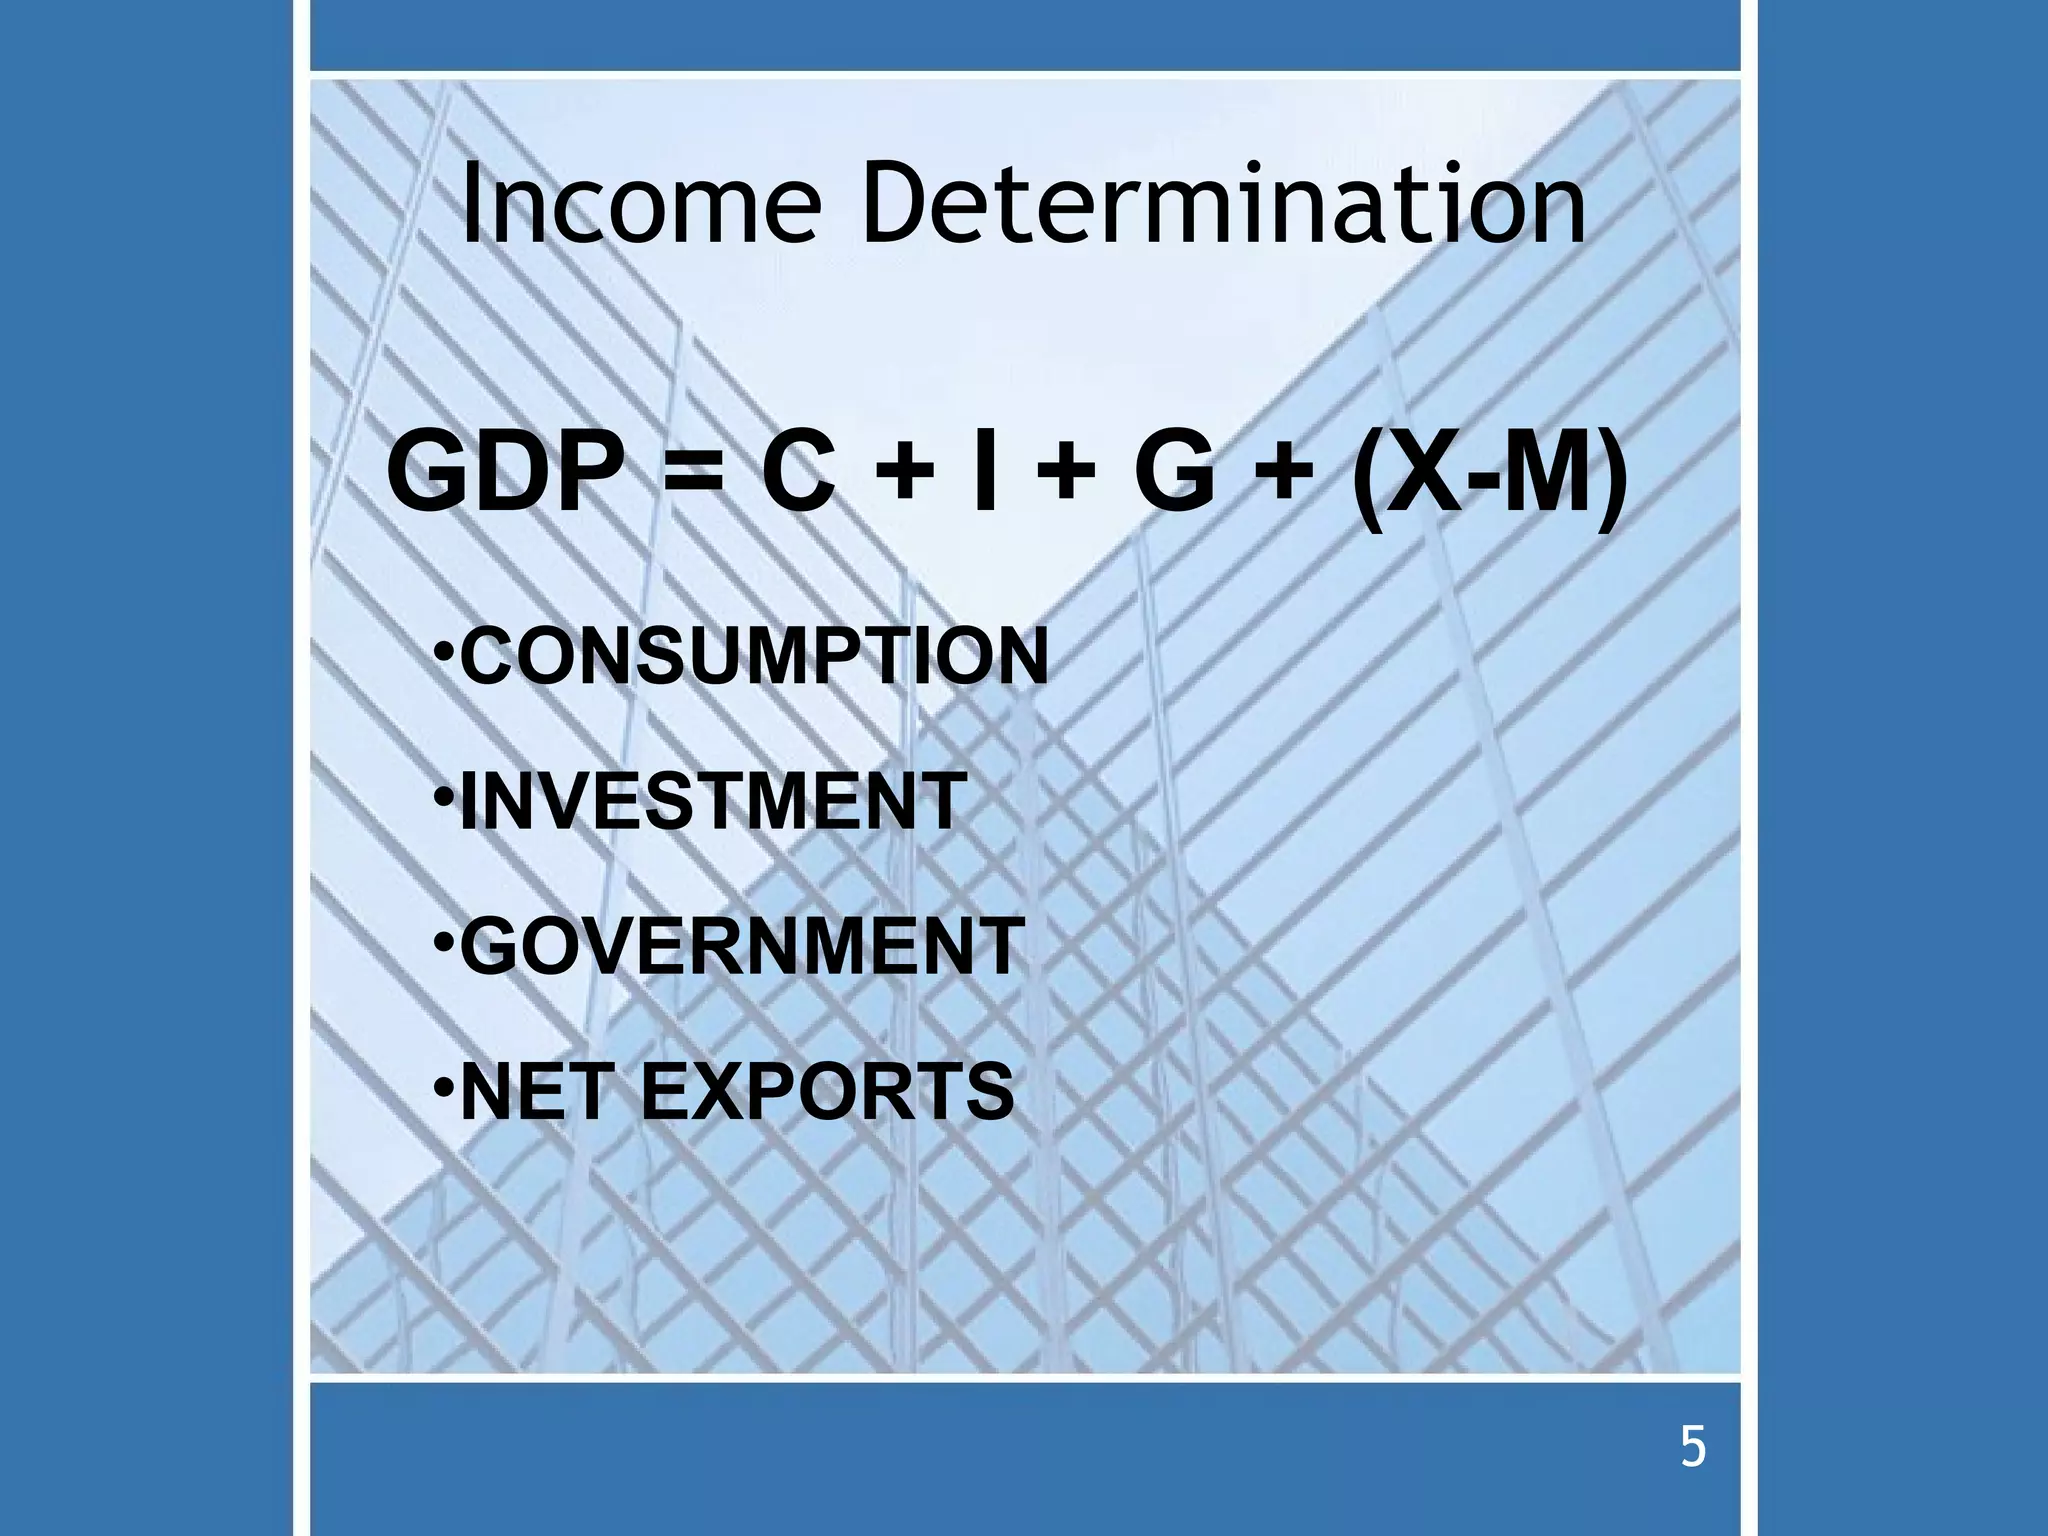
Fiscal Policy &
the Expenditure Multiplier

   tracking MacroEconomic
   Trends and Statistics and
   evaluating the impact of
 government related activities


                                 1
Unemployment
                     Seasonally Adjusted Monthly Unemployment
                      Rate, from January 1984 to December 2004
Unemployment Rate


                10
                 9
                 8
                 7
       (%)


                 6
                 5
                 4
                 3
                 2
                     Ja

                          Ja

                                 Ja

                                        Ja

                                               Ja

                                                      Ja

                                                             Ja

                                                                    Ja

                                                                           Ja

                                                                                  Ja

                                                                                          Ja
                      n-

                              n-

                                     n-

                                            n-


                                                          n-

                                                                 n-

                                                                        n-


                                                                                      n-

                                                                                              n-
                                                   n-


                                                                               n-
                         8

                                 8

                                        8

                                               9


                                                             9

                                                                    9

                                                                           9


                                                                                         0

                                                                                                 0
                                                      9


                                                                                  0
                          4


                                       8


                                                            4

                                                                   6

                                                                          8


                                                                                          2

                                                                                                4
                                6


                                              0

                                                     2


                                                                                 0
                                                   Month

                                                                                      2
Economic Growth
                         Percentage Change in Real Gross Domestic
                                    Product (1984-2004)
                    8
Percentage Change


                    7
                    6
                    5
                    4
                    3
                    2
                    1
                    0
                    -1
                         19


                               19


                                     19


                                           19


                                                 19


                                                        19


                                                              19


                                                                    19


                                                                          20


                                                                                20


                                                                                         20
                                                  92


                                                         94


                                                               96


                                                                     98
                          84


                                86


                                      88


                                            90


                                                                           00


                                                                                    02


                                                                                          04
                                                      Year


                                                                                3
CPI & PPI
                        Percentage Change in Consumer Price Index (Not
                       Seasonally Adjusted, 1982-84=100) and Implicit Price
                                 Deflator (2000=100), 1984-2003
                                           % change in CPI                     % change in IPD
Percentage Change


                    6.00

                    5.00

                    4.00

                    3.00

                    2.00

                    1.00

                    0.00
                           1


                                   1


                                           1


                                                   1


                                                           1


                                                                   1


                                                                           1


                                                                                    1


                                                                                            2


                                                                                                    2
                           98


                                   98


                                            98


                                                   99


                                                             99


                                                                    99


                                                                           99


                                                                                    99


                                                                                            00


                                                                                                    00
                               4


                                       6


                                               8


                                                       0


                                                               2


                                                                       4


                                                                               6


                                                                                        8


                                                                                                0


                                                                                                        2
                                                             Year


                                                                                                4
Income Determination

GDP = C + I + G + (X-M)
•CONSUMPTION
•INVESTMENT
•GOVERNMENT
•NET EXPORTS


                          5
Fiscal Policy
• Changes in government spending and
  changes in taxation influence the
  level of economic activity
  – Increases in taxes contract the economy
  – Decreases in taxes stimulate the
    economy
  – Increases in government spending will
    stimulate the economy
  – Decreases in government spending will
    contract the economy

• together the President and Congress
  determine fiscal policy
                                          6
Government Spending or Taxes?
 • why do changes in (“G”) government
   spending levels have greater impact
   on the economy than changes in
   (“T”) taxation levels
   – Government spending is direct
   – Taxes depend on what consumers do
     with the tax cut. What they would have
     done with the money going to support
     the levels of taxes (how much would
     they consume or how much would they
     save of the changing marginal funds)

                                         7
Crowding Out
• Government increases spending
• Government finances the spending by
  borrowing in credit market
• the interest rates go up
• the rate and amount of private
  investment falls
• the increase in government spending
  is offset by a decrease in private
  investment

                                   8
The Expenditure Multiplier
• There is a change in spending
• The change in spending becomes a
  change in income for others
• Those changes in income become
  spending
• The change in spending becomes a
  change in income for others
• then the same process happens again
  and again and again…….

                                    9
Main Points ~ page i
• Three (3) MacroEconomic goals
  – are: (i) Full employment; (ii)
    economic growth; and (iii) price
    stability

• Discretionary Fiscal Policy is the
  use of changes in government
  spending and taxation rates to
  influence the level of economic
  activity
                                       10
Main Points ~ page ii
• using the Expenditure Multiplier
  a change in initial spending is
  multiplied to cause greater
  changes in spending levels
• remember changes in G have
  more direct and greater impact
  on spending levels than changes
  in T

                                11
Main Points ~ page iii
• the Government runs a deficit when
  spending is greater than tax receipts
  in a given year
• the amount of Government Debt is
  the accumulation of annual deficits
• the Crowding Out effect occurs when
  government spending is financed by
  private borrowing and raises interest
  rates thereby crowding out private
  investment

                                     12

Mpp#018+fiscal.policy.&.the.multiplier.(12)

  • 1.
    Fiscal Policy & theExpenditure Multiplier tracking MacroEconomic Trends and Statistics and evaluating the impact of government related activities 1
  • 2.
    Unemployment Seasonally Adjusted Monthly Unemployment Rate, from January 1984 to December 2004 Unemployment Rate 10 9 8 7 (%) 6 5 4 3 2 Ja Ja Ja Ja Ja Ja Ja Ja Ja Ja Ja n- n- n- n- n- n- n- n- n- n- n- 8 8 8 9 9 9 9 0 0 9 0 4 8 4 6 8 2 4 6 0 2 0 Month 2
  • 3.
    Economic Growth Percentage Change in Real Gross Domestic Product (1984-2004) 8 Percentage Change 7 6 5 4 3 2 1 0 -1 19 19 19 19 19 19 19 19 20 20 20 92 94 96 98 84 86 88 90 00 02 04 Year 3
  • 4.
    CPI & PPI Percentage Change in Consumer Price Index (Not Seasonally Adjusted, 1982-84=100) and Implicit Price Deflator (2000=100), 1984-2003 % change in CPI % change in IPD Percentage Change 6.00 5.00 4.00 3.00 2.00 1.00 0.00 1 1 1 1 1 1 1 1 2 2 98 98 98 99 99 99 99 99 00 00 4 6 8 0 2 4 6 8 0 2 Year 4
  • 5.
    Income Determination GDP =C + I + G + (X-M) •CONSUMPTION •INVESTMENT •GOVERNMENT •NET EXPORTS 5
  • 6.
    Fiscal Policy • Changesin government spending and changes in taxation influence the level of economic activity – Increases in taxes contract the economy – Decreases in taxes stimulate the economy – Increases in government spending will stimulate the economy – Decreases in government spending will contract the economy • together the President and Congress determine fiscal policy 6
  • 7.
    Government Spending orTaxes? • why do changes in (“G”) government spending levels have greater impact on the economy than changes in (“T”) taxation levels – Government spending is direct – Taxes depend on what consumers do with the tax cut. What they would have done with the money going to support the levels of taxes (how much would they consume or how much would they save of the changing marginal funds) 7
  • 8.
    Crowding Out • Governmentincreases spending • Government finances the spending by borrowing in credit market • the interest rates go up • the rate and amount of private investment falls • the increase in government spending is offset by a decrease in private investment 8
  • 9.
    The Expenditure Multiplier •There is a change in spending • The change in spending becomes a change in income for others • Those changes in income become spending • The change in spending becomes a change in income for others • then the same process happens again and again and again……. 9
  • 10.
    Main Points ~page i • Three (3) MacroEconomic goals – are: (i) Full employment; (ii) economic growth; and (iii) price stability • Discretionary Fiscal Policy is the use of changes in government spending and taxation rates to influence the level of economic activity 10
  • 11.
    Main Points ~page ii • using the Expenditure Multiplier a change in initial spending is multiplied to cause greater changes in spending levels • remember changes in G have more direct and greater impact on spending levels than changes in T 11
  • 12.
    Main Points ~page iii • the Government runs a deficit when spending is greater than tax receipts in a given year • the amount of Government Debt is the accumulation of annual deficits • the Crowding Out effect occurs when government spending is financed by private borrowing and raises interest rates thereby crowding out private investment 12