#Toronto Businesses now demanding their offices be close to accessible, rapid...
Ye submarket dashboard q1 2010
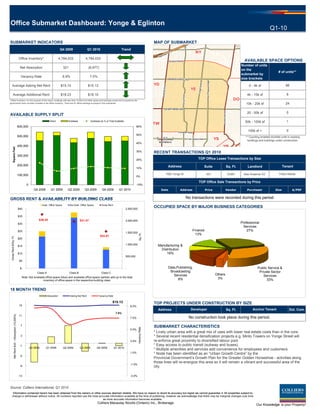
1. Office Submarket Dashboard: Yonge & Eglinton
Q1-10
SUBMARKET INDICATORS MAP OF SUBMARKET
Q4 2009 Q1 2010 Trend
41
01
y 40
y4 0
y4
ay 4
wy
1
1
1 NY
NY
hw a
hw a
hw
w
High
Hig
Hig
Hig
Hig
Office Inventory* 4,784,033 4,784,033
Brooke Avenue
Brooke Avenue
Brooke Avenue
Brooke Avenue
Brooke Avenue AVAILABLE SPACE OPTIONS
Number of units
Net Absorption 321 (8,977)
on the
# of units**
submarket by
Vacancy Rate 6.9% 7.0%
Lawrence Avenue West
Lawrence Avenue West
Lawrence Avenue West
Lawrence Avenue West
Lawrence Avenue West
Lawrence Avenue West size brackets
Mount Pleasant Road
Mount Pleasant Road
Mount Pleasant Road
et
eet
eet
Street
Yonge Street
Street
YD
YD
Yonge Street
Street
eet
Bathurst Str et
eet
Average Asking Net Rent $15.10 $15.13 0 - 4k sf 98
Bathurst Str et
eet
Bathurst Str et
eet
Yonge Stre
Yonge Str
Yonge Str
Yonge Str
Bathurst Stre
Mount Pleasant
Mount Pleasant
Bathurst Stre
YE
YE
Bathurst
Average Additional Rent $18.23 $18.10 4k - 10k sf 9
Avenue Road
Avenue Road
Avenue Road
Avenue Road
Avenue Road
Avenue Road
*Office Inventory: For the purpose of this report, buildings with less than 10,000 sf of office space and buildings owned and occupied by the DO
DO
government have not been included in the office inventory. There are 57 office buildings surveyed in this submarket. 10k - 20k sf 24
Eglinton Avenue West
Eglinton Avenue West
Eglinton Avenue West
Eglinton Avenue West
Eglinton Avenue West
Eglinton Avenue West Eglinton Avenue East
Eglinton Avenue East
Eglinton Avenue East
Eglinton Avenue East
Eglinton Avenue East
Eglinton Avenue East
Bayview Avenue
Bayview Avenue
Bayview Avenue
0
Bayview Avenue
Bayview Avenue
20 - 50k sf
AVAILABLE SUPPLY SPLIT
Laird Drive
Laird Drive
Laird Drive
Laird Drive
Laird Drive
Laird Drive
Laird Drive
Laird Drive
Laird Drive
Laird Drive
Laird Drive
Laird Drive
Direct Sublease Sublease as % of Total Available 50k - 100k sf 1
TW
TW
600,000 60%
Lonsdale Road
Lonsdale Road
Lonsdale Road
Lonsdale Road
Lonsdale Road
Lonsdale Road
100k sf + 0
50%
500,000 0.5
0.5 1
1 ** Counting smallest divisible units in existing
0
0 St. Clair Avenue West
St. Clair Avenue West
St. Clair Avenue West
St. Clair Avenue West
St. Clair Avenue West
St. Clair Avenue West YS
YS buildings and buildings under construction.
40% kilometers
kilometers
400,000 YB
YB
Square Feet
30% RECENT TRANSACTIONS Q1 2010
300,000
20% TOP Office Lease Transactions by Size
200,000 Address Suite Sq. Ft. Landlord Tenant
10%
100,000 1920 Yonge St 401 19,881 Aker Kvaerner EC Public Mobile
0%
TOP Office Sale Transactions by Price
0 -10%
Q4 2008 Q1 2009 Q2 2009 Q3 2009 Q4 2009 Q1 2010 Date Address Price Vendor Purchaser Size $/PSF
GROSS RENT & AVAILABILITY BY BUILDING CLASS
BUILDING CLASS No transactions were recorded during this period
Avail. Office Space Not Avail. Office Space Gross Rent
$40 2,500,000
OCCUPIED SPACE BY MAJOR BUSINESS CATEGORIES
$35
$36.25 $31.47 2,000,000
$30 Professional
Services
$25 Finance 27%
1,500,000
13%
Sq. Ft.
$24.81
Gross Rent $/Sq. Ft.
$20
1,000,000 Manufacturing &
$15
Distribution
$10 16%
500,000
$5
$- - Data,Publishing, Public Service &
Class A Class B Class C Broadcasting Private Sector
Services Others Services
Note: Not available office space (blue) and available office space (yellow) add up to the total 3%
inventory of office space in the respective building class. 8% 33%
18 MONTH TREND
Absorption Asking Net Rent Vacancy Rate
$15.13 TOP PROJECTS UNDER CONSTRUCTION BY SIZE
15 9.0%
Address Developer Sq. Ft. Anchor Tenant Est. Com.
7.0%
Net Rent $/sf. / Absorption (10,000's)
11
7.0% No construction took place during this period.
7 SUBMARKET CHARACTERISTICS
Vacancy Rate
5.0%
* Lively urban area with a great mix of uses with lower real estate costs than in the core.
3 * Several recent residential densification projects e.g. Minto Towers on Yonge Street will
3.0% re-enforce great proximity to diversified labour pool.
-1 * Easy access to public transit (subway and buses).
Q4 2008 Q1 2009 Q2 2009 Q3 2009 Q4 2009 Q1 2010
* Multiple amenities and services add convenience for employees and customers.
1.0% * Node has been identified as an “Urban Growth Centre” by the
-5
Provincial Government’s Growth Plan for the Greater Golden Horseshoe - activities along
those lines will re-energize this area so it will remain a vibrant and successful area of the
-1.0%
-9 city.
-13 -3.0%
Source: Colliers International, Q1 2010
Information contained herein has been obtained from the owners or other sources deemed reliable. We have no reason to doubt its accuracy but regret we cannot guarantee it. All properties subject to
change or withdrawal without notice. All numbers reported use the most accurate information available at the time of publishing, however we acknowledge that there may be marginal changes over time
as more accurate information becomes available.
Colliers Macaulay Nicolls (Ontario) Inc., Brokerage.
Our Knowledge is your Property®