More Related Content Similar to Oil Seeds World Markets And Trade Similar to Oil Seeds World Markets And Trade (16) 1. United States
Department of
Agriculture
Foreign
Agricultural
Service
Circular Series
FOP 2-10
February 2010
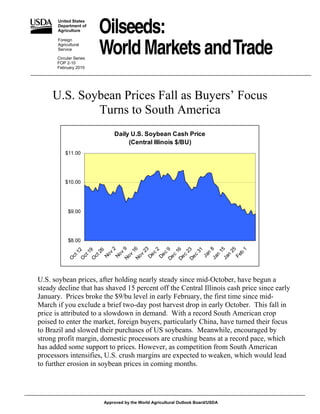
U.S. Soybean Prices Fall as Buyers’ Focus
Turns to South America
Daily U.S. Soybean Cash Price
(Central Illinois $/BU)
$11.00
$10.00
$9.00
$8.00
2
No 9
No 6
23
Ja 8
Ja 5
25
1
2
De 9
De 6
De 3
31
O 2
O 9
26
1
1
1
2
1
1
v
v
n
b
c
c
v
v
No
No
Ja
n
n
Fe
c
c
c
De
De
ct
ct
ct
O
U.S. soybean prices, after holding nearly steady since mid-October, have begun a
steady decline that has shaved 15 percent off the Central Illinois cash price since early
January. Prices broke the $9/bu level in early February, the first time since mid-
March if you exclude a brief two-day post harvest drop in early October. This fall in
price is attributed to a slowdown in demand. With a record South American crop
poised to enter the market, foreign buyers, particularly China, have turned their focus
to Brazil and slowed their purchases of US soybeans. Meanwhile, encouraged by
strong profit margin, domestic processors are crushing beans at a record pace, which
has added some support to prices. However, as competition from South American
processors intensifies, U.S. crush margins are expected to weaken, which would lead
to further erosion in soybean prices in coming months.
Approved by the World Agricultural Outlook Board/USDA
2. PRICES
U.S. soybean export bids, FOB Gulf, in U.S. Gulf Soybean Export Bids
the first week in February averaged $368 600
per ton, the lowest since February 2009.
U.S. Gulf/FOB ($/Metric ton)
Prospects of record crops in South 500
America and seasonal shift in China’s
buying demand resulted in lower export 400
bids.
300
As of the week-ending January 28, 2010,
U.S. soybean sales commitments 200
(outstanding sales plus accumulated
D 8
A 8
Fe 9
D 9
O 8
Ju 8
A 9
Ju 9
10
A 8
Fe 8
09
Au 9
-0
-0
0
-0
0
-0
-0
-0
0
-0
0
exports) to China totaled 21.5 million
b-
b-
b-
n-
g-
n-
ct
ct
pr
pr
ug
ec
ec
Fe
O
tons, compared to 13.9 million a year
ago. Total commitments to the world
amounted to 34.9 million tons compared to 24.4 million the same period last year.
TRADE CHANGES IN 2009/10
• U.S. soybean exports are up 0.7 million tons to a record 38.1 million supported by
strong shipments and sales to date primarily to China.
• Brazil’s soybean exports are up 1.3 million tons to 25.3 million with prospects of a
record exportable supplies and early-season export demand.
• Argentina’s soybean exports are cut 2.0 million tons to 7.9 million as an anticipated
quick start in exports by Brazil reduces competitiveness of Argentine beans.
• China’s soybean imports are up 0.5 million tons to 42.5 million due mainly to
stronger shipments from the U.S.
• Canada’s rapeseed exports are raised 0.3 million tons to 6.5 million in response to
strong exports, mainly to China.
• Ukraine’s rapeseed exports are up 0.2 million tons to 1.8 million supported by rising
demand in the EU.
3. Table 01: Major Oilseeds: World Supply and Distribution (Commodity View)
Million Metric Tons
Feb
2004/05 2005/06 2006/07 2007/08 2008/09 2009/10
none
Production none
Oilseed, Copra 5.60 5.60 5.27 5.72 5.88 5.88
Oilseed, Cottonseed 45.48 43.47 46.00 45.91 41.26 39.80
Oilseed, Palm Kernel 9.54 9.97 10.18 11.10 11.74 12.02
Oilseed, Peanut 33.61 33.22 30.72 32.39 34.15 30.81
Oilseed, Rapeseed 46.09 48.50 45.09 48.52 58.21 59.46
Oilseed, Soybean 215.78 220.67 237.12 221.14 210.86 255.02
Oilseed, Sunflowerseed 25.42 30.04 29.80 27.02 33.03 30.75
Total 381.51 391.45 404.18 391.79 395.13 433.73
none
Imports none
Oilseed, Copra 0.13 0.07 0.09 0.11 0.10 0.10
Oilseed, Cottonseed 0.98 1.10 0.84 0.75 0.55 0.63
Oilseed, Palm Kernel 0.12 0.15 0.13 0.14 0.13 0.13
Oilseed, Peanut 1.82 1.94 1.98 2.07 1.93 1.92
Oilseed, Rapeseed 5.02 6.68 7.01 7.57 12.20 9.77
Oilseed, Soybean 63.47 64.13 69.06 78.12 77.17 79.58
Oilseed, Sunflowerseed 1.13 1.39 1.75 1.25 1.80 1.68
Total 72.67 75.45 80.86 90.00 93.87 93.80
none
Exports none
Oilseed, Copra 0.14 0.10 0.13 0.13 0.11 0.12
Oilseed, Cottonseed 0.95 0.96 0.84 0.84 0.48 0.54
Oilseed, Palm Kernel 0.14 0.18 0.15 0.10 0.15 0.15
Oilseed, Peanut 2.31 2.25 2.43 2.37 2.25 2.11
Oilseed, Rapeseed 4.90 6.98 6.63 8.13 12.06 10.12
Oilseed, Soybean 64.75 63.80 71.31 79.53 76.79 81.39
Oilseed, Sunflowerseed 1.22 1.52 1.88 1.41 2.20 1.83
Total 74.42 75.79 83.36 92.51 94.04 96.26
none
Crush none
Oilseed, Copra 5.55 5.57 5.16 5.66 5.81 5.88
Oilseed, Cottonseed 33.30 32.06 33.70 34.37 32.00 31.08
Oilseed, Palm Kernel 9.45 9.90 10.04 11.01 11.57 11.97
Oilseed, Peanut 15.78 15.41 14.05 15.16 15.42 13.86
Oilseed, Rapeseed 40.58 44.62 43.62 46.66 52.05 56.16
Oilseed, Soybean 175.86 185.19 195.66 201.87 194.55 204.22
Oilseed, Sunflowerseed 22.42 26.01 26.09 24.11 28.65 27.67
Total 302.94 318.76 328.30 338.85 340.05 350.84
none
Ending Stocks none
Oilseed, Copra 0.08 0.05 0.10 0.11 0.14 0.09
Oilseed, Cottonseed 0.98 1.34 1.33 1.22 0.80 0.76
Oilseed, Palm Kernel 0.18 0.15 0.18 0.20 0.24 0.16
Oilseed, Peanut 1.62 1.86 1.30 1.09 1.55 1.18
Oilseed, Rapeseed 4.75 5.51 4.66 3.55 7.09 7.03
Oilseed, Soybean 47.47 53.21 62.89 52.95 41.64 59.73
Oilseed, Sunflowerseed 2.25 2.52 2.75 2.56 2.80 2.00
Total 57.32 64.63 73.20 61.68 54.26 70.95
Totals may not add due to rounding
Foreign Agricultural Service/USDA
Office of Global Analysis February 2010
4. Table 02: Major Protein Meals: World Supply and Distribution (Commodity View)
Million Metric Tons
Feb
2004/05 2005/06 2006/07 2007/08 2008/09 2009/10
none
Production none
Meal, Copra 1.82 1.81 1.68 1.85 1.90 1.92
Meal, Cottonseed 15.15 14.58 15.33 15.65 14.44 14.18
Meal, Fish 5.70 4.94 5.05 5.18 5.13 5.14
Meal, Palm Kernel 5.00 5.25 5.33 5.86 6.20 6.39
Meal, Peanut 6.11 5.98 5.46 5.93 6.02 5.40
Meal, Rapeseed 24.23 26.57 25.95 27.68 30.86 33.28
Meal, Soybean 139.07 145.82 153.93 158.42 152.95 160.64
Meal, Sunflowerseed 9.99 11.52 11.50 10.52 12.56 12.17
Total 207.07 216.46 224.22 231.09 230.07 239.11
none
Imports none
Meal, Copra 0.73 0.67 0.57 0.70 0.57 0.56
Meal, Cottonseed 0.48 0.48 0.44 0.42 0.34 0.35
Meal, Fish 3.59 2.94 2.68 3.01 2.97 2.85
Meal, Palm Kernel 3.67 3.77 3.80 4.23 3.93 3.94
Meal, Peanut 0.11 0.20 0.15 0.14 0.07 0.13
Meal, Rapeseed 2.30 2.56 3.05 3.56 3.56 3.54
Meal, Soybean 45.92 51.16 52.60 54.30 51.06 54.07
Meal, Sunflowerseed 2.57 3.30 3.41 2.85 4.08 3.61
Total 59.37 65.08 66.70 69.19 66.59 69.07
none
Exports none
Meal, Copra 0.74 0.78 0.70 0.85 0.53 0.59
Meal, Cottonseed 0.48 0.45 0.41 0.42 0.40 0.37
Meal, Fish 3.67 2.73 2.59 2.84 2.91 2.85
Meal, Palm Kernel 3.54 3.80 3.94 4.35 4.64 4.77
Meal, Peanut 0.15 0.25 0.19 0.14 0.17 0.12
Meal, Rapeseed 2.51 2.69 2.88 3.65 3.47 3.71
Meal, Soybean 47.68 51.78 53.97 55.78 52.03 55.12
Meal, Sunflowerseed 2.78 3.53 3.47 3.20 4.21 3.85
Total 61.54 66.02 68.16 71.23 68.36 71.37
none
Domestic Consumption none
Meal, Copra 1.80 1.69 1.53 1.67 1.91 1.93
Meal, Cottonseed 15.03 14.55 15.42 15.71 14.43 14.11
Meal, Fish 5.65 5.14 4.99 5.33 5.21 5.19
Meal, Palm Kernel 5.13 5.13 5.34 5.75 5.53 5.57
Meal, Peanut 6.09 5.93 5.42 5.93 5.92 5.42
Meal, Rapeseed 24.19 26.33 26.48 27.61 30.75 33.13
Meal, Soybean 136.69 145.54 152.24 157.33 152.55 159.42
Meal, Sunflowerseed 9.80 11.20 11.50 10.13 12.14 12.24
Total 204.40 215.51 222.92 229.45 228.44 237.00
none
Ending Stocks none
Meal, Copra 0.08 0.08 0.10 0.13 0.15 0.11
Meal, Cottonseed 0.22 0.27 0.22 0.15 0.11 0.16
Meal, Fish 0.15 0.15 0.30 0.32 0.31 0.26
Meal, Palm Kernel 0.23 0.33 0.17 0.16 0.13 0.12
Meal, Peanut 0.02 0.01 0.01 0.01 0.01 0.01
Meal, Rapeseed 0.48 0.59 0.24 0.21 0.42 0.40
Meal, Soybean 6.57 6.23 6.54 6.16 5.59 5.76
Meal, Sunflowerseed 0.17 0.27 0.21 0.24 0.54 0.23
Total 7.91 7.94 7.78 7.38 7.24 7.05
Totals may not add due to rounding
Foreign Agricultural Service/USDA
Office of Global Analysis February 2010
5. Table 03: Major Vegetable Oils: World Supply and Distribution (Commodity View)
Million Metric Tons
Feb
2004/05 2005/06 2006/07 2007/08 2008/09 2009/10
none
Production none
Oil, Coconut 3.46 3.46 3.22 3.53 3.63 3.67
Oil, Cottonseed 5.11 4.90 5.13 5.22 4.84 4.72
Oil, Olive 2.96 2.66 2.91 2.84 2.97 2.99
Oil, Palm 33.46 35.83 37.23 40.94 42.41 45.13
Oil, Palm Kernel 4.15 4.40 4.48 4.90 5.14 5.30
Oil, Peanut 5.08 4.97 4.51 4.90 4.97 4.47
Oil, Rapeseed 15.72 17.30 17.01 18.33 20.37 21.97
Oil, Soybean 32.63 34.62 36.36 37.54 36.09 37.75
Oil, Sunflowerseed 9.17 10.60 10.61 9.85 11.73 11.29
Total 111.74 118.72 121.45 128.05 132.14 137.29
none
Imports none
Oil, Coconut 1.86 1.99 1.88 1.93 1.61 1.83
Oil, Cottonseed 0.11 0.07 0.08 0.09 0.07 0.08
Oil, Olive 0.57 0.58 0.65 0.59 0.55 0.62
Oil, Palm 24.17 26.45 27.63 30.74 34.31 34.55
Oil, Palm Kernel 1.62 1.70 2.07 2.16 2.32 2.31
Oil, Peanut 0.17 0.16 0.18 0.15 0.14 0.16
Oil, Rapeseed 1.20 1.47 2.20 2.02 2.44 2.42
Oil, Soybean 8.88 9.09 9.93 10.40 8.85 8.91
Oil, Sunflowerseed 2.16 3.23 3.39 2.66 3.99 3.70
Total 40.73 44.74 48.01 50.73 54.29 54.57
none
Exports none
Oil, Coconut 2.07 2.08 1.74 1.93 1.52 1.86
Oil, Cottonseed 0.19 0.18 0.19 0.21 0.19 0.17
Oil, Olive 0.62 0.61 0.71 0.65 0.68 0.70
Oil, Palm 24.65 27.21 27.50 32.30 34.21 35.32
Oil, Palm Kernel 1.76 1.87 2.12 2.49 2.58 2.62
Oil, Peanut 0.16 0.20 0.16 0.15 0.20 0.16
Oil, Rapeseed 1.29 1.67 2.00 1.93 2.38 2.45
Oil, Soybean 9.17 9.84 10.57 10.87 9.06 9.34
Oil, Sunflowerseed 2.64 3.95 3.96 3.36 4.50 4.20
Total 42.56 47.60 48.94 53.88 55.32 56.82
none
Domestic Consumption none
Oil, Coconut 3.25 3.54 3.28 3.46 3.46 3.71
Oil, Cottonseed 4.90 4.84 5.01 5.09 4.79 4.64
Oil, Olive 2.78 2.72 2.88 2.92 2.95 2.93
Oil, Palm 32.68 34.97 37.06 39.42 41.79 44.17
Oil, Palm Kernel 3.95 4.20 4.54 4.49 4.83 4.97
Oil, Peanut 5.07 5.00 4.67 4.86 4.83 4.59
Oil, Rapeseed 15.53 16.93 17.45 18.41 19.92 21.62
Oil, Soybean 31.62 33.57 35.70 37.61 35.81 37.67
Oil, Sunflowerseed 8.52 9.81 10.30 8.94 10.75 11.18
Total 108.29 115.57 120.89 125.20 129.11 135.47
none
Ending Stocks none
Oil, Coconut 0.39 0.23 0.30 0.38 0.65 0.58
Oil, Cottonseed 0.25 0.21 0.22 0.24 0.17 0.15
Oil, Olive 1.23 1.14 1.12 0.98 0.86 0.83
Oil, Palm 3.77 3.87 4.17 4.12 4.85 5.04
Oil, Palm Kernel 0.45 0.48 0.38 0.46 0.51 0.54
Oil, Peanut 0.29 0.20 0.06 0.09 0.18 0.07
Oil, Rapeseed 0.49 0.66 0.41 0.43 0.94 1.25
Oil, Soybean 3.24 3.53 3.56 3.02 3.08 2.73
Oil, Sunflowerseed 0.74 0.81 0.56 0.76 1.23 0.84
Total 10.85 11.14 10.77 10.46 12.46 12.03
Totals may not add due to rounding
Foreign Agricultural Service/USDA
Office of Global Analysis February 2010
6. Table 04: Major Oilseeds: World Supply and Distribution (Country View)
Million Metric Tons
Feb
2004/05 2005/06 2006/07 2007/08 2008/09 2009/10
Production none
United States 95.94 95.67 96.84 82.45 89.20 98.98
Brazil 55.58 59.13 62.02 64.18 59.47 68.44
Argentina 43.43 45.03 53.16 51.71 35.69 56.15
China 58.35 56.80 55.23 53.35 57.79 54.46
India 29.40 30.70 29.92 33.95 33.70 32.25
Other 98.81 104.12 107.01 106.15 119.28 123.44
Total 381.51 391.45 404.18 391.79 395.13 433.73
Imports none
China 26.12 29.00 29.70 38.64 44.14 44.02
EU-27 16.00 15.91 17.16 17.03 18.01 16.32
Japan 6.82 6.55 6.55 6.52 5.77 6.40
Mexico 5.11 5.48 5.43 5.29 4.77 5.24
Taiwan 2.27 2.51 2.44 2.16 2.22 2.26
Turkey 1.50 1.75 1.94 2.14 1.65 1.90
Indonesia 1.26 1.38 1.51 1.42 1.62 1.80
Thailand 1.56 1.52 1.58 1.82 1.57 1.76
Egypt 0.77 0.78 1.34 1.08 1.59 1.52
Korea, South 1.41 1.37 1.41 1.38 1.31 1.34
Other 9.85 9.21 11.79 12.54 11.22 11.27
Total 72.67 75.45 80.86 90.00 93.87 93.80
Exports none
United States 30.71 26.61 31.65 33.05 35.80 39.04
Brazil 20.24 25.98 23.54 25.44 30.06 25.38
Canada 4.65 6.79 7.26 7.64 10.00 8.59
Argentina 10.08 7.83 10.23 14.40 6.14 8.37
Paraguay 2.94 2.44 4.40 5.53 2.54 5.42
Ukraine 0.13 0.63 1.24 1.17 3.68 2.72
Uruguay 0.58 0.65 0.78 0.84 1.00 1.57
Other 5.10 4.87 4.27 4.44 4.81 5.19
Total 74.42 75.79 83.36 92.51 94.04 96.26
Crush none
China 60.54 64.97 65.28 68.47 72.88 76.32
United States 50.17 51.90 53.48 53.50 49.35 50.59
EU-27 33.38 34.23 36.32 38.05 39.41 41.09
Argentina 31.41 35.93 36.95 39.23 35.74 38.30
Brazil 31.34 30.01 33.48 34.65 34.68 33.75
India 23.57 25.10 24.62 27.56 26.44 26.46
Russia 5.15 6.51 7.16 6.71 8.30 8.50
Indonesia 5.15 5.58 5.74 6.20 6.73 6.92
Ukraine 3.34 4.98 5.39 4.69 6.96 6.62
Canada 4.58 4.92 5.10 5.53 5.57 5.88
Mexico 5.51 5.85 5.70 5.64 5.19 5.57
Pakistan 5.41 5.10 5.16 4.78 5.04 5.26
Malaysia 4.65 4.72 4.40 4.97 5.01 5.18
Japan 5.42 5.12 5.17 5.17 4.73 4.97
Philippines 2.63 2.57 2.32 2.70 2.62 2.76
Other 30.70 31.27 32.04 31.02 31.41 32.70
Total 302.94 318.76 328.30 338.85 340.05 350.84
Ending Stocks none
Argentina 17.41 17.71 24.06 23.52 17.25 25.14
Brazil 16.68 16.67 18.32 19.07 10.62 16.90
China 4.70 4.57 2.70 4.25 10.40 11.49
United States 8.29 14.20 17.02 6.91 5.62 7.07
EU-27 3.13 3.10 3.22 2.06 3.16 3.28
Other 7.11 8.37 7.88 5.87 7.21 7.07
Total 57.32 64.63 73.20 61.68 54.26 70.95
Major Oilseeds includes Copra, Cottonseed, Palm Kernel, Peanut, Rapeseed, Soybeans and Sunflowerseeds.
Foreign Agricultural Service/USDA
Office of Global Analysis February 2010
7. Table 05: Major Protein Meals: World Supply and Distribution (Country View)
Million Metric Tons
Feb
2004/05 2005/06 2006/07 2007/08 2008/09 2009/10
Production none
China 39.69 43.18 43.55 46.09 49.00 52.07
United States 39.26 39.94 41.49 40.90 37.78 38.99
Argentina 23.37 26.77 27.53 29.05 26.59 28.90
EU-27 22.48 22.85 24.29 25.35 25.69 26.58
Brazil 23.71 22.76 25.26 26.12 26.25 25.54
Other 58.55 60.96 62.11 63.57 64.75 67.04
Total 207.07 216.46 224.22 231.09 230.07 239.11
Imports none
EU-27 27.29 28.30 27.02 28.55 26.60 27.55
Korea, South 2.68 2.91 3.15 3.32 3.18 3.15
Indonesia 2.02 2.25 2.41 2.63 2.54 2.80
Vietnam 1.35 1.93 2.63 2.69 2.57 2.78
Thailand 2.02 2.43 2.64 2.28 2.59 2.63
Japan 1.94 2.07 2.17 2.11 2.23 2.09
United States 1.52 1.66 1.70 1.98 1.85 2.04
Other 20.56 23.56 24.98 25.64 25.02 26.03
Total 59.37 65.08 66.70 69.19 66.59 69.07
Exports none
Argentina 21.79 25.22 26.42 27.89 24.81 27.65
Brazil 14.26 12.91 12.72 12.15 13.00 12.00
United States 6.97 7.61 8.26 8.71 7.95 9.38
India 2.72 4.69 4.46 6.04 3.96 4.08
Indonesia 1.84 2.18 2.10 2.39 2.68 2.73
Malaysia 2.00 1.87 2.10 2.17 2.12 2.21
Ukraine 0.89 1.37 1.51 1.30 2.27 2.06
Other 11.09 10.17 10.61 10.59 11.58 11.27
Total 61.54 66.02 68.16 71.23 68.36 71.37
Domestic Consumption none
EU-27 48.83 49.98 50.45 52.90 52.05 53.25
China 40.67 44.81 43.95 47.26 49.43 52.76
United States 33.87 33.84 34.90 34.22 31.76 31.56
Brazil 9.93 10.15 12.27 13.48 13.49 13.74
India 9.60 9.83 10.02 10.15 10.64 11.31
Japan 5.99 5.91 5.99 5.97 5.74 5.79
Mexico 5.35 6.04 6.04 5.51 5.33 5.60
Thailand 3.73 4.05 4.25 4.10 4.34 4.43
Korea, South 3.47 3.60 3.99 4.04 4.02 3.95
Russia 2.39 2.69 3.11 3.25 3.39 3.53
Other 40.59 44.63 47.95 48.57 48.25 51.08
Total 204.40 215.51 222.92 229.45 228.44 237.00
SME none
China 38.75 42.56 41.78 45.36 47.19 50.38
EU-27 44.85 45.79 46.43 48.51 47.16 48.10
United States 33.19 33.14 34.22 33.45 31.03 30.82
Brazil 9.76 10.00 12.06 13.27 13.30 13.55
India 8.34 8.48 8.64 8.97 9.36 9.82
Japan 5.89 5.83 5.89 5.86 5.60 5.65
Mexico 5.07 5.71 5.74 5.16 5.01 5.25
Other 47.15 51.81 55.56 55.85 55.95 58.84
Total 192.99 203.32 210.32 216.43 214.59 222.42
Ending Stocks none
Brazil 1.58 1.48 1.93 2.60 2.46 2.42
Argentina 1.47 1.78 1.56 1.30 1.67 1.49
India 1.15 0.81 0.45 0.12 0.68 0.64
EU-27 1.09 1.11 1.07 1.25 0.55 0.63
United States 0.22 0.36 0.39 0.33 0.25 0.33
Other 2.41 2.40 2.38 1.77 1.64 1.54
Total 7.91 7.94 7.78 7.38 7.24 7.05
Major Protien Meals include Copra, Cottonseed, Fish, Palm Kernel, Peanut, Rapeseed, Soybean, and Sunflower Meal.
Foreign Agricultural Service/USDA
Office of Global Analysis February 2010
8. Table 06: Major Vegetable Oils: World Supply and Distribution (Country View)
Million Metric Tons
Feb
2004/05 2005/06 2006/07 2007/08 2008/09 2009/10
Production none
Indonesia 16.05 18.25 19.37 20.98 22.73 24.05
Malaysia 17.15 17.50 17.20 19.73 19.41 20.74
China 13.83 14.76 14.27 14.69 16.02 16.72
EU-27 12.62 12.80 13.66 14.28 15.42 16.17
United States 9.75 10.38 10.41 10.53 9.65 9.76
Argentina 6.82 7.63 7.71 8.48 7.65 7.95
India 6.47 6.85 6.43 7.01 6.80 6.81
Other 29.07 30.55 32.42 32.36 34.48 35.10
Total 111.74 118.72 121.45 128.05 132.14 137.29
Imports none
China 6.65 6.96 8.50 8.76 9.77 9.70
EU-27 6.80 8.21 9.11 8.80 8.84 8.34
India 5.68 4.86 5.44 5.93 8.76 8.28
United States 1.84 2.38 2.53 3.11 3.23 3.26
Pakistan 1.63 1.72 2.25 2.28 2.24 2.28
Egypt 0.98 1.23 1.20 1.27 1.58 1.55
Malaysia 0.76 1.23 0.85 1.17 1.27 1.34
Iran 1.17 1.18 1.21 1.28 1.10 1.26
Bangladesh 0.99 1.12 1.23 1.13 1.00 1.10
Turkey 0.76 1.25 0.61 0.84 0.82 0.95
Other 13.46 14.61 15.10 16.16 15.67 16.52
Total 40.73 44.74 48.01 50.73 54.29 54.57
Exports none
Indonesia 11.43 13.47 13.39 16.07 16.78 17.94
Malaysia 13.53 13.71 13.73 15.73 17.02 16.83
Argentina 5.99 6.89 6.87 7.05 5.76 6.10
Ukraine 0.74 1.61 1.89 1.35 2.16 2.15
United States 0.84 0.90 1.33 1.68 1.46 1.84
Canada 0.98 1.12 1.30 1.36 1.57 1.58
Brazil 2.54 2.55 2.50 2.44 1.96 1.47
Other 6.50 7.34 7.94 8.21 8.62 8.91
Total 42.56 47.60 48.94 53.88 55.32 56.82
Domestic Consumption none
China 20.50 21.51 22.56 23.34 24.65 26.18
EU-27 17.93 20.13 21.70 22.08 22.64 23.29
India 11.56 12.11 11.91 12.98 14.69 15.36
United States 10.43 11.19 11.66 12.23 11.21 11.47
Indonesia 4.96 5.24 5.35 5.47 5.89 6.11
Brazil 3.53 3.67 4.15 4.73 5.09 5.57
Malaysia 4.16 4.54 4.87 4.64 4.36 4.99
Pakistan 2.68 2.81 3.44 3.40 3.43 3.49
Russia 2.71 2.71 2.83 3.11 3.05 3.06
Japan 2.26 2.19 2.19 2.23 2.13 2.21
Argentina 0.77 0.80 1.00 1.40 1.83 2.09
Mexico 1.91 2.01 2.01 2.02 1.96 2.06
Egypt 1.17 1.38 1.51 1.50 1.74 1.83
Nigeria 1.61 1.64 1.73 1.76 1.76 1.79
Turkey 1.55 1.78 1.73 1.71 1.66 1.69
Other 20.59 21.88 22.26 22.61 23.02 24.27
Total 108.29 115.57 120.89 125.20 129.11 135.47
Ending Stocks none
EU-27 2.04 1.96 1.99 1.84 2.19 2.36
Malaysia 1.79 2.26 1.71 2.24 1.54 1.80
United States 1.12 1.80 1.74 1.46 1.68 1.39
China 0.25 0.20 0.25 0.23 1.26 1.36
Indonesia 1.11 0.72 1.41 0.90 0.99 1.02
Other 4.55 4.20 3.67 3.79 4.81 4.11
Total 10.85 11.14 10.77 10.46 12.46 12.03
Major Vegetable Oils includes Coconut, Cottonseed, Olive, Palm, Palm Kernel, Peanut, Rapeseed, Soybean, and Sunflowerseed oil.
Foreign Agricultural Service/USDA
Office of Global Analysis February 2010
9. Table 07: Soybeans: World Supply and Distribution
Thousand Metric Tons
Feb
2004/05 2005/06 2006/07 2007/08 2008/09 2009/10
Production none
United States 85,019 83,507 87,001 72,859 80,749 91,472
Brazil 53,000 57,000 59,000 61,000 57,000 66,000
Argentina 39,000 40,500 48,800 46,200 32,000 53,000
China 17,400 16,350 15,967 14,000 15,500 14,500
India 5,850 7,000 7,690 9,470 9,100 8,800
Paraguay 4,040 3,640 5,856 6,900 3,900 7,100
Canada 3,042 3,161 3,466 2,696 3,336 3,500
Other 8,426 9,512 9,337 8,016 9,278 10,645
Total 215,777 220,670 237,117 221,141 210,863 255,017
Imports none
China 25,802 28,317 28,726 37,816 41,098 42,500
EU-27 14,539 13,937 15,291 15,123 13,213 13,000
Japan 4,295 3,962 4,094 4,014 3,396 3,950
Mexico 3,640 3,667 3,844 3,584 3,327 3,500
Taiwan 2,256 2,498 2,436 2,148 2,216 2,250
Thailand 1,517 1,473 1,532 1,753 1,510 1,705
Indonesia 1,112 1,187 1,309 1,147 1,393 1,600
Egypt 762 776 1,328 1,061 1,575 1,500
Turkey 858 1,078 1,268 1,277 974 1,280
Korea, South 1,240 1,190 1,231 1,232 1,167 1,200
Other 7,452 6,044 8,003 8,966 7,301 7,090
Total 63,473 64,129 69,062 78,121 77,170 79,575
Exports none
United States 29,860 25,579 30,386 31,538 34,925 38,102
Brazil 20,137 25,911 23,485 25,364 29,986 25,300
Argentina 9,568 7,249 9,559 13,837 5,588 7,850
Paraguay 2,882 2,380 4,361 5,400 2,400 5,300
Canada 1,124 1,326 1,683 1,753 2,017 2,000
Other 1,181 1,359 1,836 1,634 1,878 2,837
Total 64,752 63,804 71,310 79,526 76,794 81,389
Crush none
United States 46,160 47,324 49,198 49,081 45,232 46,811
China 30,362 34,500 35,970 39,518 41,035 44,930
Argentina 27,313 31,888 33,586 34,607 31,911 35,300
Brazil 29,344 28,285 31,109 32,114 32,512 31,600
EU-27 14,350 13,670 14,670 14,870 12,860 12,500
India 5,030 5,990 6,615 8,170 7,500 7,600
Mexico 3,729 3,823 3,900 3,620 3,465 3,560
Japan 3,149 2,820 2,925 2,890 2,496 2,750
Taiwan 2,013 2,190 2,161 1,965 1,917 1,970
Russia 546 675 805 1,051 1,497 1,830
Paraguay 1,078 1,181 1,355 1,400 1,500 1,550
Thailand 1,500 1,413 1,406 1,514 1,425 1,497
Egypt 721 800 1,250 1,129 1,545 1,480
Bolivia 1,815 1,843 1,670 1,160 1,350 1,410
Canada 1,545 1,497 1,524 1,383 1,286 1,375
Other 7,201 7,289 7,515 7,402 7,019 8,056
Total 175,856 185,188 195,659 201,874 194,550 204,219
Ending Stocks none
Argentina 15,976 16,473 22,606 21,760 16,186 24,400
Brazil 16,658 16,641 18,190 18,902 10,547 16,847
China 4,700 4,573 2,700 4,245 9,008 10,048
United States 6,960 12,229 15,617 5,580 3,761 5,715
EU-27 757 733 1,118 814 560 750
Other 2,422 2,558 2,654 1,646 1,576 1,967
Total 47,473 53,207 62,885 52,947 41,638 59,727
Most countries are on an October/September Marketing Year (MY). The United States, Mexico, and Thailand are on a September/August
MY. Canada is on an August/July MY. Paraguay is on a March/February MY and Turkey is on an March/February MY.
Foreign Agricultural Service/USDA
Office of Global Analysis February 2010
10. Table 08: Soybean Meal: World Supply and Distribution
Thousand Metric Tons
Feb
2004/05 2005/06 2006/07 2007/08 2008/09 2009/10
Production none
United States 36,936 37,416 39,037 38,360 35,475 36,764
China 24,026 27,296 28,465 31,280 32,475 35,558
Argentina 21,601 25,012 26,061 27,070 24,954 27,600
Brazil 22,740 21,920 24,110 24,890 25,200 24,500
EU-27 11,300 10,760 11,550 11,715 10,131 9,848
India 4,015 4,782 5,280 6,521 5,985 6,065
Mexico 2,958 3,015 3,075 2,814 2,727 2,800
Other 15,496 15,615 16,353 15,774 16,007 17,508
Total 139,072 145,816 153,931 158,424 152,954 160,643
Imports none
EU-27 21,910 22,829 22,213 24,074 20,980 22,800
Indonesia 1,849 2,071 2,237 2,429 2,339 2,600
Vietnam 1,152 1,722 2,373 2,439 2,300 2,500
Thailand 1,730 2,042 2,275 1,935 2,160 2,208
Korea, South 1,462 1,773 1,870 1,760 1,813 1,850
Japan 1,503 1,601 1,737 1,747 1,812 1,700
Mexico 1,251 1,728 1,780 1,382 1,497 1,450
Philippines 1,377 1,374 1,357 1,213 1,200 1,450
Canada 1,145 1,342 1,415 1,511 1,251 1,345
Venezuela 757 826 860 1,063 1,050 1,100
Other 11,781 13,852 14,484 14,748 14,658 15,066
Total 45,917 51,160 52,601 54,301 51,060 54,069
Exports none
Argentina 20,650 24,222 25,625 26,816 23,998 26,950
Brazil 14,256 12,895 12,715 12,138 13,000 12,000
United States 6,659 7,301 7,987 8,384 7,718 9,072
India 1,794 3,679 3,461 4,790 3,158 3,200
Paraguay 1,082 644 797 1,117 1,167 1,064
Other 3,239 3,040 3,388 2,530 2,992 2,835
Total 47,680 51,781 53,973 55,775 52,033 55,121
Domestic Consumption none
China 23,437 27,776 27,630 30,849 31,673 34,928
EU-27 32,680 32,875 33,228 35,169 31,579 32,020
United States 30,446 30,114 31,166 30,148 27,891 27,760
Brazil 8,960 9,328 11,118 12,257 12,440 12,700
Mexico 4,208 4,751 4,871 4,220 4,170 4,300
Japan 3,978 3,846 3,992 4,007 3,769 3,848
Thailand 2,936 3,183 3,348 3,229 3,275 3,373
India 1,426 1,525 1,852 2,056 2,483 2,890
Indonesia 1,839 2,085 2,236 2,420 2,333 2,600
Korea, South 2,196 2,381 2,661 2,515 2,552 2,549
Vietnam 1,152 1,722 2,373 2,439 2,300 2,500
Canada 2,286 2,392 2,476 2,485 2,185 2,300
Iran 1,113 1,504 1,612 1,873 1,824 1,938
Russia 960 1,140 1,444 1,560 1,646 1,770
Taiwan 1,700 1,800 1,750 1,555 1,609 1,644
Other 17,375 19,119 20,487 20,546 20,821 22,301
Total 136,692 145,541 152,244 157,328 152,550 159,421
Ending Stocks none
Brazil 1,577 1,469 1,913 2,588 2,453 2,405
Argentina 1,423 1,647 1,504 1,138 1,464 1,441
India 880 459 429 106 452 429
EU-27 859 872 859 1,065 130 358
United States 156 285 311 267 213 272
Other 1,677 1,494 1,525 999 882 859
Total 6,572 6,226 6,541 6,163 5,594 5,764
Most countries are on an October/September Marketing Year (MY). The Mexico and Thailand are on a September/August MY. Canada is
on an August/July MY. Paraguay is on a March/February MY. Vietnam and the Philippines are on a January/December MY and Bolivia is
on a March/February MY.
Foreign Agricultural Service/USDA
Office of Global Analysis February 2010
11. Table 09: Soybean Oil: World Supply and Distribution
Thousand Metric Tons
Feb
2004/05 2005/06 2006/07 2007/08 2008/09 2009/10
Production none
United States 8,782 9,248 9,294 9,335 8,503 8,691
China 5,421 6,149 6,410 7,045 7,314 8,008
Argentina 5,128 5,998 6,424 6,627 6,124 6,775
Brazil 5,630 5,430 5,970 6,160 6,240 6,060
EU-27 2,575 2,460 2,640 2,667 2,314 2,250
India 900 1,070 1,180 1,458 1,340 1,362
Mexico 635 670 685 636 609 626
Other 3,560 3,590 3,756 3,615 3,643 3,979
Total 32,631 34,615 36,359 37,543 36,087 37,751
Imports none
China 1,728 1,516 2,404 2,727 2,494 2,400
India 2,026 1,727 1,447 733 1,060 890
EU-27 181 717 991 1,040 793 600
Morocco 318 372 360 421 350 360
Algeria 270 310 295 366 325 350
Egypt 173 240 124 482 320 350
Iran 741 600 606 545 260 350
Venezuela 247 285 351 363 320 340
Bangladesh 228 262 327 406 253 300
Korea, South 244 265 302 296 266 300
Other 2,727 2,797 2,722 3,016 2,413 2,668
Total 8,883 9,091 9,929 10,395 8,854 8,908
Exports none
Argentina 4,757 5,597 5,970 5,786 4,707 5,175
United States 600 523 851 1,320 995 1,474
Brazil 2,414 2,466 2,462 2,388 1,910 1,425
Paraguay 112 195 258 299 243 250
EU-27 525 269 243 333 399 190
Bolivia 238 243 231 141 176 181
Russia 0 1 5 10 127 110
Other 525 550 546 592 506 535
Total 9,171 9,844 10,566 10,869 9,063 9,340
Domestic Consumption none
China 7,203 7,607 8,670 9,693 9,486 10,346
United States 7,911 8,147 8,426 8,317 7,432 7,485
Brazil 3,060 3,113 3,395 3,920 4,274 4,755
EU-27 2,210 2,915 3,368 3,377 2,779 2,610
India 2,627 2,933 2,600 2,300 2,330 2,243
Argentina 396 397 569 997 1,405 1,645
Mexico 781 792 820 839 800 815
Egypt 296 345 379 659 605 612
Japan 639 573 577 573 512 545
Iran 804 775 725 685 401 528
Korea, South 406 418 436 444 447 445
Morocco 429 444 445 475 423 428
Venezuela 279 295 355 378 340 360
Algeria 270 310 295 366 325 350
Taiwan 405 396 395 382 360 350
Other 3,899 4,107 4,243 4,203 3,895 4,149
Total 31,615 33,567 35,698 37,608 35,814 37,666
Ending Stocks none
United States 771 1,365 1,399 1,127 1,244 1,010
China 247 200 250 227 466 428
Brazil 514 393 510 429 490 420
India 386 232 250 132 193 193
EU-27 201 194 214 211 140 190
Other 1,117 1,147 932 890 547 492
Total 3,236 3,531 3,555 3,016 3,080 2,733
Most countries are on an October/September Marketing Year (MY). Mexico is on a September/August MY. Peru is on an
January/December MY and Paraguay and Bolivia are on a March/February MY.
Foreign Agricultural Service/USDA
Office of Global Analysis February 2010
12. Table 10: Soybeans and Products: World Trade
Thousand Metric Tons
Meal, Soybean Oil, Soybean Oilseed, Soybean
Marketing Year 2007/08 2008/09 2009/10 2007/08 2008/09 2009/10 2007/08 2008/09 2009/10
Exports
North America 8 7,806 9,203 2 1,034 1,516 0 36,942 40,102
Canada (Aug-Jul) 120 82 124 50 38 40 1,753 2,017 2,000
United States (Sep-Aug) 8,384 7,718 9,072 1,320 995 1,474 31,538 34,925 38,102
South America 14,106 1,167 41,064 2,847 243 7,050 45,480 2,400 40,137
Argentina (Oct-Sep) 26,816 23,998 26,950 5,786 4,707 5,175 13,837 5,588 7,850
Brazil (Oct-Sep) 12,138 13,000 12,000 2,388 1,910 1,425 25,364 29,986 25,300
Paraguay (Mar-Feb) 1,117 1,167 1,064 299 243 250 5,400 2,400 5,300
South Asia 1 1 3,201 0 0 9 0 0 5
India (Oct-Sep) 4,790 3,158 3,200 9 9 9 12 5 5
Other 41,660 43,059 1,653 8,020 7,786 765 34,046 37,452 1,145
World Total 55,775 52,033 55,121 10,869 9,063 9,340 79,526 76,794 81,389
Imports
European Union 0 0 22,800 0 0 600 0 0 13,000
East Asia 230 1,813 3,860 417 332 2,865 5,288 1,167 49,945
China (Oct-Sep) 203 215 200 2,727 2,494 2,400 37,816 41,098 42,500
Japan (Oct-Sep) 1,747 1,812 1,700 42 39 50 4,014 3,396 3,950
Korea, South (Oct-Sep) 1,760 1,813 1,850 296 266 300 1,232 1,167 1,200
Taiwan (Oct-Sep) 22 113 100 40 11 12 2,148 2,216 2,250
Southeast Asia 4,092 8,954 9,730 112 226 255 1,267 0 4,208
Indonesia (Oct-Sep) 2,429 2,339 2,600 21 13 15 1,147 1,393 1,600
Malaysia (Oct-Sep) 924 934 950 123 102 117 504 530 558
Philippines (Jan-Dec) 1,213 1,200 1,450 3 2 5 41 35 125
Thailand (Sep-Aug) 1,935 2,160 2,208 1 1 1 1,753 1,510 1,705
Vietnam (Jan-Dec) 2,439 2,300 2,500 91 72 80 120 175 200
North America 1,382 2,828 2,922 110 245 288 578 4,074 4,094
Canada (Aug-Jul) 1,511 1,251 1,345 80 45 59 309 386 376
Mexico (Sep-Aug) 1,382 1,497 1,450 236 159 195 3,584 3,327 3,500
South America 3 19 4,384 0 4 1,011 3,757 15 776
Brazil (Oct-Sep) 180 105 152 67 5 50 150 43 150
Colombia (Oct-Sep) 882 825 875 184 170 185 265 290 263
Central America 274 435 926 87 40 171 232 0 236
Caribbean 790 0 800 274 79 261 0 25 185
Middle East 25 245 3,355 52 36 493 3,312 2,704 3,550
Iran (Oct-Sep) 891 1,044 920 545 260 350 1,036 783 1,070
Israel (Oct-Sep) 63 84 80 14 10 14 481 326 450
Syria (Jan-Dec) 404 617 615 19 5 5 361 559 525
Turkey (Nov-Oct) 356 399 400 27 10 20 1,277 974 1,280
North Africa 1,598 1,621 1,640 421 470 1,190 1,470 1,961 1,925
Egypt (Oct-Sep) 135 279 250 482 320 350 1,061 1,575 1,500
Other 45,907 35,145 3,652 8,922 7,422 1,774 62,217 67,224 1,656
World Total 54,301 51,060 54,069 10,395 8,854 8,908 78,121 77,170 79,575
Foreign Agricultural Service/USDA
Office of Global Analysis February 2010
13. Table 11: Palm Oil: World Supply and Distribution
Thousand Metric Tons
Feb
2004/05 2005/06 2006/07 2007/08 2008/09 2009/10
Production none
Indonesia 13,560 15,560 16,600 18,000 19,500 20,750
Malaysia 15,194 15,485 15,290 17,567 17,259 18,500
Thailand 820 784 1,170 1,050 1,200 1,300
Nigeria 790 800 810 820 820 820
Colombia 647 690 770 830 760 780
Other 2,451 2,509 2,593 2,669 2,873 2,982
Total 33,462 35,828 37,233 40,936 42,412 45,132
Imports none
India 3,525 2,899 3,650 5,015 6,867 6,650
China 4,319 4,975 5,139 5,223 6,118 6,300
EU-27 4,028 4,272 4,407 4,694 5,150 4,800
Pakistan 1,565 1,703 2,218 2,219 2,200 2,250
United States 349 596 702 952 1,036 998
Bangladesh 757 847 898 724 748 800
Egypt 616 754 767 571 850 800
Iran 351 485 388 708 570 750
Malaysia 338 746 300 462 700 700
Japan 492 494 516 551 531 570
Other 7,827 8,679 8,640 9,618 9,544 9,936
Total 24,167 26,450 27,625 30,737 34,314 34,554
Exports none
Malaysia 12,684 12,931 12,900 14,644 16,000 15,800
Indonesia 9,621 11,696 11,419 13,969 14,650 15,680
Benin 24 160 198 450 475 500
Papua New Guinea 321 327 357 389 396 419
United Arab Emirates 268 315 358 350 350 350
Other 1,729 1,776 2,271 2,495 2,339 2,574
Total 24,647 27,205 27,503 32,297 34,210 35,323
Domestic Consumption none
India 3,406 3,124 3,671 5,065 6,475 6,800
China 4,318 4,974 5,138 5,222 5,618 6,330
Indonesia 4,025 4,255 4,542 4,664 4,875 5,005
EU-27 3,916 4,151 4,256 4,392 4,693 4,648
Malaysia 2,659 2,926 3,109 2,886 2,620 3,140
Pakistan 1,560 1,708 2,218 2,219 2,200 2,250
Nigeria 1,085 1,085 1,155 1,190 1,190 1,205
United States 328 564 663 948 959 992
Thailand 756 671 694 747 890 960
Bangladesh 747 806 880 790 745 800
Egypt 616 754 767 571 725 800
Iran 348 483 386 657 619 749
Colombia 437 492 483 531 563 565
Japan 492 499 521 551 531 565
Vietnam 198 326 415 428 455 510
Other 7,788 8,156 8,163 8,561 8,631 8,851
Total 32,679 34,974 37,061 39,422 41,789 44,170
Ending Stocks none
Malaysia 1,507 1,881 1,462 1,961 1,300 1,560
Indonesia 1,053 702 1,363 750 745 830
EU-27 200 220 204 368 690 662
China 0 0 0 0 499 468
India 208 20 47 47 489 389
Other 804 1,048 1,089 993 1,123 1,130
Total 3,772 3,871 4,165 4,119 4,846 5,039
Foreign Agricultural Service/USDA
Office of Global Analysis February 2010