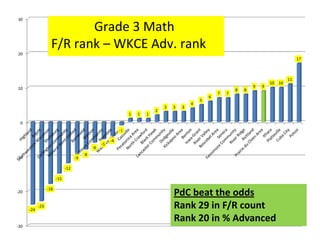
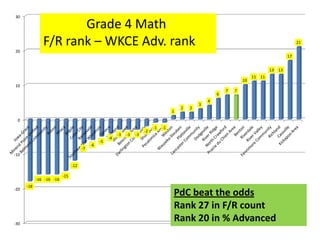
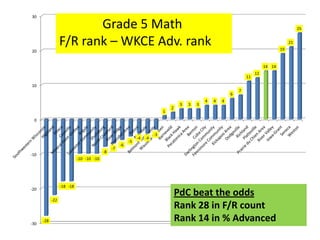
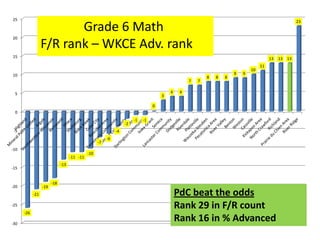
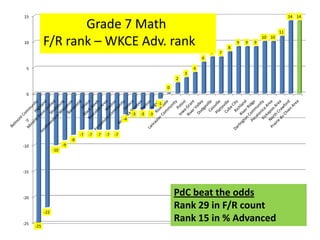
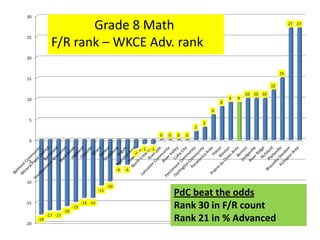
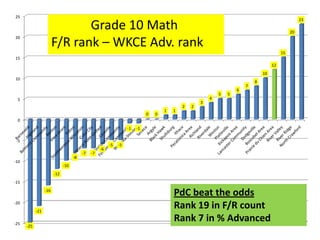
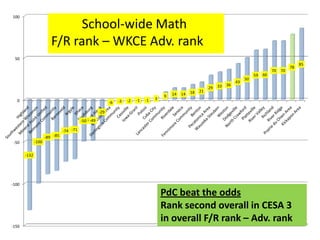
This document analyzes test score and poverty rate data from schools in CESA 3 to identify schools that may be "beating the odds". It ranks schools based on their free/reduced lunch counts and their percentages of students scoring advanced on math tests. Subtracting these ranks identifies schools with higher than expected test scores given their poverty levels. The document provides these rankings for each grade level and school-wide to help identify programs from schools that are exceeding expectations. It notes this is not a scientific analysis but may provide useful information for planning or program comparisons.