1) This document provides a primer on basic economic principles and terms used in analyzing economic data and conditions. It defines key macroeconomic indicators such as GDP, inflation measures, employment data, and factors that influence economic growth.
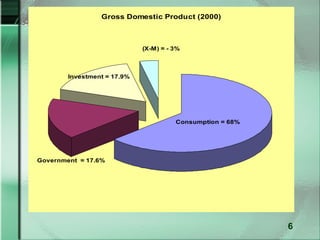
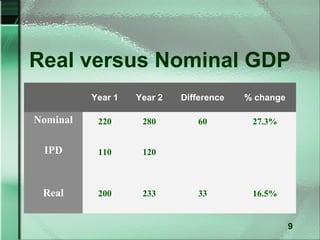
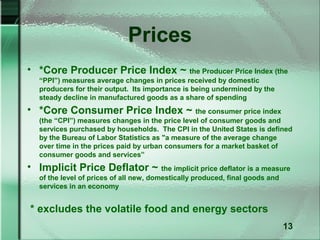
2) Specific economic metrics are explained, including how to calculate GDP components, the consumer price index, producer price index, real versus nominal values, and employment surveys.
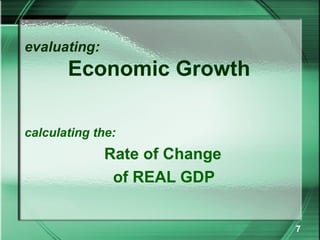
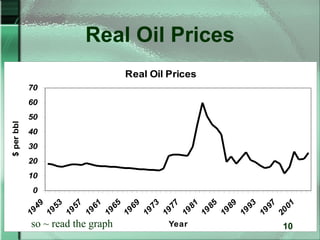
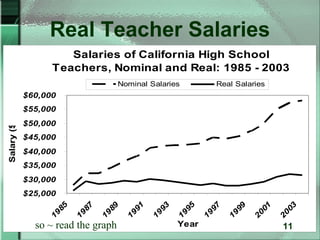
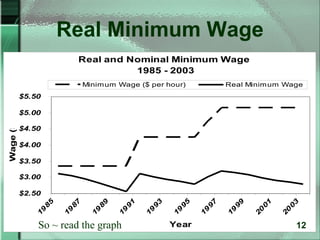
3) Various charts are presented to illustrate real GDP, oil prices, wages, and other economic time series data over time to demonstrate how to read and interpret macroeconomic trends.

![Mentally calculating the
Rate of Change
[as a %age]
New(n) – Old(o)
Old(o)
as an example:
600 – 500 = 0.2 = 20%
500
2](https://image.slidesharecdn.com/mpp017a-guide-2-readings-economics-15-130319125438-phpapp01/85/Mpp-017-a-guide-2-readings-economics-15-2-320.jpg)