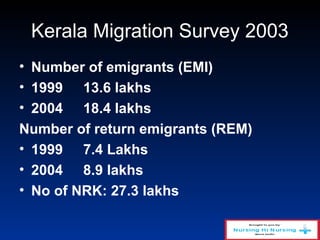
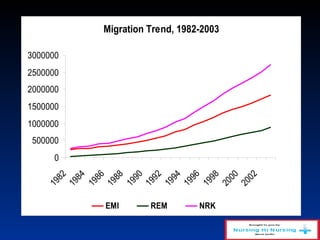
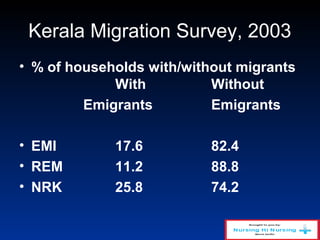
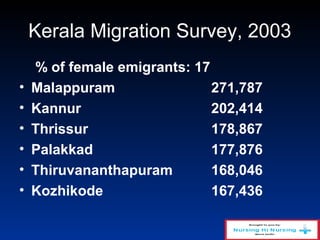
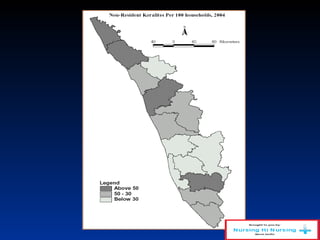
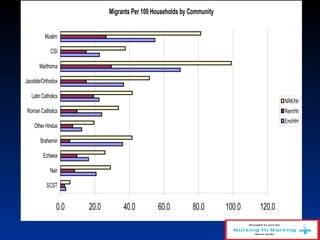
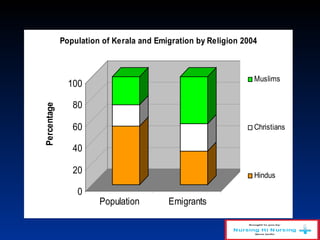
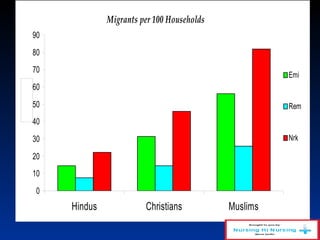
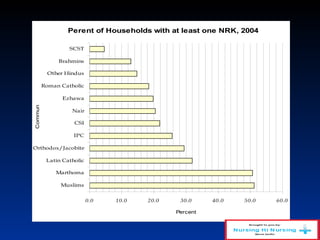
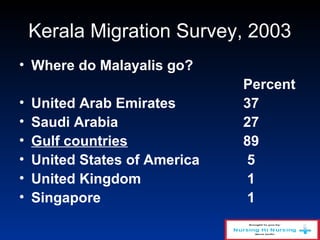
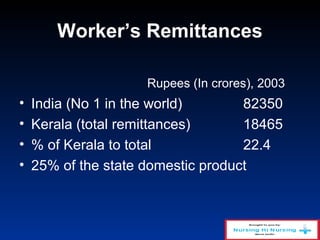
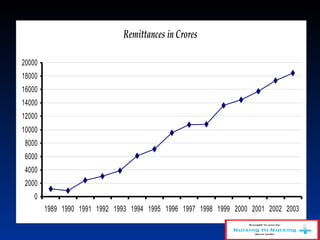
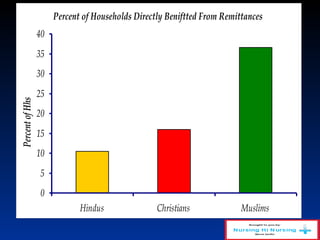
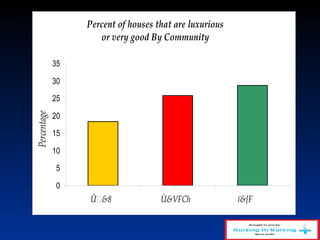
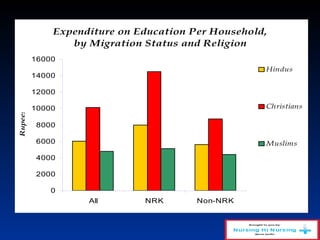
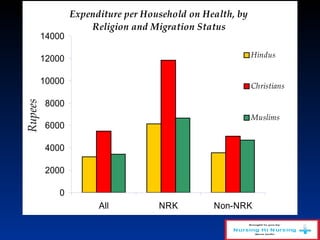
INTERNATIONAL MIGRATION AND DEVELOPMENT IN KERALAINTERNATIONAL MIGRATION AND DEVELOPMENT IN KERALA
Dr S IRUDAYA RAJAN
Chair Professor
CDS, Kerala
• Total Population of Kerala: 31 million
• Until 1956 (Kerala came into existence
from 1st
November 1956), Kerala was
an in-migrating state
• From 1961, Kerala is an out-migrating
state, even today
• Kerala is ahead of India in terms of
fertility, infant mortality and literacy
• As Keralites were ahead of literacy than other
parts of the country, most of the literates
migrated to other parts of India where there is a
demand of educated (teachers, nurses,
accountants and other services)
• As long as, they were accustomed to mobility
within India, when the oil boom begun in Gulf,
they were the first to emigrate to Gulf.
• In India, we have good statistics on inter-state
migration based on census and the data on
international migration is only a guesstimate.
• To study the Impact on International
migration on Kerala’s economy and
society, we have undertaken three major
surveys in Kerala
• Kerala Migration Survey, 1998 (10000
households)
• Kerala Migration Survey, 2003 (10000)
• Kerala Migration Survey, 2007 (Progress)
• Kerala Migration Survey, 2008 (Proposed)
Kerala Migration Survey 2003
• Number of emigrants (EMI)
• 1999 13.6 lakhs
• 2004 18.4 lakhs
Number of return emigrants (REM)
• 1999 7.4 Lakhs
• 2004 8.9 lakhs
• No of NRK: 27.3 lakhs
Migration Trend, 1982-2003
0
500000
1000000
1500000
2000000
2500000
30000001982
1984
1986
1988
1990
1992
1994
1996
1998
2000
2002
EMI REM NRK
Kerala Migration Survey, 2003
• % of households with/without migrants
With Without
Emigrants Emigrants
• EMI 17.6 82.4
• REM 11.2 88.8
• NRK 25.8 74.2
Kerala Migration Survey, 2003
% of female emigrants: 17
• Malappuram 271,787
• Kannur 202,414
• Thrissur 178,867
• Palakkad 177,876
• Thiruvananthapuram 168,046
• Kozhikode 167,436
Migrants Per 100 Households by Community
0.0 20.0 40.0 60.0 80.0 100.0 120.0
SCST
Nair
Ezhawa
Brahamin
Other Hindus
RomanCatholics
LatinCatholics
Jacobite/Orthodox
Marthoma
CSI
Muslim
NRK/hh
Rem/hh
Emi/HH
0
20
40
60
80
100
Percentage
Population Emigrants
Population of Kerala and Emigration by Religion 2004
Muslims
Christians
Hindus
Migrants per 100 Households
0
10
20
30
40
50
60
70
80
90
Hindus Christians Muslims
Percentage
Emi
Rem
Nrk
Perent of Households with at least one NRK, 2004
0.0 10.0 20.0 30.0 40.0 50.0 60.0
Muslims
Marthoma
Latin Catholic
Orthodox/Jacobite
IPC
CSI
Nair
Ezhawa
Roman Catholic
Other Hindus
Brahmins
SCST
Community
Percent
Kerala Migration Survey, 2003
• Where do Malayalis go?
Percent
• United Arab Emirates 37
• Saudi Arabia 27
• Gulf countries 89
• United States of America 5
• United Kingdom 1
• Singapore 1
Worker’s Remittances
Rupees (In crores), 2003
• India (No 1 in the world) 82350
• Kerala (total remittances) 18465
• % of Kerala to total 22.4
• 25% of the state domestic product
Remittances in Crores
0
2000
4000
6000
8000
10000
12000
14000
16000
18000
20000
1989 1990 1991 1992 1993 1994 1995 1996 1997 1998 1999 2000 2001 2002 2003
Worker’s Remittances
• Macro Economic Impact
• Remittances: 18465 crores
• Population in 2004: 32.5 million
• Each one gets Rs. 5678 per year or
• Rs 473 per month
• Sufficient to buy at least 1 kg of rice per
day per person
Worker’s Remittances
• Importance of Remittances
• Remittances were 1.74 times the revenue
receipts of the government
• 1.8 times than the Government of Kerala
expenditure
• 7 times what Kerala receives from the
central government
Worker’s Remittances
• Importance of Remittances
• 60% of Kerala government’s debt can be
wiped out by remittances
• 15 times more than the export earning of
the cashew products
• 18 times more than the export earnings of
the marine products
Percent of Households Directly Beniftted From Remittances
0
5
10
15
20
25
30
35
40
Hindus Christians Muslims
PercentofHhs
Percent of houses that are luxurious
or very good By Community
0
5
10
15
20
25
30
35
Û &8 ÙVFCh ï[F
Percentage
Expenditure on Education Per Household,
by Migration Status and Religion
0
2000
4000
6000
8000
10000
12000
14000
16000
All NRK Non-NRK
Rupees
Hindus
Christians
Muslims
Expenditure per Household on Health, by
Religion and Migration Status
0
2000
4000
6000
8000
10000
12000
14000
All NRK Non-NRK
Rupees
Hindus
Christians
Muslims
Labour Market Issues
• Stagnation in agriculture (workers are not
willing to work in agriculture)
• Increase in wages (about Rs. 200) in
Kerala as against Rs.50 in Bihar
• Unemployment is very high (after
deducting for internal and international
migration
Unemployed Rate by Education 2004
0 5 10 15 20 25 30 35 40 45
Illiterate
Literate
Primary Incomplete
Primary
Secondary Incomplete
Secondary
Degree
Migration and Development
• Positive effects
• Reduction in Poverty
• Reduction in unemployment
• Other effects
• Conflict between new rich and old rich
• Increase in income equality and conflicts
• Replacement Migration
Our views have increased the mark
of the 20,000
Thank you viewers
Looking forward to franchise,
collaboration, partners.
This platform has been started by Parveen
Kumar Chadha with the vision that nobody
should suffer the way he has suffered
because of lack and improper healthcare
facilities in India. We need lots of funds
manpower etc. to make this vision a reality
please contact us. Join us as a member for
a noble cause.
Contact us:- 011-25464531, 9818569476
E-mail:- nursingnursing@yahoo.in

International migration

  • 1.
    INTERNATIONAL MIGRATION ANDDEVELOPMENT IN KERALAINTERNATIONAL MIGRATION AND DEVELOPMENT IN KERALA Dr S IRUDAYA RAJAN Chair Professor CDS, Kerala
  • 2.
    • Total Populationof Kerala: 31 million • Until 1956 (Kerala came into existence from 1st November 1956), Kerala was an in-migrating state • From 1961, Kerala is an out-migrating state, even today • Kerala is ahead of India in terms of fertility, infant mortality and literacy
  • 3.
    • As Keraliteswere ahead of literacy than other parts of the country, most of the literates migrated to other parts of India where there is a demand of educated (teachers, nurses, accountants and other services) • As long as, they were accustomed to mobility within India, when the oil boom begun in Gulf, they were the first to emigrate to Gulf. • In India, we have good statistics on inter-state migration based on census and the data on international migration is only a guesstimate.
  • 4.
    • To studythe Impact on International migration on Kerala’s economy and society, we have undertaken three major surveys in Kerala • Kerala Migration Survey, 1998 (10000 households) • Kerala Migration Survey, 2003 (10000) • Kerala Migration Survey, 2007 (Progress) • Kerala Migration Survey, 2008 (Proposed)
  • 5.
    Kerala Migration Survey2003 • Number of emigrants (EMI) • 1999 13.6 lakhs • 2004 18.4 lakhs Number of return emigrants (REM) • 1999 7.4 Lakhs • 2004 8.9 lakhs • No of NRK: 27.3 lakhs
  • 6.
  • 7.
    Kerala Migration Survey,2003 • % of households with/without migrants With Without Emigrants Emigrants • EMI 17.6 82.4 • REM 11.2 88.8 • NRK 25.8 74.2
  • 8.
    Kerala Migration Survey,2003 % of female emigrants: 17 • Malappuram 271,787 • Kannur 202,414 • Thrissur 178,867 • Palakkad 177,876 • Thiruvananthapuram 168,046 • Kozhikode 167,436
  • 10.
    Migrants Per 100Households by Community 0.0 20.0 40.0 60.0 80.0 100.0 120.0 SCST Nair Ezhawa Brahamin Other Hindus RomanCatholics LatinCatholics Jacobite/Orthodox Marthoma CSI Muslim NRK/hh Rem/hh Emi/HH
  • 11.
    0 20 40 60 80 100 Percentage Population Emigrants Population ofKerala and Emigration by Religion 2004 Muslims Christians Hindus
  • 12.
    Migrants per 100Households 0 10 20 30 40 50 60 70 80 90 Hindus Christians Muslims Percentage Emi Rem Nrk
  • 13.
    Perent of Householdswith at least one NRK, 2004 0.0 10.0 20.0 30.0 40.0 50.0 60.0 Muslims Marthoma Latin Catholic Orthodox/Jacobite IPC CSI Nair Ezhawa Roman Catholic Other Hindus Brahmins SCST Community Percent
  • 14.
    Kerala Migration Survey,2003 • Where do Malayalis go? Percent • United Arab Emirates 37 • Saudi Arabia 27 • Gulf countries 89 • United States of America 5 • United Kingdom 1 • Singapore 1
  • 15.
    Worker’s Remittances Rupees (Incrores), 2003 • India (No 1 in the world) 82350 • Kerala (total remittances) 18465 • % of Kerala to total 22.4 • 25% of the state domestic product
  • 16.
    Remittances in Crores 0 2000 4000 6000 8000 10000 12000 14000 16000 18000 20000 19891990 1991 1992 1993 1994 1995 1996 1997 1998 1999 2000 2001 2002 2003
  • 17.
    Worker’s Remittances • MacroEconomic Impact • Remittances: 18465 crores • Population in 2004: 32.5 million • Each one gets Rs. 5678 per year or • Rs 473 per month • Sufficient to buy at least 1 kg of rice per day per person
  • 18.
    Worker’s Remittances • Importanceof Remittances • Remittances were 1.74 times the revenue receipts of the government • 1.8 times than the Government of Kerala expenditure • 7 times what Kerala receives from the central government
  • 19.
    Worker’s Remittances • Importanceof Remittances • 60% of Kerala government’s debt can be wiped out by remittances • 15 times more than the export earning of the cashew products • 18 times more than the export earnings of the marine products
  • 20.
    Percent of HouseholdsDirectly Beniftted From Remittances 0 5 10 15 20 25 30 35 40 Hindus Christians Muslims PercentofHhs
  • 21.
    Percent of housesthat are luxurious or very good By Community 0 5 10 15 20 25 30 35 Û &8 ÙVFCh ï[F Percentage
  • 22.
    Expenditure on EducationPer Household, by Migration Status and Religion 0 2000 4000 6000 8000 10000 12000 14000 16000 All NRK Non-NRK Rupees Hindus Christians Muslims
  • 23.
    Expenditure per Householdon Health, by Religion and Migration Status 0 2000 4000 6000 8000 10000 12000 14000 All NRK Non-NRK Rupees Hindus Christians Muslims
  • 24.
    Labour Market Issues •Stagnation in agriculture (workers are not willing to work in agriculture) • Increase in wages (about Rs. 200) in Kerala as against Rs.50 in Bihar • Unemployment is very high (after deducting for internal and international migration
  • 25.
    Unemployed Rate byEducation 2004 0 5 10 15 20 25 30 35 40 45 Illiterate Literate Primary Incomplete Primary Secondary Incomplete Secondary Degree
  • 26.
    Migration and Development •Positive effects • Reduction in Poverty • Reduction in unemployment • Other effects • Conflict between new rich and old rich • Increase in income equality and conflicts • Replacement Migration
  • 28.
    Our views haveincreased the mark of the 20,000 Thank you viewers Looking forward to franchise, collaboration, partners.
  • 29.
    This platform hasbeen started by Parveen Kumar Chadha with the vision that nobody should suffer the way he has suffered because of lack and improper healthcare facilities in India. We need lots of funds manpower etc. to make this vision a reality please contact us. Join us as a member for a noble cause.
  • 30.
    Contact us:- 011-25464531,9818569476 E-mail:- nursingnursing@yahoo.in