Downloaded 411 times


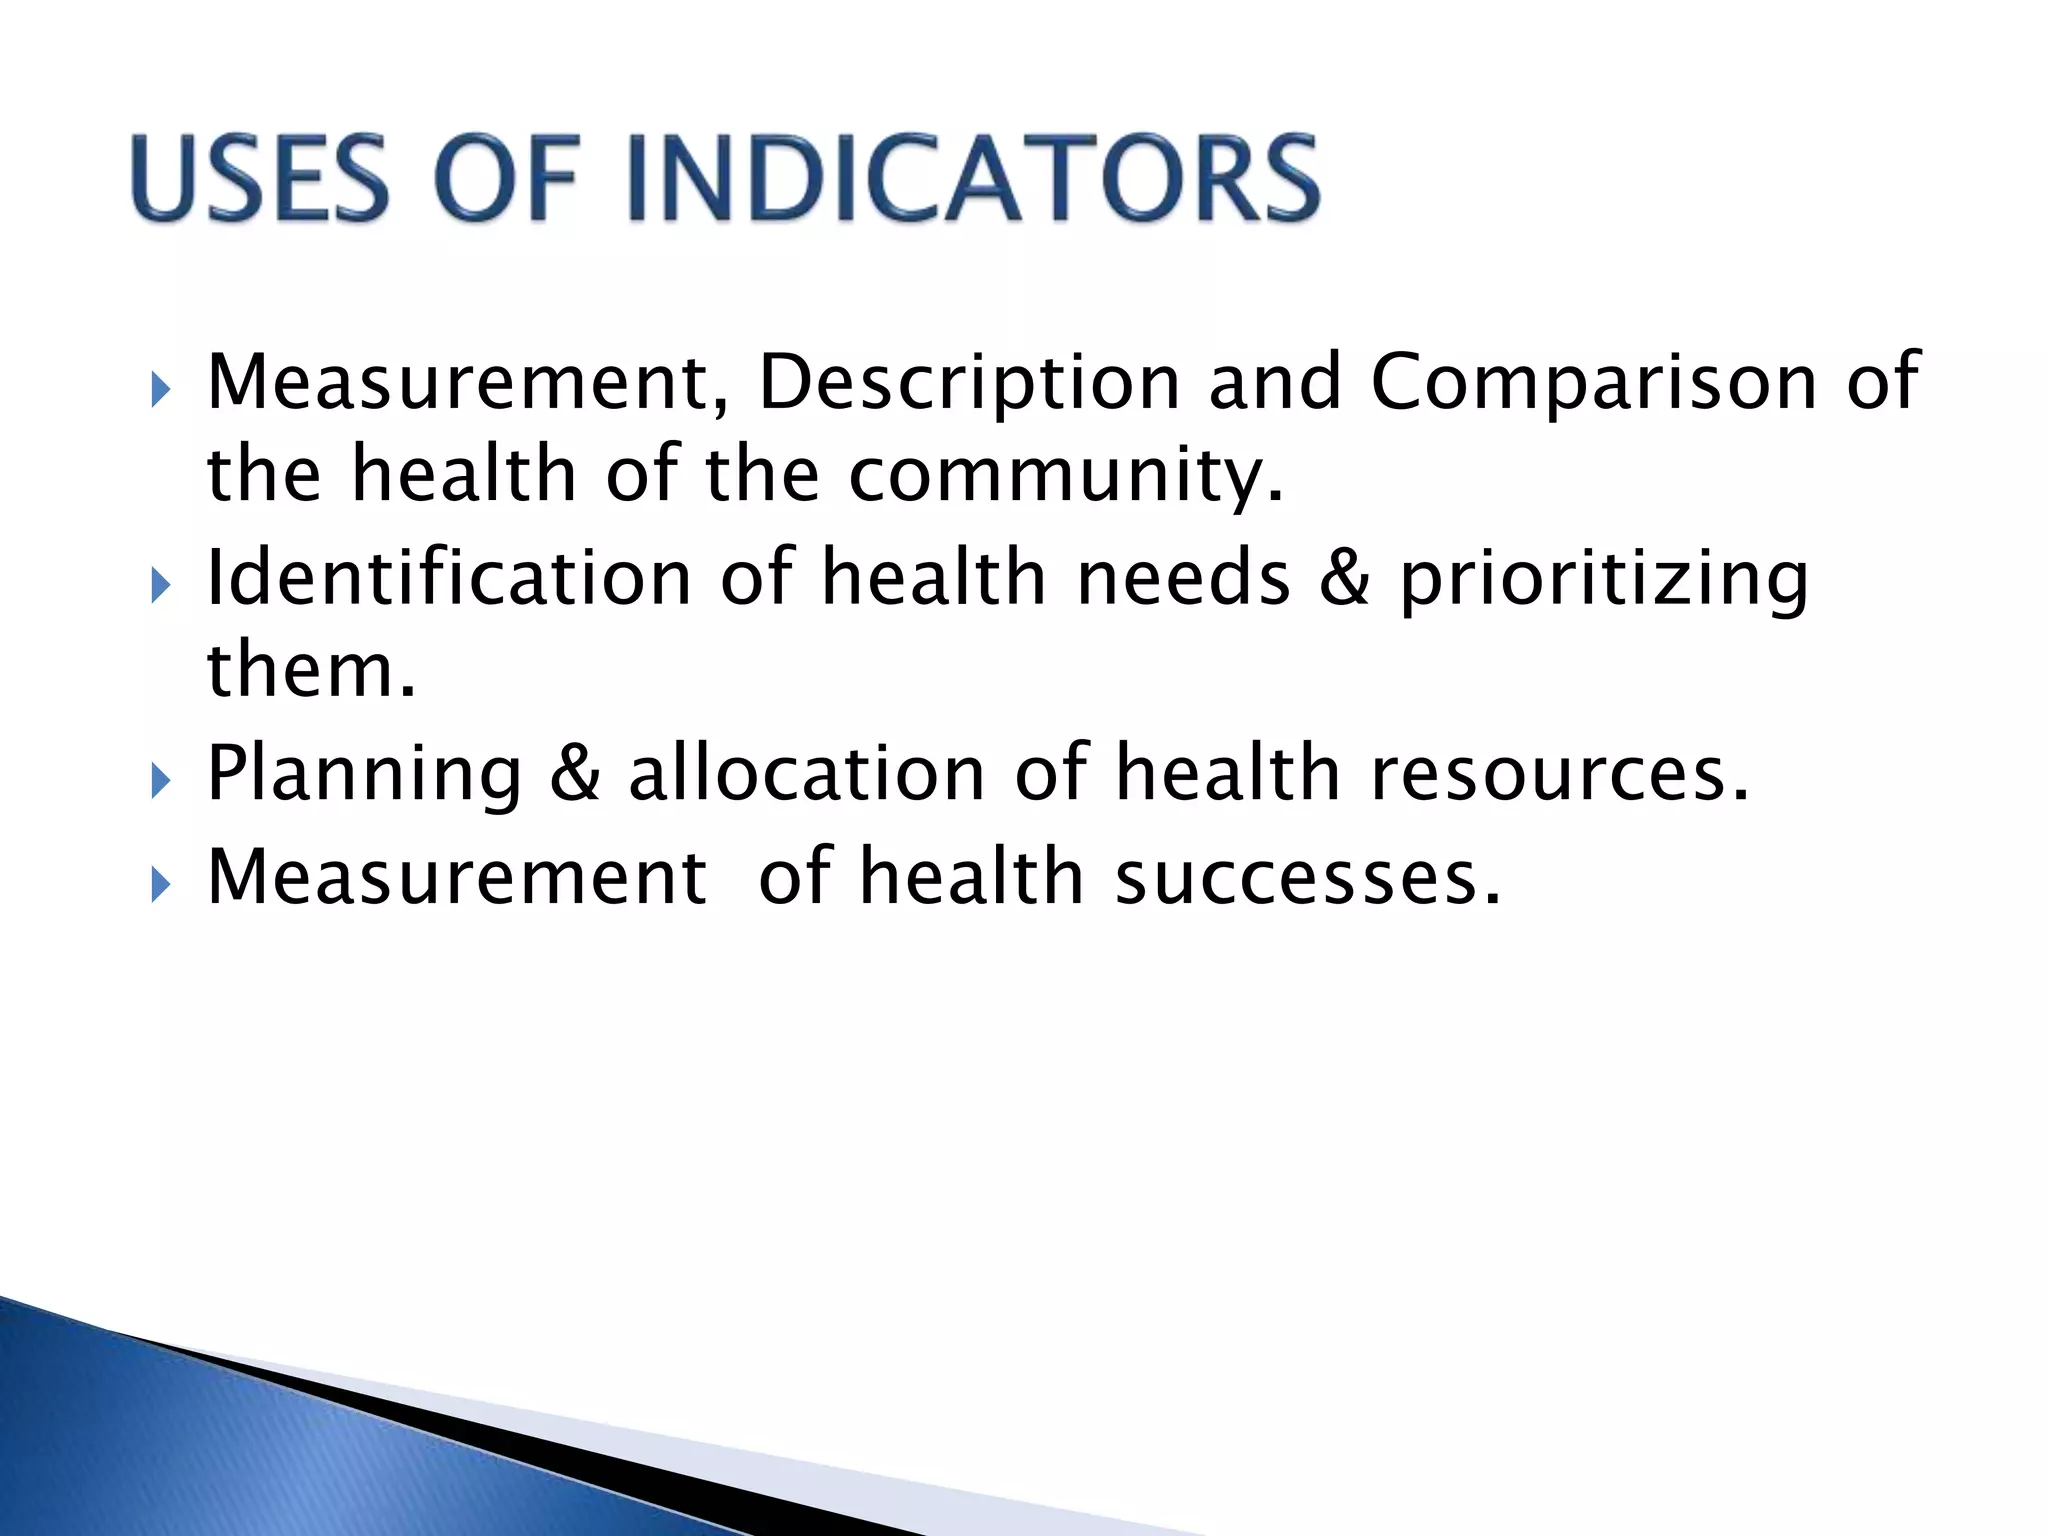


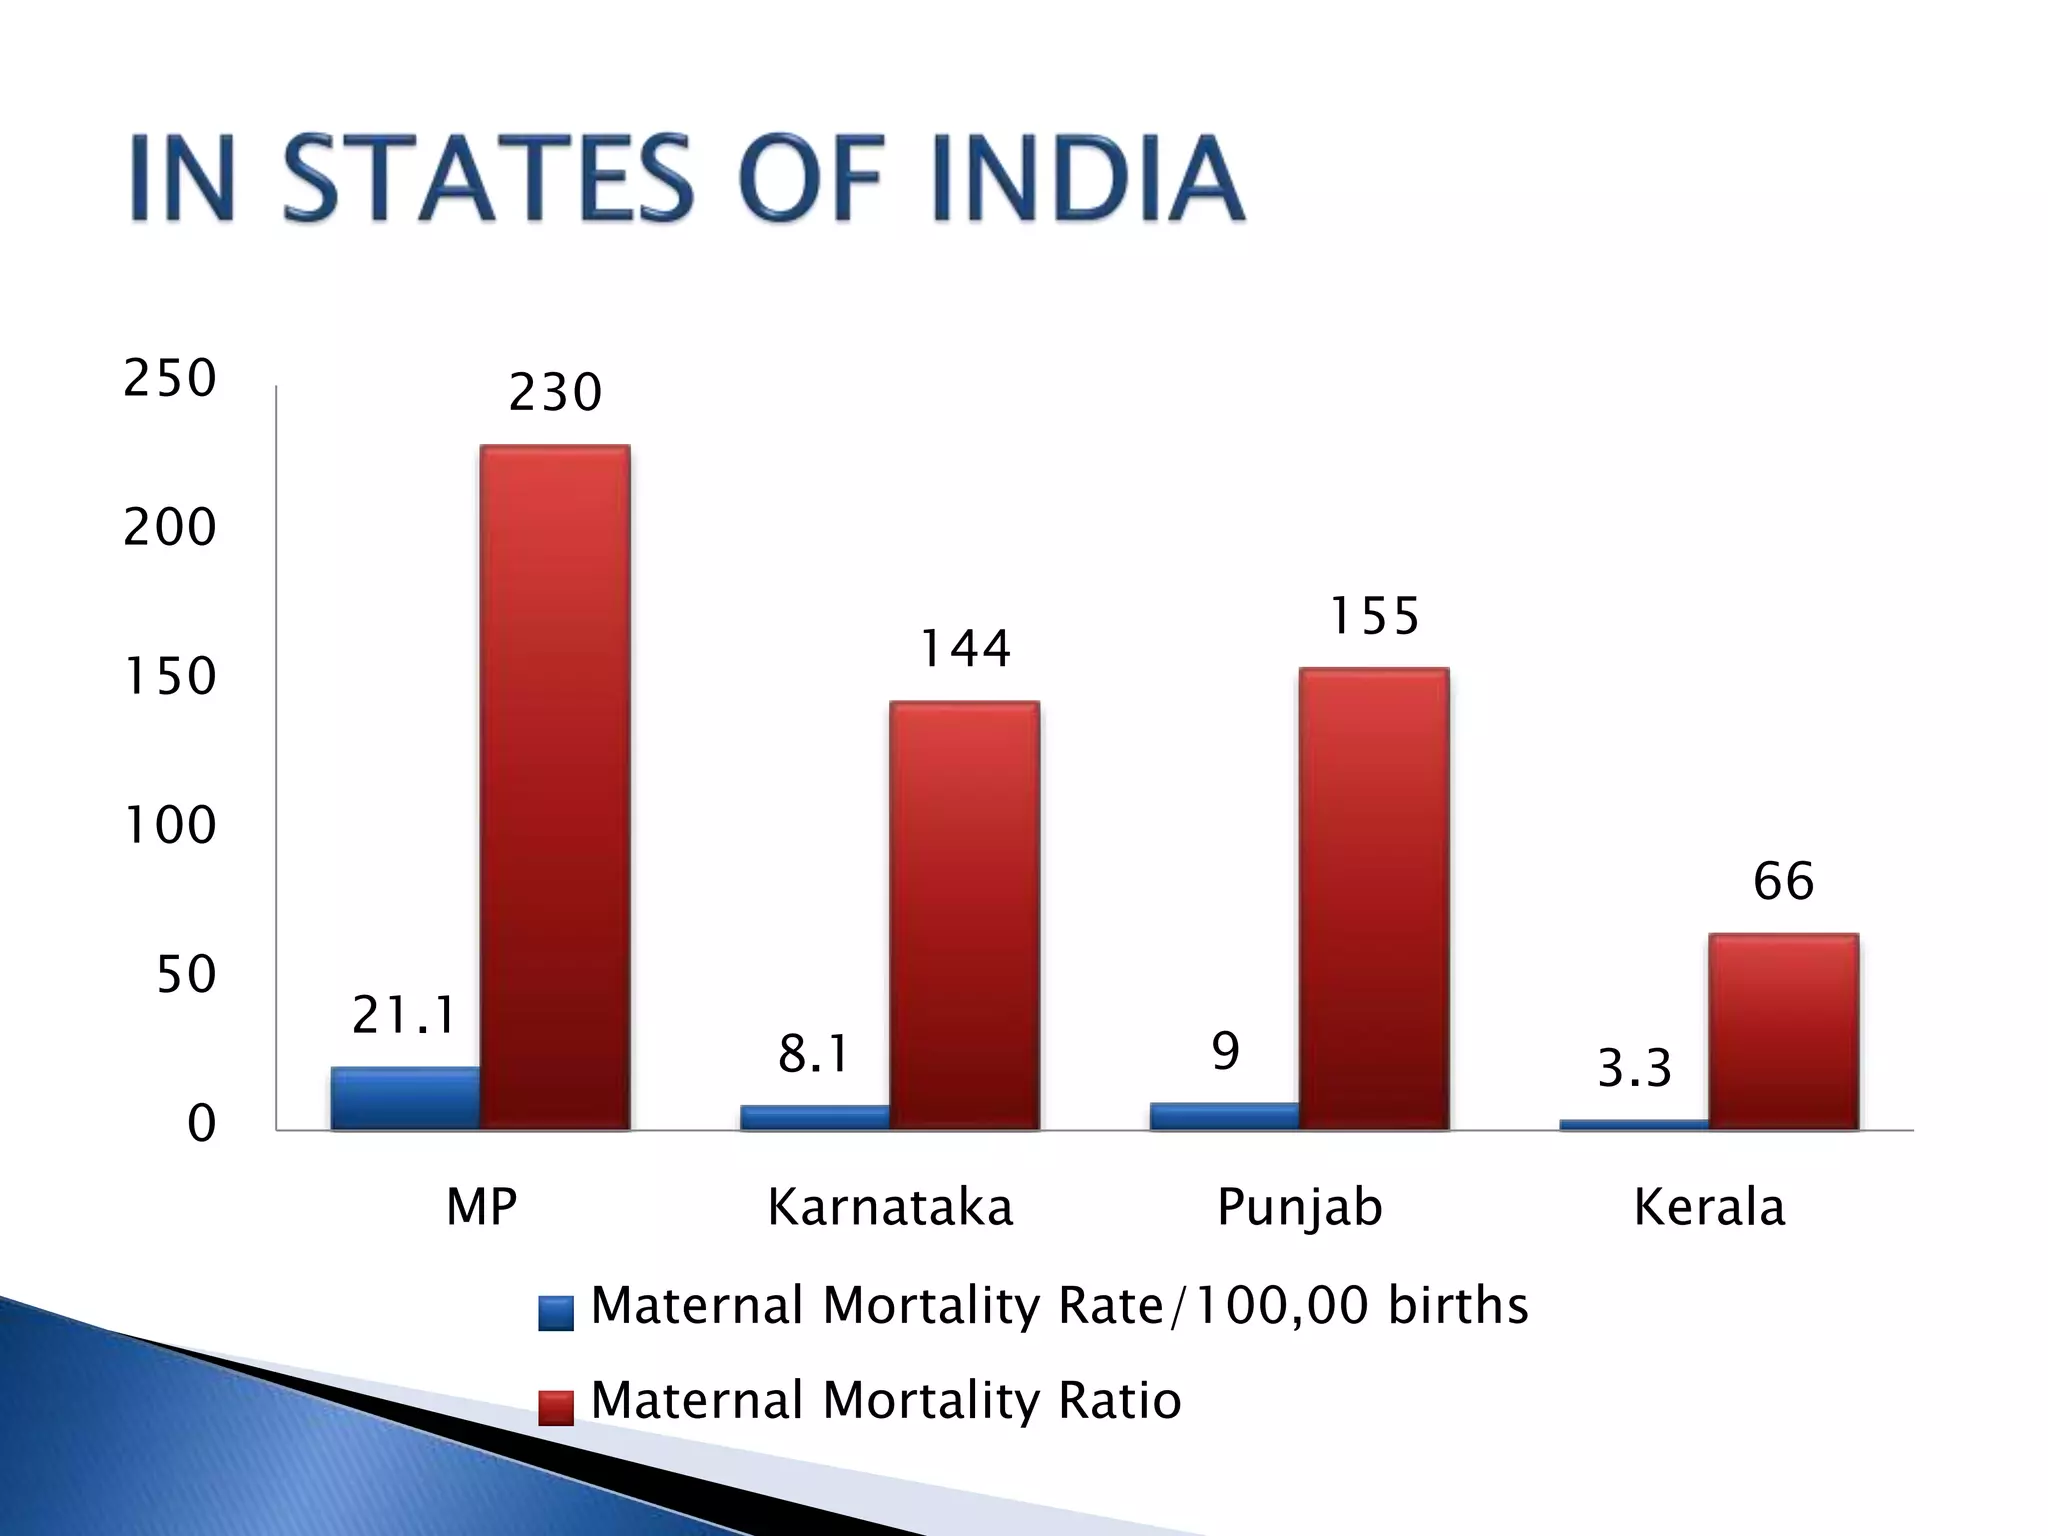


This document discusses health indicators which are variables that can be directly measured to reflect the health status of a community. Good health indicators are valid, reliable, sensitive, specific and feasible. They are used to measure, describe and compare community health, identify health needs, plan health resources, and measure health successes. Examples of common health indicators discussed are mortality rates, morbidity rates, disability rates, and nutritional indicators. Specific indicators described in detail include crude death rate, life expectancy, infant mortality rate, and maternal mortality rate. Challenges with health indicators and ways to improve them are also outlined.


