Download as PPSX, PPTX


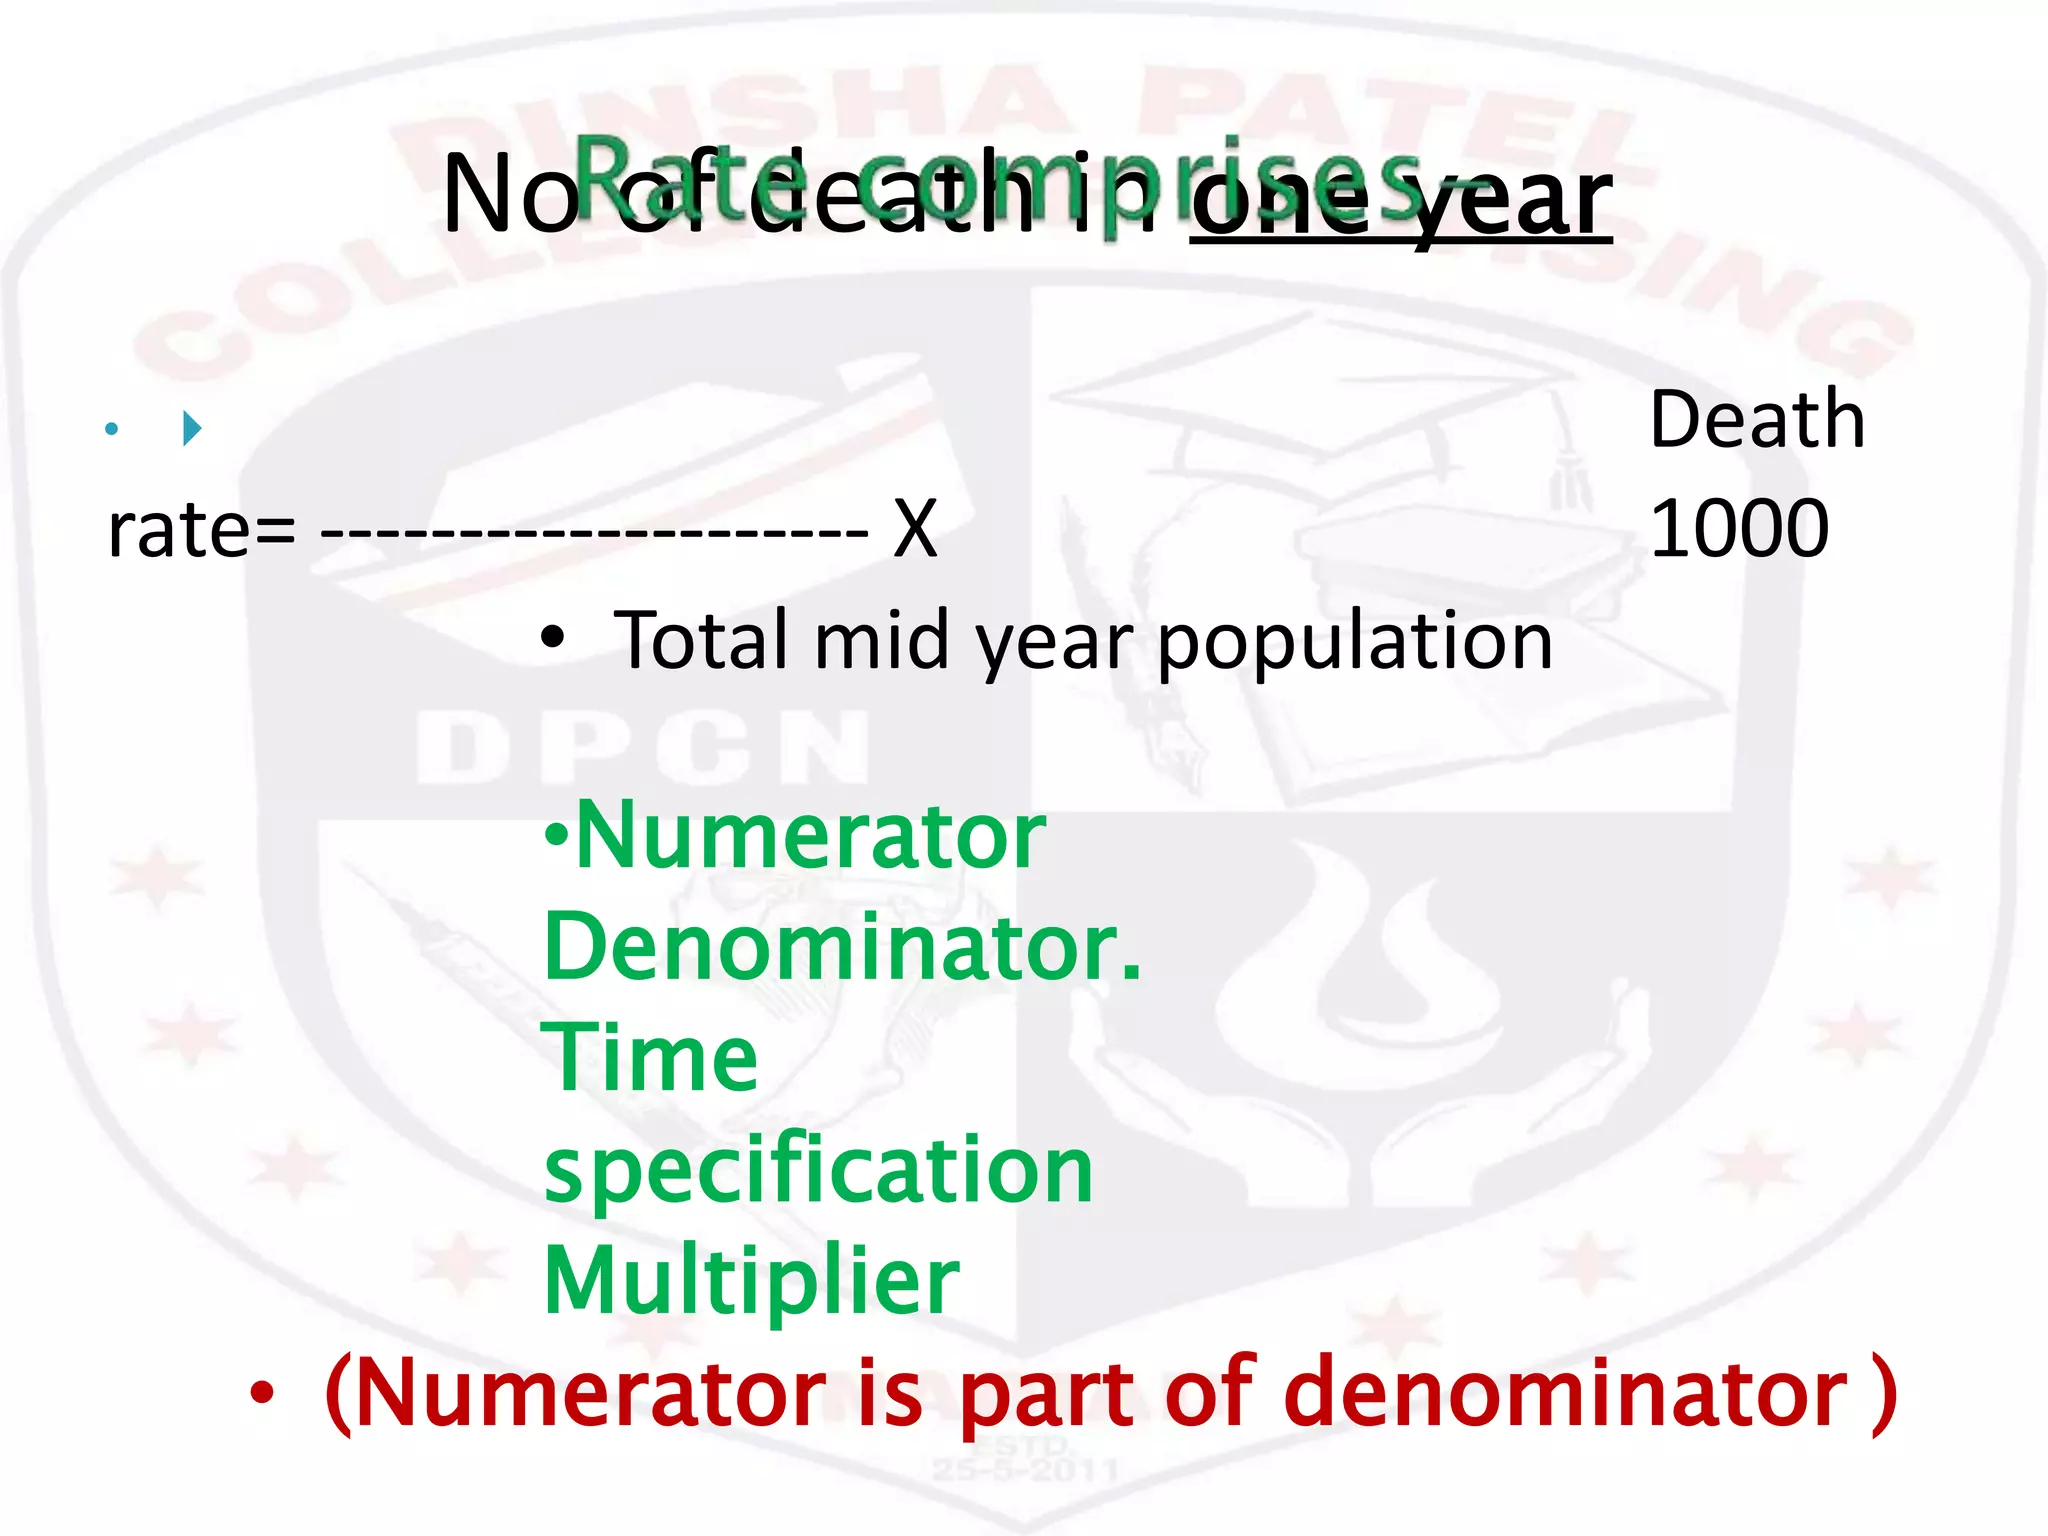


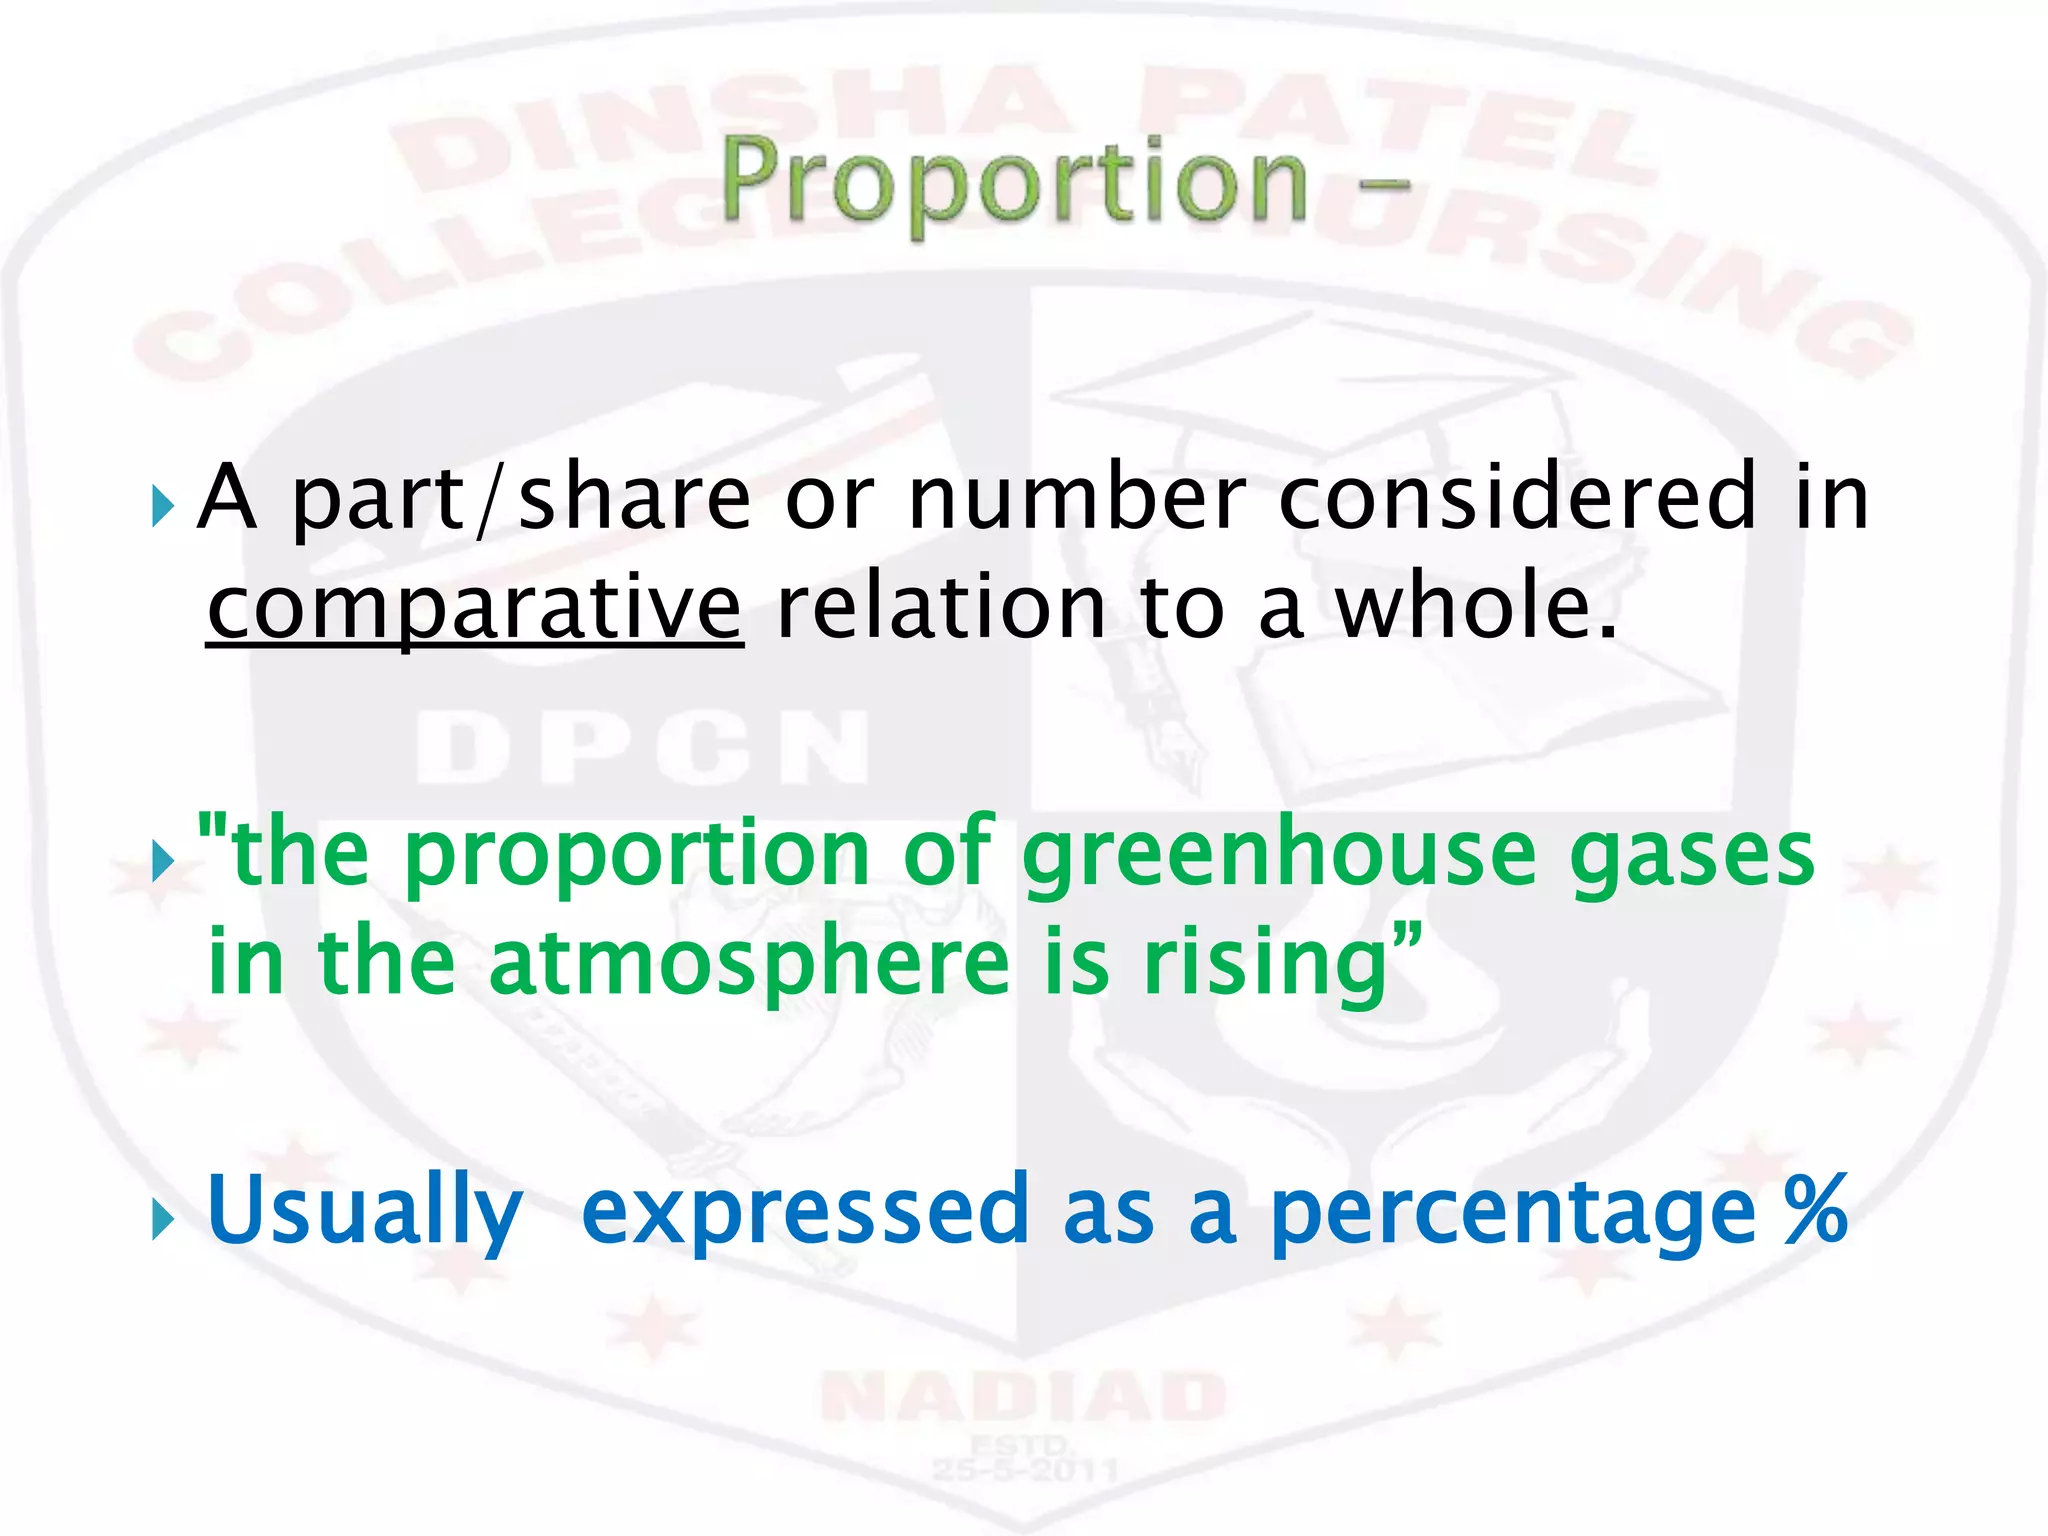


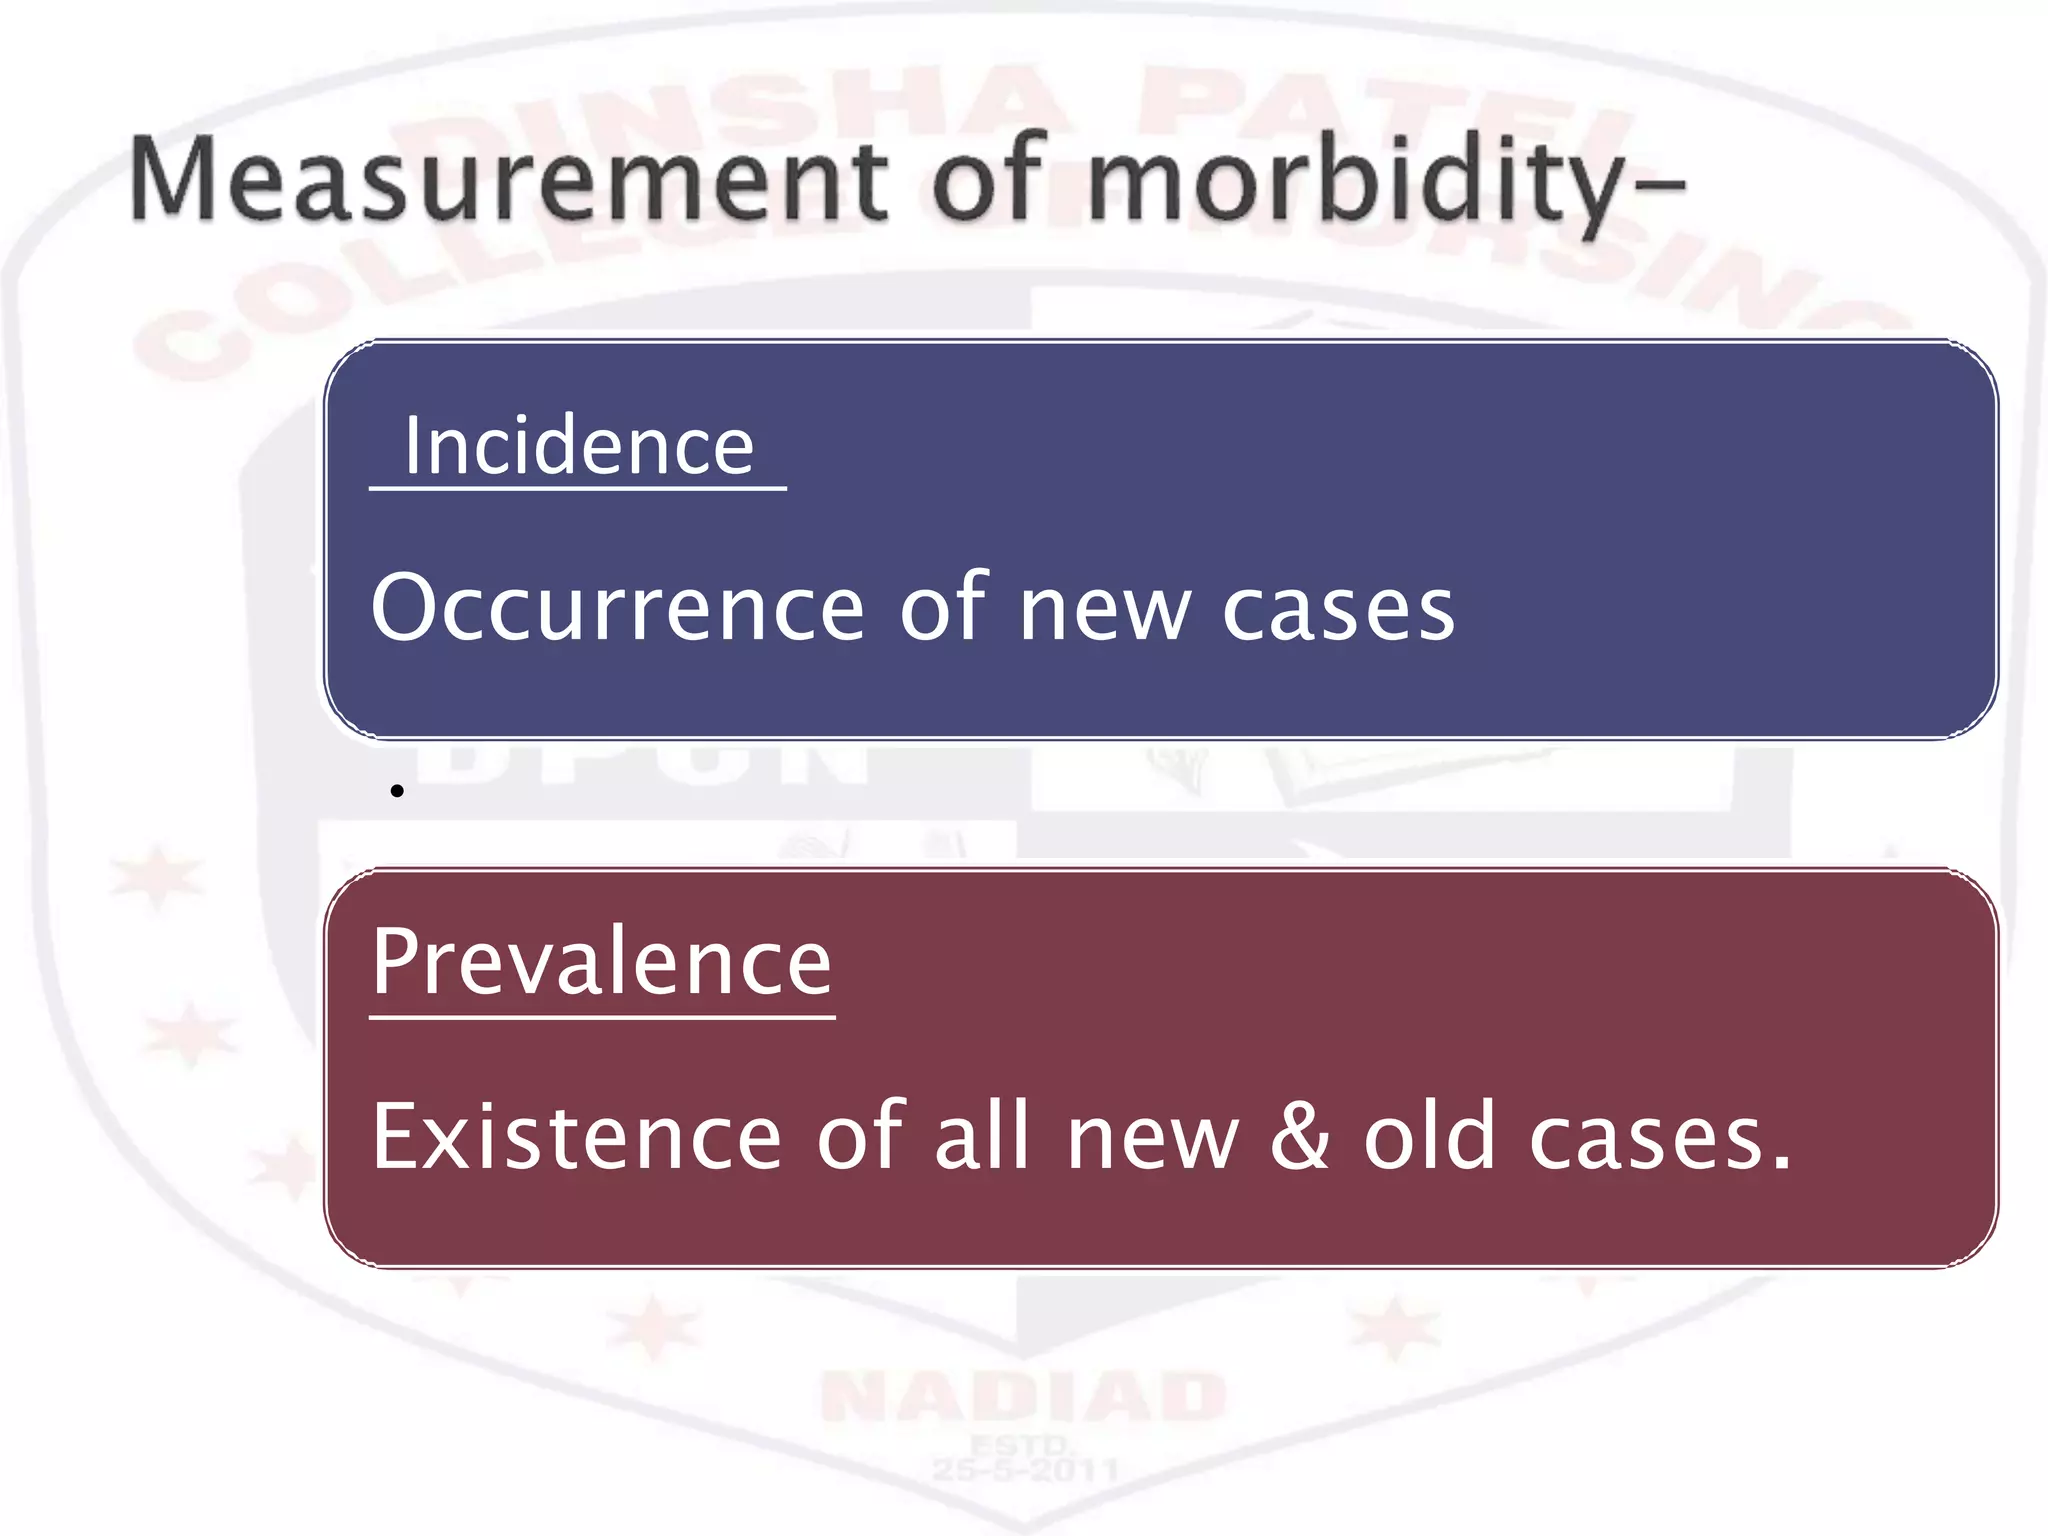
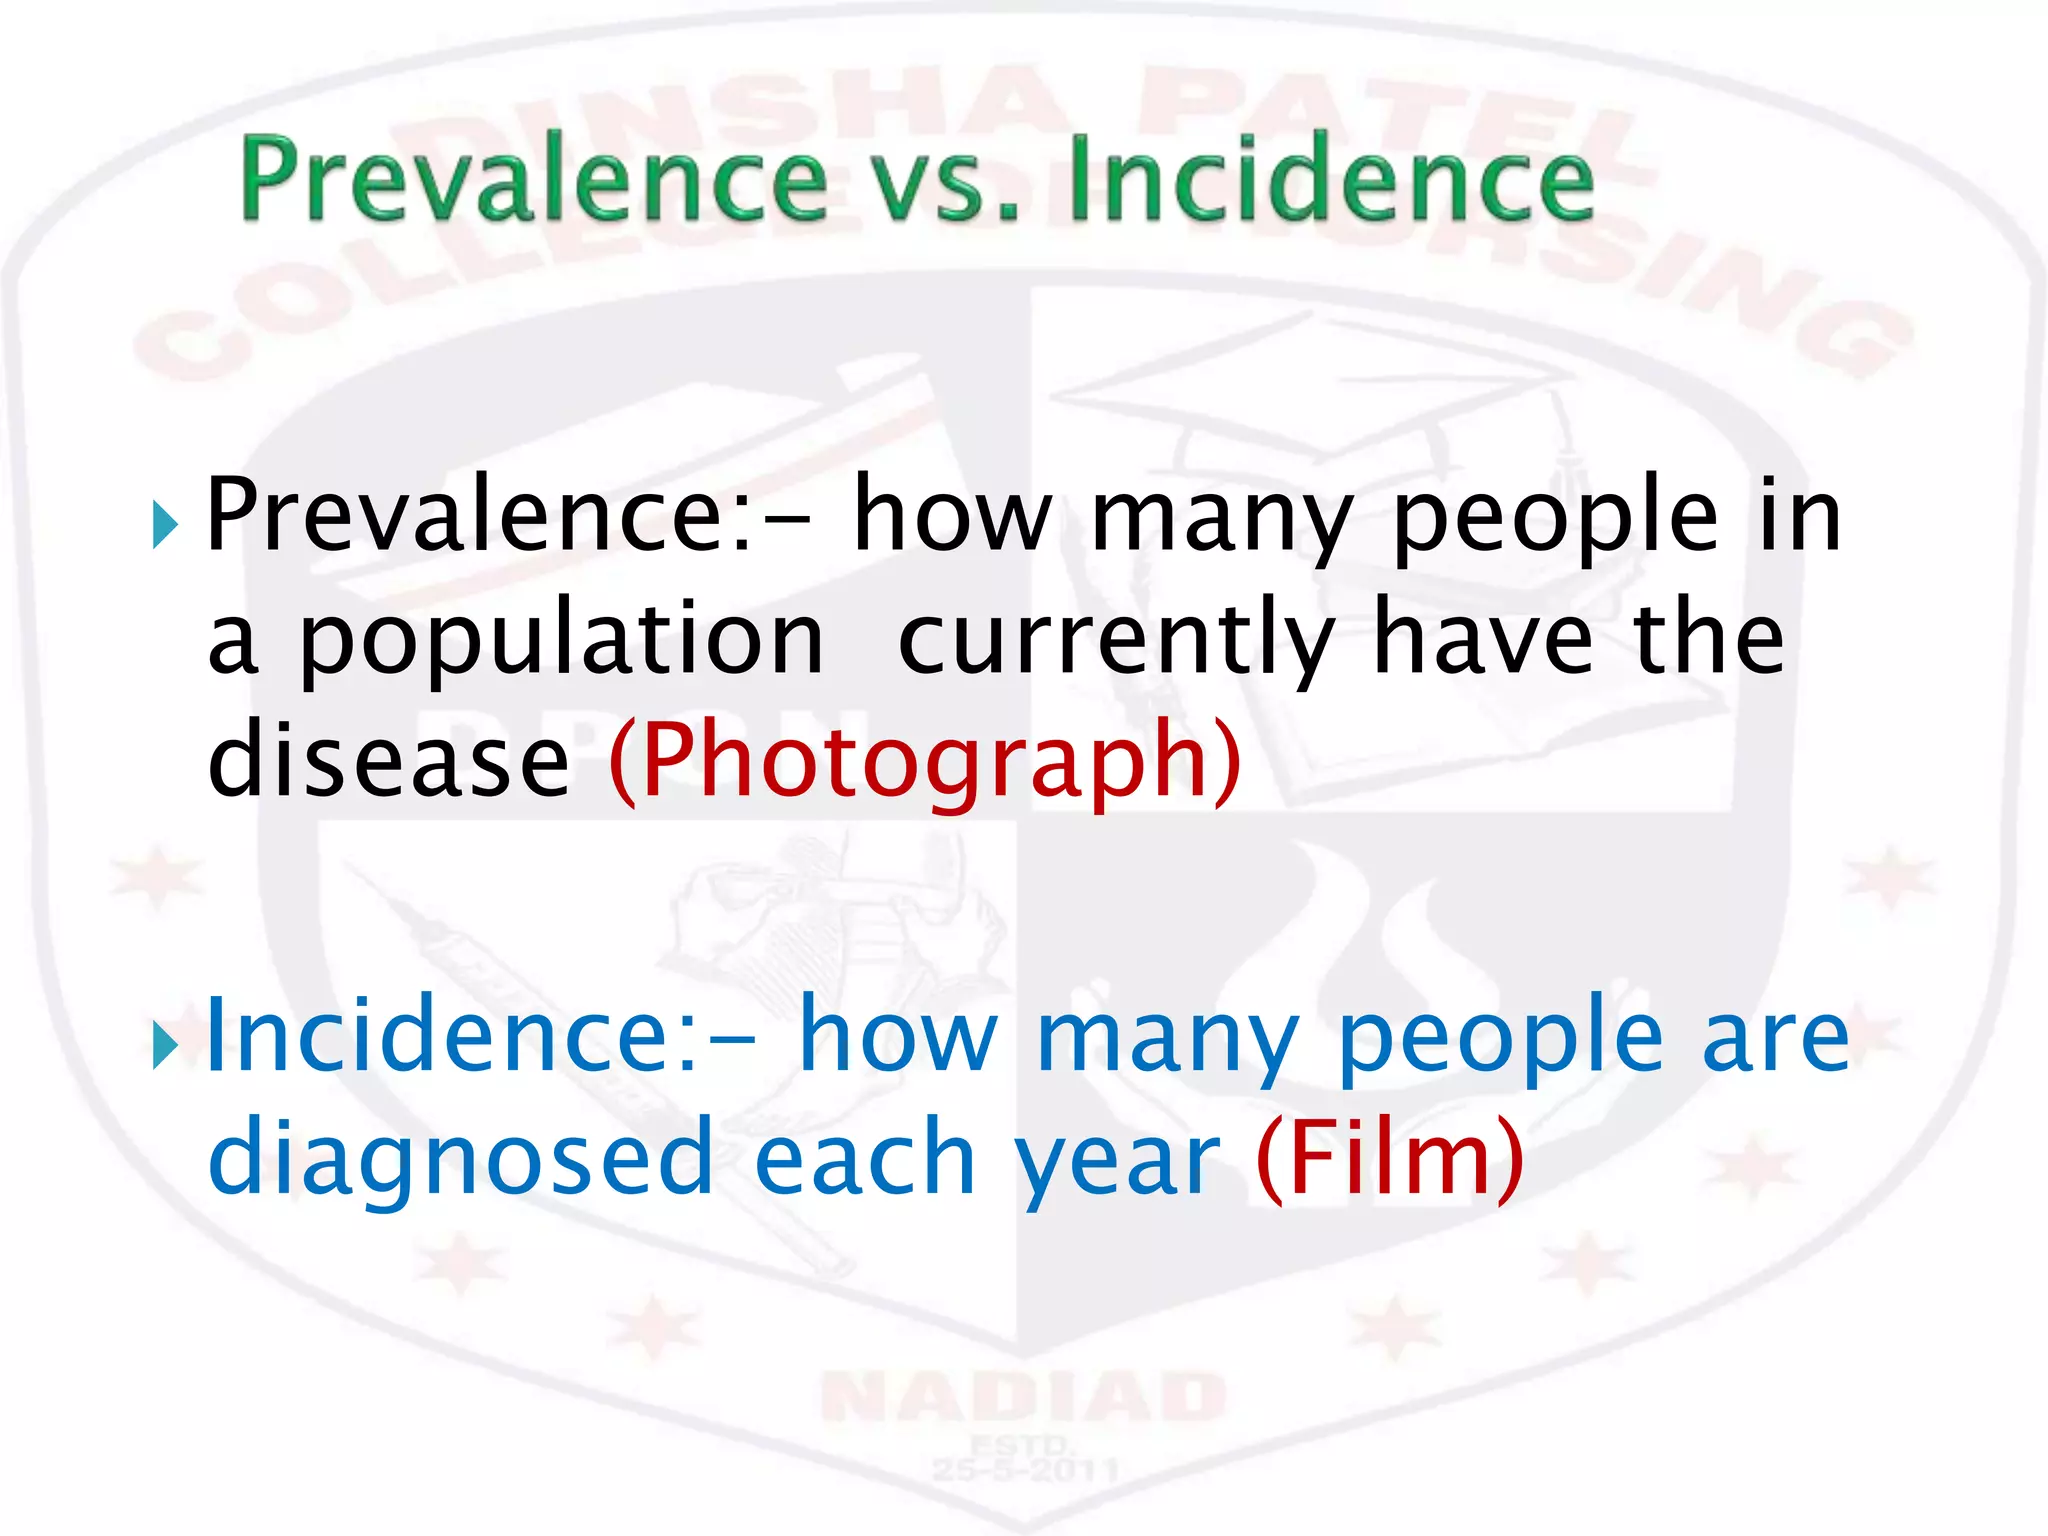


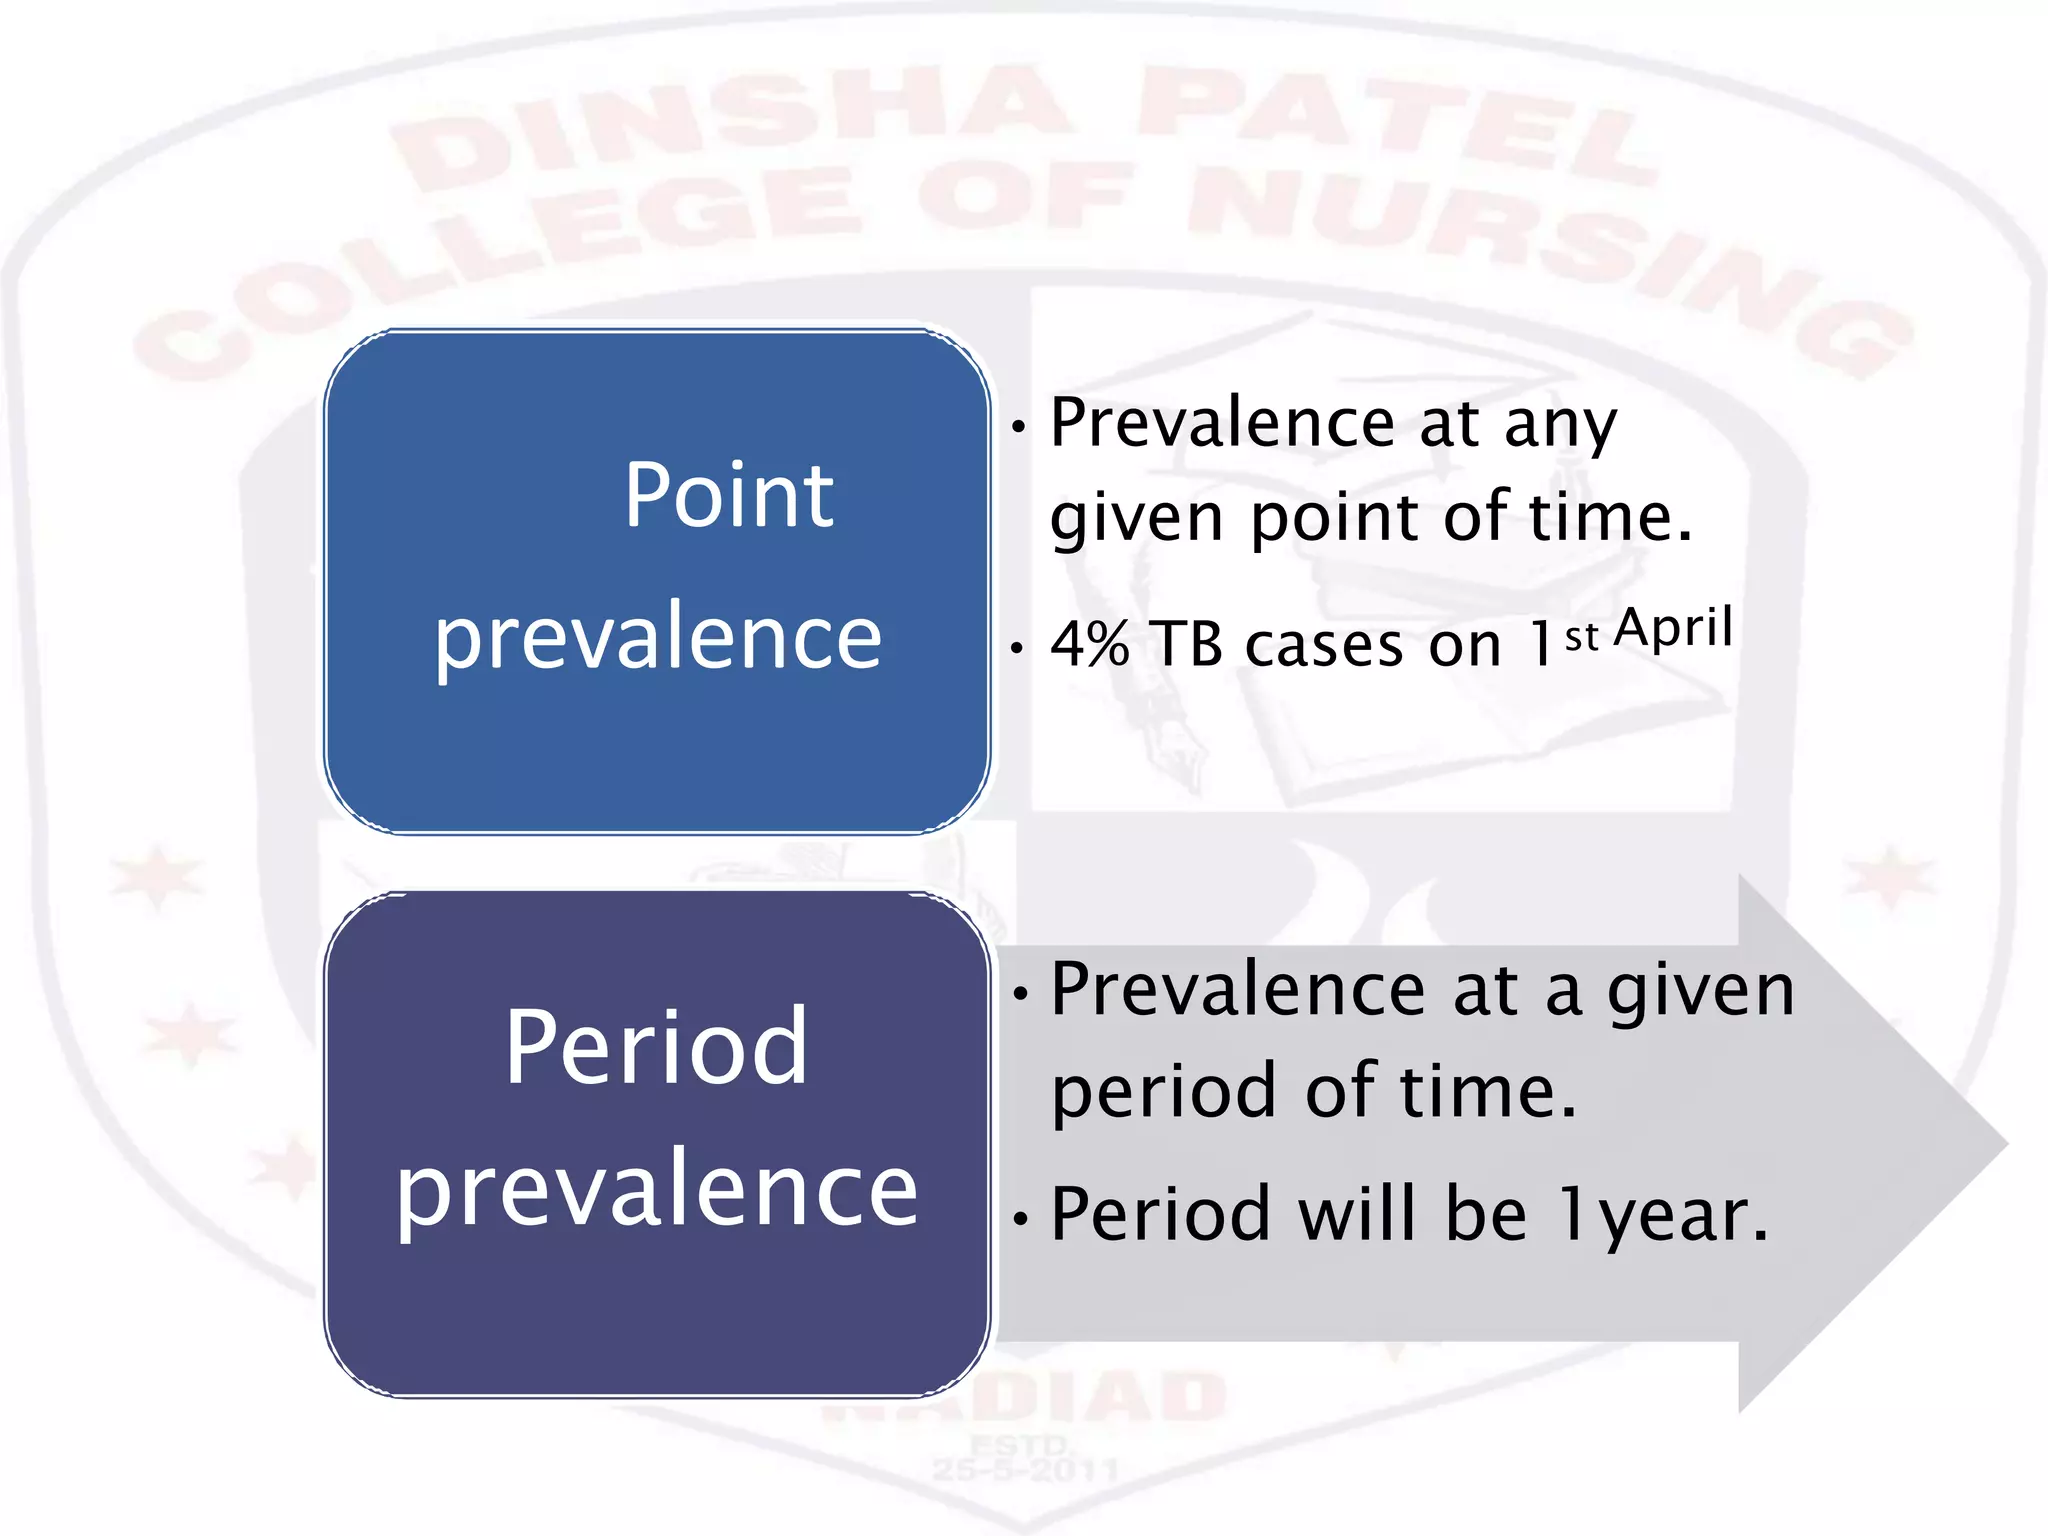


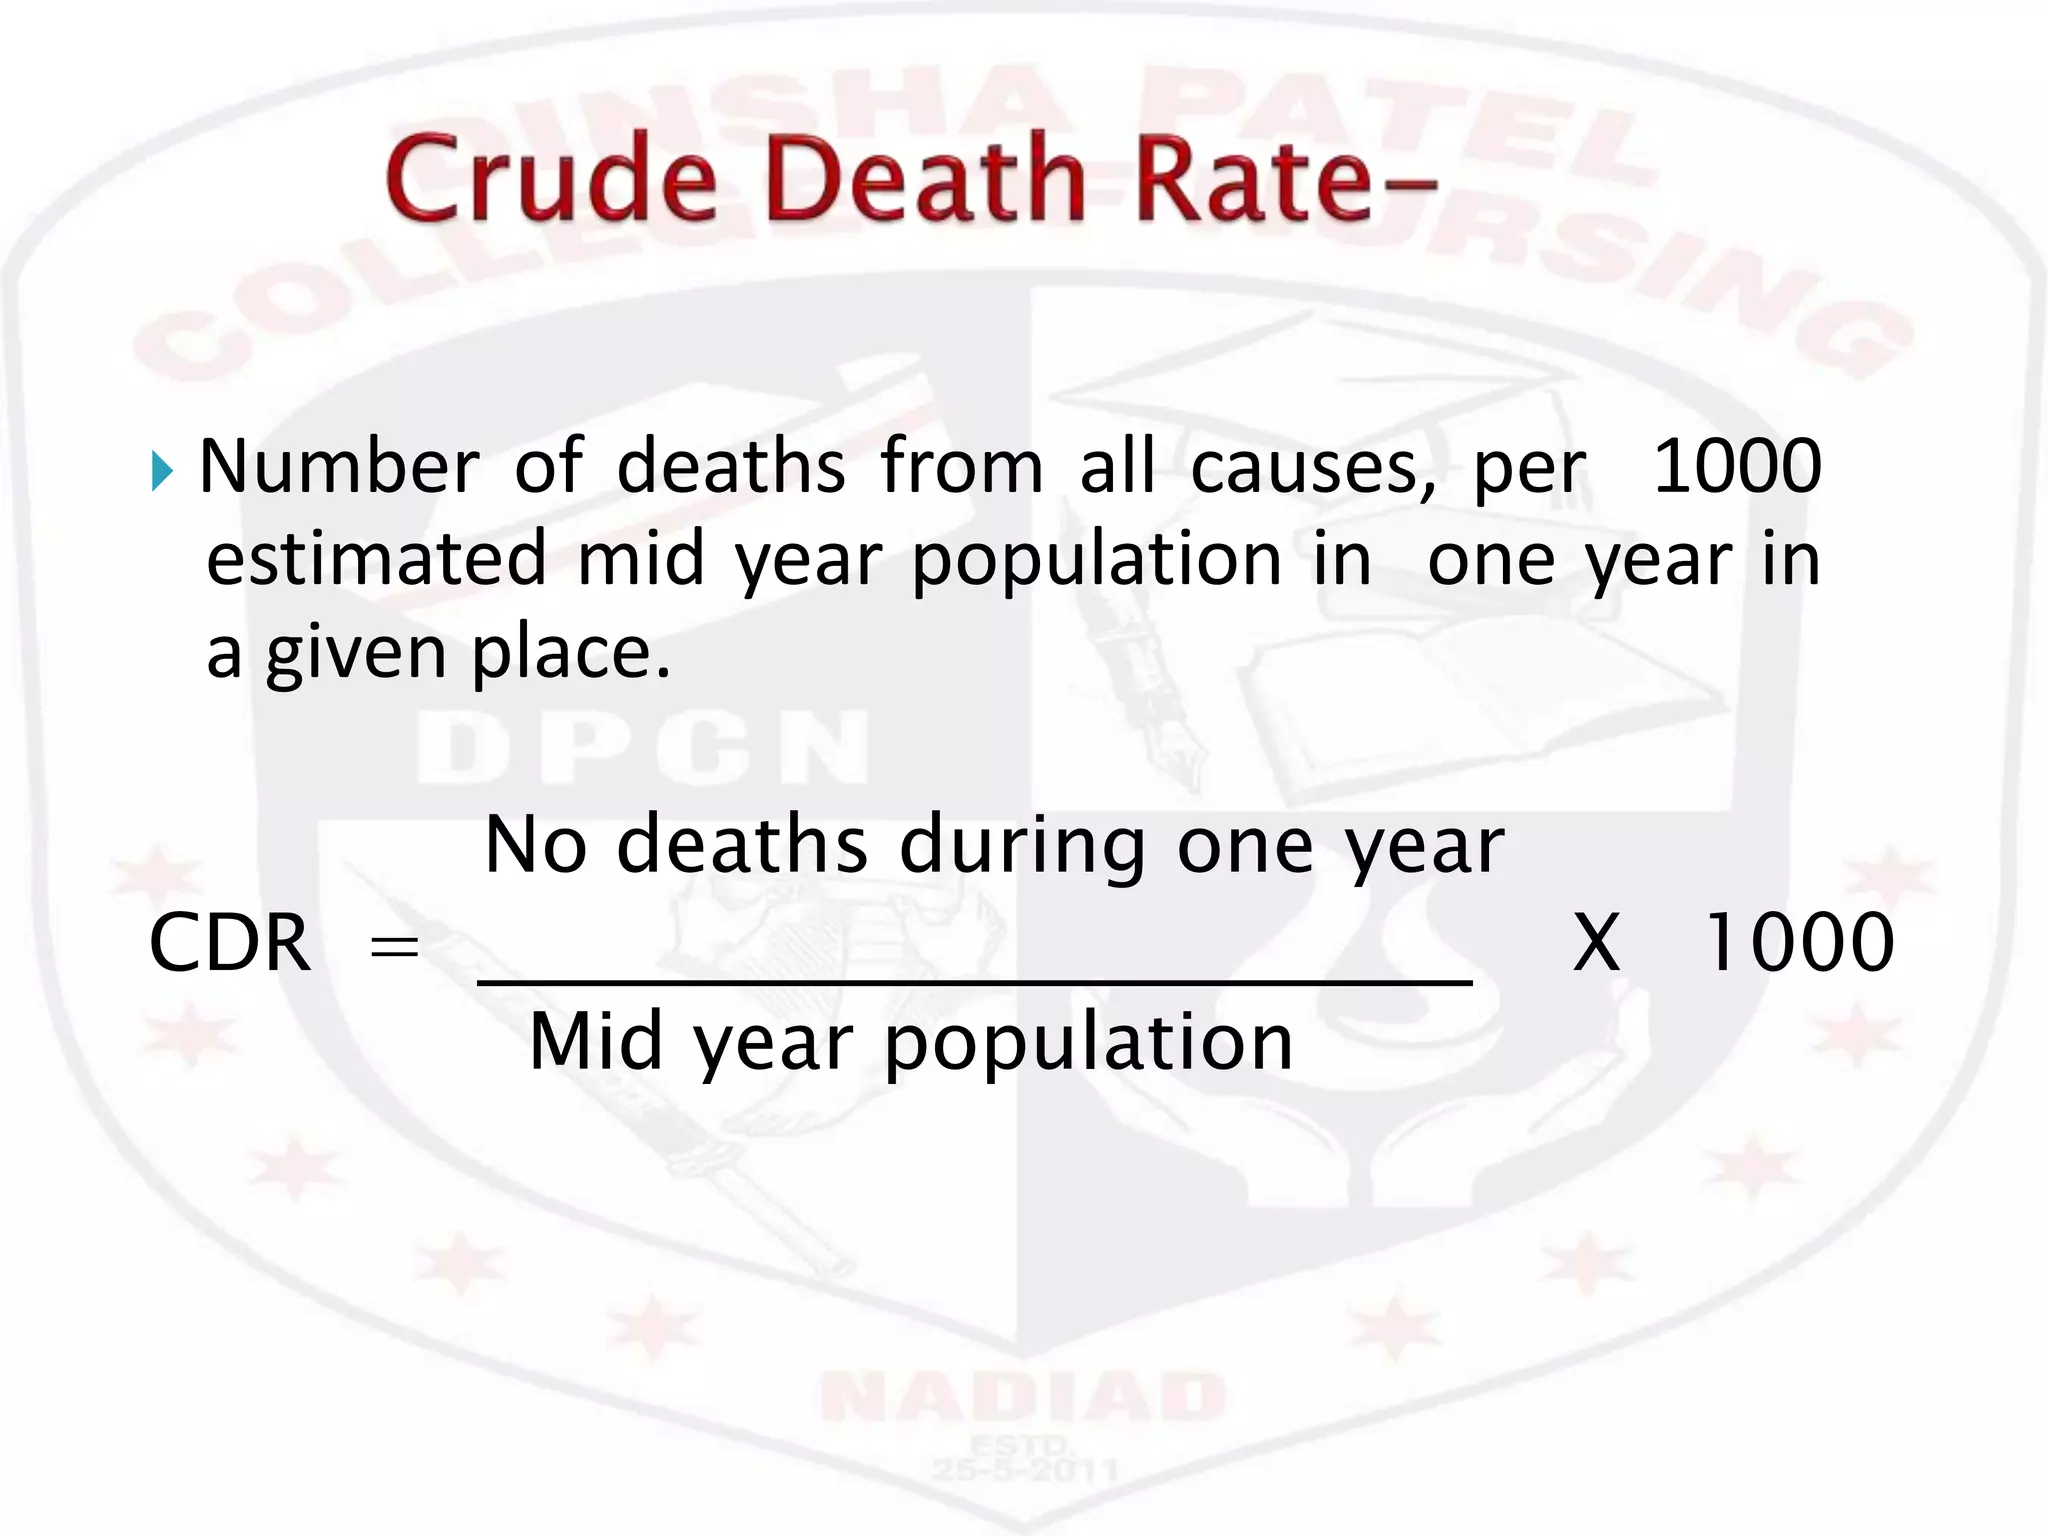


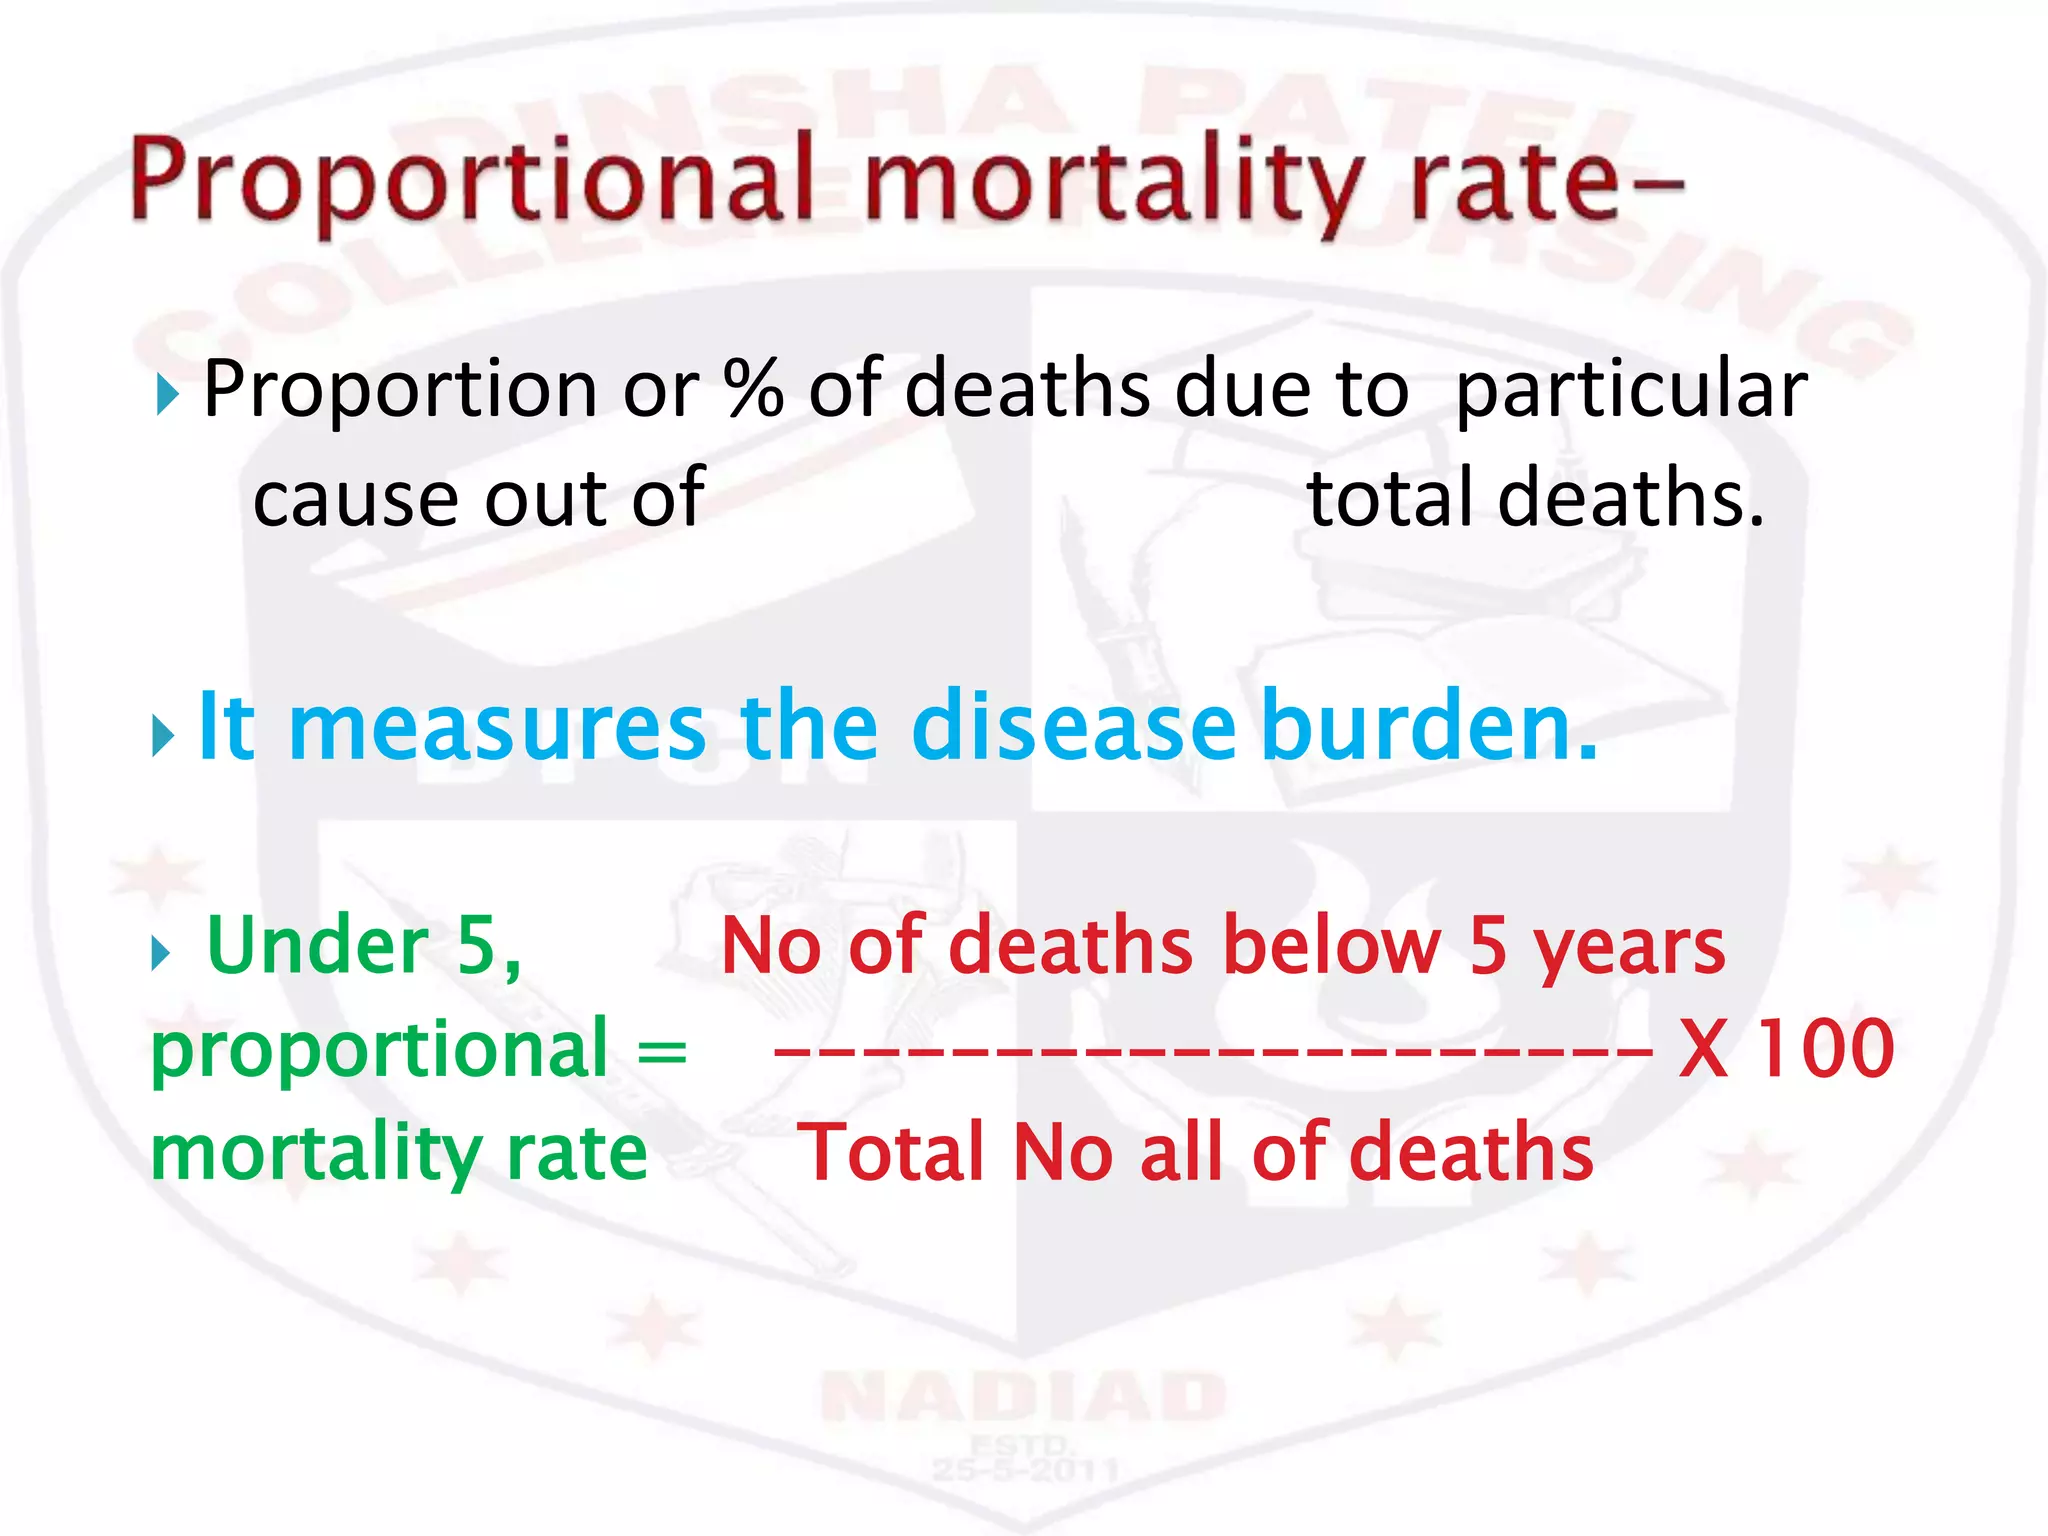


This document discusses various epidemiological terms used to measure disease occurrence and health indicators in a population. It defines rates, ratios, proportions and compares their uses. Specific terms defined include crude death rate, specific death rate, case fatality rate, proportional mortality rate, prevalence, incidence, attack rates and standardized death rates. Factors that can impact prevalence and incidence over time are also outlined.


