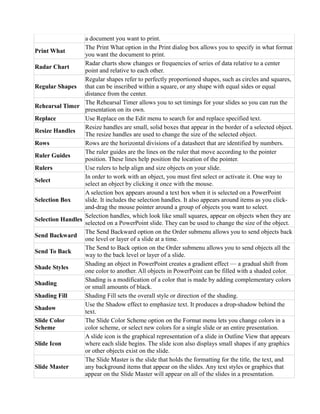
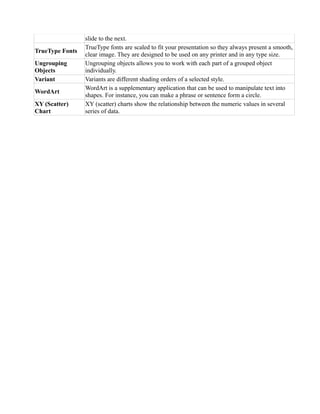
SlideShare a Scribd company logo
Microsoft PowerPoint Glossary
3-D Chart
3-D charts are any charts that have a three-dimensional appearance, that is, height,
width, and depth.
3-D Surface
Chart
3-D surface charts show relationships between large amounts of data that would
otherwise be difficult to see.
Action Buttons
Action buttons are buttons that you create in a presentation that perform an action
when you click them. You can have an action button start a video, give
information, play a sound, or move to a hyperlink.
Animation Effects
Animation effects are builds, movement, and other special effects that can be
applied to objects and text to add interest and variety to a presentation.
Animation Icon
In Slide Sorter view, the animation icon is displayed under all slides that have
animation applied to them.
Animation
Preview
Use the Animation Preview command on the Slide Show menu to preview the
animation effect in the thumbnail.
Animations Animations are effects that allow you to reveal the points on a slide one by one.
Application
Window
The PowerPoint application window holds the current presentation. It consists of
the default toolbars, but many of the tools and menu items are not available if a
presentation is not open.
Area Chart
Area charts show the relative importance of values over a period of time, placing
emphasis on the amount of change.
Audience
Handouts
Audience handouts are small, printed versions of your slides that can contain an
area for notes. They are usually printed and distributed to the audience.
AutoClipArt
Use the AutoClipArt command to begin a concept keyword search of your
slideshow. PowerPoint searches your slideshow for keywords that relate to the
keywords associated with clip art images in the Clip Gallery.
AutoContent
Wizard
The AutoContent Wizard guides you through a number of formatting selections
that will help you develop a clear, professional style for your presentation.
AutoLayouts
AutoLayouts are slide layouts that have ready-made placeholders for titles, text,
and objects such as clip art, graphs, and charts.
AutoShapes
AutoShapes are the shapes that are drawn automatically when you click the button
representing the shape, and drag the drawing tool to the desired size.
Background
The Background dialog box provides various options that let you change the
background look of a single slide or every slide in the presentation.
Background Fill
The Background fill options, located in the Background dialog box, allow you to
change the color, shading, pattern, texture, and picture of slide backgrounds.
Background
Items
Background items are any objects that are added to the Slide Master that appear on
all of the slides in a presentation that follow the Slide Master’s formatting. Any
object on the master, other than the master title and text, is considered to be a
background item, including art, logos, the date and time, slide numbers, and the
presentation name.
Bar Chart
Bar charts show individual figures at a specific time or show a comparison
between items.
Basic Shapes
Basic shapes are shapes that can be created by simply clicking the appropriate
Drawing tool, then clicking and dragging it to form that shape.
Blank
Presentation
The Blank Presentation option opens PowerPoint’s default presentation. You can
design or save any presentation as the default so that presentation will open every
time you select the Blank Presentation option.
Branching Slides
Branching slides provides one way to make one presentation to suit different
audiences. Branching allows you to have two or more slide shows within a single
slide show where you can run each when appropriate.
Bring Forward
The Bring Forward option on the Order submenu allows you to send objects
forward one level or layer of a slide at a time.
Bring To Front
The Bring to Front option on the Order submenu allows you to send objects all the
way to the front or top level or layer of a slide.
Bubble Chart
Bubble charts are a type of chart that show the relationships between the chart
values by the size of the circles.
Build
A build is a feature that is formed when bullets or objects appear one at a time with
animated effects.
Builds Builds are effects that allow you to reveal the points on a slide one by one.
Bullets Bullets are dots, arrows, or other symbols used to identify items in a list.
Case
Case determines whether letters are capital (uppercase) or non-capital (lowercase.)
This option allows you to change the case of a selected letter, letters, or text.
Cell
A cell is the intersection of a row and a column. Each cell is identified by the
column letter and the row number, such as A1.
Chart A chart is a diagram of relationships or comparisons between two or more things.
Clip Art
Clip art is a collection of professionally designed images that can be inserted into a
presentation.
Clip Art
Categories
Clip art categories in the ClipArt Gallery are topics that group similar types of clip
art.
Close
Use the Close command to exit an active presentation without leaving the
application.
Column Chart
Column charts show a variation over a period of time, or they show a comparison
between items.
Columns Columns are the vertical divisions of a datasheet that are identified by letters.
Common Tasks
Toolbar
The Common Tasks toolbar appears as a floating toolbar on the PowerPoint
screen. It consists of options that allow you to quickly access commonly used
dialog boxes, and these options change depending on your current process.
Crop Tool The Crop tool allows you to alter an object by hiding or cutting portions of it.
Data Data is related information that is grouped and manipulated by an application.
Data Labels
Data labels provide additional information about the sections of a chart, such as
values, names of data series or categories, percentages, or a combination of these.
Data Series A data series is a group of figures about one item. For instance, if you are charting
the sales figures for cogs and widgets for the last year, all of the cog figures make
up the cog data series.
Datasheet Datasheets contain related information or data to be analyzed.
Doughnut Chart
Doughnut charts show the proportions of parts to a whole and can show more than
one series of data.
Drag-and-drop
Drag-and-drop is clicking the mouse button and holding it on a selected item, then
dragging the item to a new location and releasing the mouse button.
Drag-select
Use drag-select to select text. With the I-beam mouse pointer, click before the text
you want to select, and drag to the end of the text you want to select. The selected
text appears highlighted (with a dark background) and is ready to be changed.
Drawing Toolbar
The Drawing toolbar is located on the left side of the PowerPoint window, and
contains buttons that provide quick access to commonly used drawing tools and
functions.
Drawing Tools
Drawing tools include AutoShapes, lines, and other options that make it easy to
draw, color, or position presentation objects.
Elapsed Time
The elapsed time for the slides that have been rehearsed is displayed on the left
side of the Rehearsal Timer.
Exit Use the Exit command to close all active presentations as well as the application.
Fill Effects
Select Fill Effects in the Background fill section of the Background dialog box to
choose from a variety of effects, including textures and patterns.
Find The Find option allows you to locate every instance of a specified word or words.
Floating Toolbar
A floating toolbar is any toolbar that appears as a box in the working screen area.
Any toolbar can be made into a floating toolbar by simply clicking-and-dragging
the toolbar to the working screen area.
Font Embedding
Font embedding saves TrueType fonts in a presentation so text will be properly
displayed on other computers.
Font Size
A font size is the size of a font measured in points. The more points there are in a
font, the larger it will appear. There are 72 points to an inch.
Footer
A footer is any information located in the bottom margin of a document that is
repeated on every page or every other page, such as page numbers or file names.
Formatting
Toolbar
The Formatting toolbar is located beneath the Standard toolbar, and contains
buttons that provide quick access to commonly used formatting tools and options
for the application.
Graphical Builds
A graphical build is a series of objects that are placed on a slide one at a time to
create an animated effect.
Graphics Graphics are images such as clip art, word art, graphs, and charts.
Handouts
Handouts are smaller versions of your slides that are printed and can be distributed
to the audience.
Header
A header is any information located in the top margin of a document that is
repeated on every page or every other page, such as document titles or the date.
Hidden Slides
Hidden slides do not automatically appear in a presentation. You must prompt
them by using a simple keystroke or menu option.
Legend
A legend is a box that contains entries and keys that help identify the data series in
a chart.
Legend Key
The legend key is the symbol that appears next to the legend text that shows a
sample of each data series indicator on the chart.
Legend Text
Legend text is the text that appears in a legend that identifies the data series on the
chart.
Line Chart
Line charts show trends or changes in data over a period of time and at even
intervals.
Linking Slides
Linking slides provides a way to make one presentation suit different audiences.
Linking allows you to link a slide or presentation to the current presentation. You
can then choose to run the presentation with or without the linked slide(s).
Master Text
The Master text (Object Area for AutoLayouts) is the placeholder that contains the
formatting for the main text on the Slide Master. This placeholder contains the
font, color, size, line spacing, and alignment settings of the main text as well as the
text’s attributes, shape, and placement.
Master Title
The Master title (Title Area for AutoLayouts) is the placeholder that holds the
formatting for the titles on a Slide Master. This placeholder contains the font,
color, size, alignment, and line spacing settings of the slides titles as well as the
text’s attributes, shape, and placement.
Microsoft Clip
Gallery
The Microsoft Clip Gallery is a supplemental application that gives you access to
clip art, pictures, sounds, and video clips. Most of the clip art, pictures, sounds,
and video clips are located on a CD-ROM, and can be imported from the Clip
Gallery dialog box. The Clip Gallery helps you organize and find the clip art and
other elements easily.
Microsoft Graph
Microsoft Graph is a supplementary application that allows you to create charts in
PowerPoint.
Microsoft Org
Chart
Microsoft Organization Chart (also referred to as an Org Chart) is a supplementary
application that allows you to create organization charts in PowerPoint.
Monotype Sorts
Monotype Sorts is a TrueType font that provides a variety of bullet styles. The
Monotype Sorts font appears on most computers on which Windows has been
installed.
Mouse Pointer
The mouse pointer is the arrow that shows up on the screen and is directed by the
mouse. The mouse pointer often changes appearance depending on where it is
positioned or what action you are taking.
New
Use the New command to create a new presentation. The New command allows
you to create a presentation from scratch, or it offers a variety of designs and
formats that can be used as a starting point.
Notes Pages
Notes Pages contain a reduced image of a slide as well as an area to include
speakers notes.
Office Assistant
The Office Assistant appears on all PowerPoint screens until you close it and can
be used to get help and tips on using PowerPoint.
Online
Presentation
An online presentation is an electronic slide show that is run on or projected from
a computer.
Options
Options on the Tools menu allows you to set your preferences for PowerPoint
functions, such as the maximum number of undos, smart quotes, and viewing non-
printing characters.
Order Use the Order command to rearrange the order of objects on a slide.
Organization
Boxes
Organization boxes are the boxes within an Organization chart that contain the
name and job information for each position.
Organization
Chart
An organization chart is a diagram or map that shows the hierarchy of a group or
business. It usually shows a person’s name, and the position that person holds
within the group or business.
Outline View
Outline view allows you to work with slide titles and main text without being
distracted by background colors and graphics. You can see most of the text in your
presentation at a glance instead of scrolling from slide to slide. You can also
rearrange the order and organization of your slides and text, and make formatting
changes.
Outlining Toolbar
The Outlining toolbar is available in Outline view by default, and is located on the
left side of the window. The Outlining toolbar has buttons that provide quick
access to outlining features such as indenting and text relocation.
Pack And Go
Pack And Go “wraps up” your presentations and all of its elements, along with the
PowerPoint Viewer, into a Pack and Go executable file so you can load and view it
on any machine.
Pack And Go
Wizard
The Pack and Go Wizard is a series of dialog boxes that walks you through
packaging a presentation so you can show it on other computers.
Pen Tool Use the pen tool to mark on the slides during a presentation.
Picture
Pictures can be anything from scanned photographs to line art images to artwork
from compact discs.
Picture Toolbar
Use the Picture toolbar to quickly make changes to the selected image. The Picture
toolbar appears as a floating toolbar whenever you have an image selected.
Pie Chart Pie charts show the proportions of parts to a whole.
Placeholders
Placeholders are predefined areas on Master slides and AutoLayouts that designate
where specific objects or text should be placed.
Placement Line
The placement line appears in Outline view as you drag a slide icon to a new
location. The line is used to make placement easier.
PowerPoint
Viewer
The PowerPoint Viewer is a program that comes with PowerPoint, but it allows
you to view presentations without having PowerPoint installed.
Presentation
A presentation is a collection of slides, handouts, speaker’s notes, and an outline,
all combined into a file that can be printed onto transparencies or projected from a
computer.
Presentation
Designs
The Presentation Designs card in the New Presentation dialog box is a collection
of templates that helps you determine the color scheme, fonts, and other design
features of your presentation.
Presentation
Templates File
A Presentation Templates file is any presentation background that is saved as a
template. You can modify existing templates or create new templates from scratch,
then save them as a Presentation Template.
Preset Animations
Use PowerPoint’s preset animation effects to quickly apply interesting animation
effects to your slide show.
Print Range The Print Range option in the Print dialog box allows you to specify what pages of
a document you want to print.
Print What
The Print What option in the Print dialog box allows you to specify in what format
you want the document to print.
Radar Chart
Radar charts show changes or frequencies of series of data relative to a center
point and relative to each other.
Regular Shapes
Regular shapes refer to perfectly proportioned shapes, such as circles and squares,
that can be inscribed within a square, or any shape with equal sides or equal
distance from the center.
Rehearsal Timer
The Rehearsal Timer allows you to set timings for your slides so you can run the
presentation on its own.
Replace Use Replace on the Edit menu to search for and replace specified text.
Resize Handles
Resize handles are small, solid boxes that appear in the border of a selected object.
The resize handles are used to change the size of the selected object.
Rows Rows are the horizontal divisions of a datasheet that are identified by numbers.
Ruler Guides
The ruler guides are the lines on the ruler that move according to the pointer
position. These lines help position the location of the pointer.
Rulers Use rulers to help align and size objects on your slide.
Select
In order to work with an object, you must first select or activate it. One way to
select an object by clicking it once with the mouse.
Selection Box
A selection box appears around a text box when it is selected on a PowerPoint
slide. It includes the selection handles. It also appears around items as you click-
and-drag the mouse pointer around a group of objects you want to select.
Selection Handles
Selection handles, which look like small squares, appear on objects when they are
selected on a PowerPoint slide. They can be used to change the size of the object.
Send Backward
The Send Backward option on the Order submenu allows you to send objects back
one level or layer of a slide at a time.
Send To Back
The Send to Back option on the Order submenu allows you to send objects all the
way to the back level or layer of a slide.
Shade Styles
Shading an object in PowerPoint creates a gradient effect — a gradual shift from
one color to another. All objects in PowerPoint can be filled with a shaded color.
Shading
Shading is a modification of a color that is made by adding complementary colors
or small amounts of black.
Shading Fill Shading Fill sets the overall style or direction of the shading.
Shadow
Use the Shadow effect to emphasize text. It produces a drop-shadow behind the
text.
Slide Color
Scheme
The Slide Color Scheme option on the Format menu lets you change colors in a
color scheme, or select new colors for a single slide or an entire presentation.
Slide Icon
A slide icon is the graphical representation of a slide in Outline View that appears
where each slide begins. The slide icon also displays small shapes if any graphics
or other objects exist on the slide.
Slide Master
The Slide Master is the slide that holds the formatting for the title, the text, and
any background items that appear on the slides. Any text styles or graphics that
appear on the Slide Master will appear on all of the slides in a presentation.
Slide Navigator
The Slide Navigator allows you to go to any slide in your presentation while in
Slide view.
Slide Show Menu
Icon
Click the Slide Show Menu icon to open a menu with options to apply in Slide
Show view.
Slide Show View
Slide Show View shows how a presentation will look when you run it. This allows
you to do a test run and even create timed presentations.
Slide Sorter
Toolbar
The Slide Sorter toolbar is available only in Slide Sorter view, and allows quick
access to special PowerPoint effects such as transitions, builds, rehearse timing,
and hide slides.
Slide Sorter View
Slide Sorter View displays a reduced image of all the slides in a grid-like fashion.
This view makes it easier to rearrange the slides in a presentation and add
transitions and special effects.
Slide View
Slide View allows you to work on one slide at a time. While in Slide View, you
can add any element to a slide, including text, graphics, shapes, and graphs.
Slides
Slides are the individual pages of your presentation. Slides can be designed with
different titles, graphics, text, and much more.
Speaker’s Notes
Speaker’s Notes are pages with a copy of a slide on top and space below it for
taking notes.
Standard Toolbar
The Standard toolbar is located beneath the menu bar, and contains buttons that
provide quick access to commonly used tools and options for the application.
Status Bar
The status bar is the area at the bottom of a window that provides messages that
describe what you are seeing and doing in the presentation as you work.
Subordinate A subordinate is someone in a lower rank or position.
Supplementary
Application
A supplementary application is an application that can be opened and used within
PowerPoint. Microsoft Graph, Microsoft Organization Chart, and Microsoft
WordArt are examples of supplementary applications.
Template
A template is a slide or presentation that provides a predefined format and color
scheme that can be applied to another presentation. PowerPoint provides more
than 100 professionally designed templates, or you can use an existing
presentation as a template.
Thumbnail
A thumbnail is a small view of the current slide. It appears in several different
PowerPoint screens, including Outline view.
Thumbnail Prints
Thumbnail prints are small printed versions of slides. You can print 2, 3, or 6
thumbnails on a single page.
Title Case Title case is when each major word in the text starts with a capital letter.
Title Master The Title Master holds the master format for title slides in a presentation.
Title Slide
The Title slide is an AutoLayout that provides placeholders for a title and a subtitle
for a presentation.
Transition
A transition is an effect that can be run between slides to signal a shift from one
slide to the next.
Transition Icon
In Slide Sorter view, a transition icon appears under every slide that has a
transition applied to it.
Transitions A transition is an effect that can be run between slides to signal a shift from one
slide to the next.
TrueType Fonts
TrueType fonts are scaled to fit your presentation so they always present a smooth,
clear image. They are designed to be used on any printer and in any type size.
Ungrouping
Objects
Ungrouping objects allows you to work with each part of a grouped object
individually.
Variant Variants are different shading orders of a selected style.
WordArt
WordArt is a supplementary application that can be used to manipulate text into
shapes. For instance, you can make a phrase or sentence form a circle.
XY (Scatter)
Chart
XY (scatter) charts show the relationship between the numeric values in several
series of data.

More Related Content

What's hot

Microsoft Power Point 2010
Microsoft Power Point 2010Microsoft Power Point 2010
Microsoft Power Point 2010
home
 
Image Editing With Photoshop Cs
Image Editing With Photoshop CsImage Editing With Photoshop Cs
Image Editing With Photoshop Cs
brighteyes
 
Introduction to word processing
Introduction to word processingIntroduction to word processing
Introduction to word processing
Iddrisu Issah
 
MS Excel
MS ExcelMS Excel
MS Word
MS WordMS Word
MS Word
sachinupreti2
 
Excel lesson01
Excel lesson01Excel lesson01
Excel lesson01
Erik Hardiyanto
 
Word Processing Introduction
Word Processing IntroductionWord Processing Introduction
Word Processing Introduction
Danny Ambrosio
 
Introduction to spreadsheets
Introduction to spreadsheetsIntroduction to spreadsheets
Introduction to spreadsheets
Tracy Gilmer
 
Ms word 2010 by sachin sharma
Ms word 2010 by sachin sharmaMs word 2010 by sachin sharma
PowerPoint basics
PowerPoint basicsPowerPoint basics
PowerPoint basics
hope baido
 
Making Powerpoint Presentation
Making Powerpoint PresentationMaking Powerpoint Presentation
Making Powerpoint Presentation
Je Escober
 
Intro to Computers
Intro to ComputersIntro to Computers
Intro to Computers
Pamela Seabolt
 
Introduction to powerpoint
Introduction to powerpointIntroduction to powerpoint
Introduction to powerpoint
BESOR ACADEMY
 
Introduction to ms power point Grade 9
Introduction to ms power point Grade 9Introduction to ms power point Grade 9
Introduction to ms power point Grade 9
ninoallandanganancarpio
 
MS PowerPoint 2010 tutorial 1
MS PowerPoint 2010 tutorial 1MS PowerPoint 2010 tutorial 1
MS PowerPoint 2010 tutorial 1Khalfan Alshuaili
 
Microsoft Excel
Microsoft ExcelMicrosoft Excel
Microsoft Excel
YasirKhan357
 

What's hot (20)

Microsoft Power Point 2010
Microsoft Power Point 2010Microsoft Power Point 2010
Microsoft Power Point 2010
 
Insert a picture in Word
Insert a picture in WordInsert a picture in Word
Insert a picture in Word
 
Image Editing With Photoshop Cs
Image Editing With Photoshop CsImage Editing With Photoshop Cs
Image Editing With Photoshop Cs
 
Introduction to word processing
Introduction to word processingIntroduction to word processing
Introduction to word processing
 
MS Excel
MS ExcelMS Excel
MS Excel
 
Excel Tutorial
Excel TutorialExcel Tutorial
Excel Tutorial
 
MS Word
MS WordMS Word
MS Word
 
Excel lesson01
Excel lesson01Excel lesson01
Excel lesson01
 
Word Processing Introduction
Word Processing IntroductionWord Processing Introduction
Word Processing Introduction
 
Introduction to spreadsheets
Introduction to spreadsheetsIntroduction to spreadsheets
Introduction to spreadsheets
 
Ms word 2010 by sachin sharma
Ms word 2010 by sachin sharmaMs word 2010 by sachin sharma
Ms word 2010 by sachin sharma
 
PowerPoint basics
PowerPoint basicsPowerPoint basics
PowerPoint basics
 
Making Powerpoint Presentation
Making Powerpoint PresentationMaking Powerpoint Presentation
Making Powerpoint Presentation
 
Zekepowerpoint
ZekepowerpointZekepowerpoint
Zekepowerpoint
 
Word Lecture 1
Word Lecture 1Word Lecture 1
Word Lecture 1
 
Intro to Computers
Intro to ComputersIntro to Computers
Intro to Computers
 
Introduction to powerpoint
Introduction to powerpointIntroduction to powerpoint
Introduction to powerpoint
 
Introduction to ms power point Grade 9
Introduction to ms power point Grade 9Introduction to ms power point Grade 9
Introduction to ms power point Grade 9
 
MS PowerPoint 2010 tutorial 1
MS PowerPoint 2010 tutorial 1MS PowerPoint 2010 tutorial 1
MS PowerPoint 2010 tutorial 1
 
Microsoft Excel
Microsoft ExcelMicrosoft Excel
Microsoft Excel
 

Similar to Microsoft Powerpoint Glossary

MS PowerPoint, Excel & Publisher Module
MS PowerPoint, Excel & Publisher ModuleMS PowerPoint, Excel & Publisher Module
MS PowerPoint, Excel & Publisher Module
Maria Dinah Alejo Dimacali
 
Vocabulary
VocabularyVocabulary
PowerPoint Tutorial
PowerPoint TutorialPowerPoint Tutorial
PowerPoint Tutorial
Ashford University
 
Microsoft Word Glossary and Keyboard Shortcuts
Microsoft Word Glossary and Keyboard ShortcutsMicrosoft Word Glossary and Keyboard Shortcuts
Microsoft Word Glossary and Keyboard Shortcuts
sdturton
 
Sketch 3 manual
Sketch 3 manualSketch 3 manual
Sketch 3 manual
Andrea Chagas
 
Ms publisher parts and functions by Ma'am Arlene Calica
Ms publisher parts and functions by Ma'am Arlene CalicaMs publisher parts and functions by Ma'am Arlene Calica
Ms publisher parts and functions by Ma'am Arlene Calica
Leona Rose Beltran
 
Excel Glosarry
Excel GlosarryExcel Glosarry
Excel Glosarry
aurino djamaris
 
Ms publisher parts and functions
Ms publisher parts and functionsMs publisher parts and functions
Ms publisher parts and functionsLeona Rose Beltran
 
Learn MS Powerpoint basics
Learn MS Powerpoint basicsLearn MS Powerpoint basics
Learn MS Powerpoint basics
vethics
 
Ms Word (Insert Option)
Ms Word (Insert Option)Ms Word (Insert Option)
Ms Word (Insert Option)
Saransh Arora
 
Microsoft 2010 word glossary
Microsoft 2010 word glossaryMicrosoft 2010 word glossary
Microsoft 2010 word glossaryJoe Mingo
 
Creating & Editing Charts In Microsoft Excel 2003
Creating & Editing Charts In Microsoft Excel 2003Creating & Editing Charts In Microsoft Excel 2003
Creating & Editing Charts In Microsoft Excel 2003bud_00
 
Exp2003 exl ppt_03
Exp2003 exl ppt_03Exp2003 exl ppt_03
Exp2003 exl ppt_03
lonetree
 
Microsoft power point
Microsoft power pointMicrosoft power point
Microsoft power point
Central Luzon State University
 
Powerpoint slide
Powerpoint slidePowerpoint slide
Powerpoint slide
T_design
 
INFORMATION TECHNOLOGY (ICT Skills ).pptx
INFORMATION TECHNOLOGY (ICT Skills ).pptxINFORMATION TECHNOLOGY (ICT Skills ).pptx
INFORMATION TECHNOLOGY (ICT Skills ).pptx
ArshveerSinghDhillon
 
Print16
Print16Print16
Print16
Hassan Samoon
 
microsoft powerpoint interface.pptx
microsoft powerpoint interface.pptxmicrosoft powerpoint interface.pptx
microsoft powerpoint interface.pptx
MariaSocorroButalAut
 

Similar to Microsoft Powerpoint Glossary (20)

MS PowerPoint, Excel & Publisher Module
MS PowerPoint, Excel & Publisher ModuleMS PowerPoint, Excel & Publisher Module
MS PowerPoint, Excel & Publisher Module
 
Word
WordWord
Word
 
Vocabulary
VocabularyVocabulary
Vocabulary
 
PowerPoint Tutorial
PowerPoint TutorialPowerPoint Tutorial
PowerPoint Tutorial
 
Microsoft Word Glossary and Keyboard Shortcuts
Microsoft Word Glossary and Keyboard ShortcutsMicrosoft Word Glossary and Keyboard Shortcuts
Microsoft Word Glossary and Keyboard Shortcuts
 
Sketch 3 manual
Sketch 3 manualSketch 3 manual
Sketch 3 manual
 
Ms publisher parts and functions by Ma'am Arlene Calica
Ms publisher parts and functions by Ma'am Arlene CalicaMs publisher parts and functions by Ma'am Arlene Calica
Ms publisher parts and functions by Ma'am Arlene Calica
 
Excel Glosarry
Excel GlosarryExcel Glosarry
Excel Glosarry
 
Ms publisher parts and functions
Ms publisher parts and functionsMs publisher parts and functions
Ms publisher parts and functions
 
Learn MS Powerpoint basics
Learn MS Powerpoint basicsLearn MS Powerpoint basics
Learn MS Powerpoint basics
 
Ms Word (Insert Option)
Ms Word (Insert Option)Ms Word (Insert Option)
Ms Word (Insert Option)
 
Microsoft 2010 word glossary
Microsoft 2010 word glossaryMicrosoft 2010 word glossary
Microsoft 2010 word glossary
 
Creating & Editing Charts In Microsoft Excel 2003
Creating & Editing Charts In Microsoft Excel 2003Creating & Editing Charts In Microsoft Excel 2003
Creating & Editing Charts In Microsoft Excel 2003
 
Exp2003 exl ppt_03
Exp2003 exl ppt_03Exp2003 exl ppt_03
Exp2003 exl ppt_03
 
Microsoft power point
Microsoft power pointMicrosoft power point
Microsoft power point
 
Powerpoint slide
Powerpoint slidePowerpoint slide
Powerpoint slide
 
INFORMATION TECHNOLOGY (ICT Skills ).pptx
INFORMATION TECHNOLOGY (ICT Skills ).pptxINFORMATION TECHNOLOGY (ICT Skills ).pptx
INFORMATION TECHNOLOGY (ICT Skills ).pptx
 
Print16
Print16Print16
Print16
 
(Sept.1) environment
(Sept.1) environment(Sept.1) environment
(Sept.1) environment
 
microsoft powerpoint interface.pptx
microsoft powerpoint interface.pptxmicrosoft powerpoint interface.pptx
microsoft powerpoint interface.pptx
 

More from sdturton

World and Human Geography Textbooks, Workbooks, Maps & Readers
World and Human Geography Textbooks, Workbooks, Maps & ReadersWorld and Human Geography Textbooks, Workbooks, Maps & Readers
World and Human Geography Textbooks, Workbooks, Maps & Readers
sdturton
 
7 Precalculus STEM Lessons from NASA
7 Precalculus STEM Lessons from NASA7 Precalculus STEM Lessons from NASA
7 Precalculus STEM Lessons from NASA
sdturton
 
6 Geometry Stem Lessons from NASA
6 Geometry Stem Lessons from NASA6 Geometry Stem Lessons from NASA
6 Geometry Stem Lessons from NASA
sdturton
 
Native American Dance, Music and Culture Lessons and Videos
Native American Dance, Music and Culture Lessons and VideosNative American Dance, Music and Culture Lessons and Videos
Native American Dance, Music and Culture Lessons and Videos
sdturton
 
Keyboard Shortcuts for Outlook
Keyboard Shortcuts for OutlookKeyboard Shortcuts for Outlook
Keyboard Shortcuts for Outlook
sdturton
 
Microsoft Excel Glossary & Keyboard Shortcuts-Function Keys
Microsoft Excel Glossary & Keyboard Shortcuts-Function KeysMicrosoft Excel Glossary & Keyboard Shortcuts-Function Keys
Microsoft Excel Glossary & Keyboard Shortcuts-Function Keys
sdturton
 
Free Oracle Training
Free Oracle TrainingFree Oracle Training
Free Oracle Training
sdturton
 
Fifth grade language arts lessons & activities by core knowledge
Fifth grade language arts lessons & activities by core knowledgeFifth grade language arts lessons & activities by core knowledge
Fifth grade language arts lessons & activities by core knowledge
sdturton
 
42 academic and specific vocabulary & spelling lists with definitions and...
42 academic and specific vocabulary & spelling lists with definitions and...42 academic and specific vocabulary & spelling lists with definitions and...
42 academic and specific vocabulary & spelling lists with definitions and...
sdturton
 
Lone dogs winter count, lakota dakota lesson with supplements, grades 4 8
Lone dogs winter count, lakota dakota lesson with supplements, grades 4 8Lone dogs winter count, lakota dakota lesson with supplements, grades 4 8
Lone dogs winter count, lakota dakota lesson with supplements, grades 4 8
sdturton
 
308 algebra ii videos by khan academy
308 algebra ii videos by khan academy308 algebra ii videos by khan academy
308 algebra ii videos by khan academy
sdturton
 
589 algebra i videos by khan academy
589 algebra i videos by khan academy589 algebra i videos by khan academy
589 algebra i videos by khan academy
sdturton
 
Traditional native art lessons with supplements, grades 2 6
Traditional native art lessons with supplements, grades 2 6Traditional native art lessons with supplements, grades 2 6
Traditional native art lessons with supplements, grades 2 6
sdturton
 
4 Natural Science and Technology Textbooks with Videos, Grades 4-6
4 Natural Science and Technology Textbooks with Videos, Grades 4-64 Natural Science and Technology Textbooks with Videos, Grades 4-6
4 Natural Science and Technology Textbooks with Videos, Grades 4-6
sdturton
 
Cherokee Trail of Tears Lessons, Activities, Materials and Videos
Cherokee Trail of Tears Lessons, Activities, Materials and VideosCherokee Trail of Tears Lessons, Activities, Materials and Videos
Cherokee Trail of Tears Lessons, Activities, Materials and Videos
sdturton
 
30 Art Lesson Activities and Projects – All Grades
30 Art Lesson Activities and Projects – All Grades30 Art Lesson Activities and Projects – All Grades
30 Art Lesson Activities and Projects – All Grades
sdturton
 
18 Algebra Textbooks
18 Algebra Textbooks18 Algebra Textbooks
18 Algebra Textbooks
sdturton
 

More from sdturton (17)

World and Human Geography Textbooks, Workbooks, Maps & Readers
World and Human Geography Textbooks, Workbooks, Maps & ReadersWorld and Human Geography Textbooks, Workbooks, Maps & Readers
World and Human Geography Textbooks, Workbooks, Maps & Readers
 
7 Precalculus STEM Lessons from NASA
7 Precalculus STEM Lessons from NASA7 Precalculus STEM Lessons from NASA
7 Precalculus STEM Lessons from NASA
 
6 Geometry Stem Lessons from NASA
6 Geometry Stem Lessons from NASA6 Geometry Stem Lessons from NASA
6 Geometry Stem Lessons from NASA
 
Native American Dance, Music and Culture Lessons and Videos
Native American Dance, Music and Culture Lessons and VideosNative American Dance, Music and Culture Lessons and Videos
Native American Dance, Music and Culture Lessons and Videos
 
Keyboard Shortcuts for Outlook
Keyboard Shortcuts for OutlookKeyboard Shortcuts for Outlook
Keyboard Shortcuts for Outlook
 
Microsoft Excel Glossary & Keyboard Shortcuts-Function Keys
Microsoft Excel Glossary & Keyboard Shortcuts-Function KeysMicrosoft Excel Glossary & Keyboard Shortcuts-Function Keys
Microsoft Excel Glossary & Keyboard Shortcuts-Function Keys
 
Free Oracle Training
Free Oracle TrainingFree Oracle Training
Free Oracle Training
 
Fifth grade language arts lessons & activities by core knowledge
Fifth grade language arts lessons & activities by core knowledgeFifth grade language arts lessons & activities by core knowledge
Fifth grade language arts lessons & activities by core knowledge
 
42 academic and specific vocabulary & spelling lists with definitions and...
42 academic and specific vocabulary & spelling lists with definitions and...42 academic and specific vocabulary & spelling lists with definitions and...
42 academic and specific vocabulary & spelling lists with definitions and...
 
Lone dogs winter count, lakota dakota lesson with supplements, grades 4 8
Lone dogs winter count, lakota dakota lesson with supplements, grades 4 8Lone dogs winter count, lakota dakota lesson with supplements, grades 4 8
Lone dogs winter count, lakota dakota lesson with supplements, grades 4 8
 
308 algebra ii videos by khan academy
308 algebra ii videos by khan academy308 algebra ii videos by khan academy
308 algebra ii videos by khan academy
 
589 algebra i videos by khan academy
589 algebra i videos by khan academy589 algebra i videos by khan academy
589 algebra i videos by khan academy
 
Traditional native art lessons with supplements, grades 2 6
Traditional native art lessons with supplements, grades 2 6Traditional native art lessons with supplements, grades 2 6
Traditional native art lessons with supplements, grades 2 6
 
4 Natural Science and Technology Textbooks with Videos, Grades 4-6
4 Natural Science and Technology Textbooks with Videos, Grades 4-64 Natural Science and Technology Textbooks with Videos, Grades 4-6
4 Natural Science and Technology Textbooks with Videos, Grades 4-6
 
Cherokee Trail of Tears Lessons, Activities, Materials and Videos
Cherokee Trail of Tears Lessons, Activities, Materials and VideosCherokee Trail of Tears Lessons, Activities, Materials and Videos
Cherokee Trail of Tears Lessons, Activities, Materials and Videos
 
30 Art Lesson Activities and Projects – All Grades
30 Art Lesson Activities and Projects – All Grades30 Art Lesson Activities and Projects – All Grades
30 Art Lesson Activities and Projects – All Grades
 
18 Algebra Textbooks
18 Algebra Textbooks18 Algebra Textbooks
18 Algebra Textbooks
 

Recently uploaded

The Future of Platform Engineering
The Future of Platform EngineeringThe Future of Platform Engineering
The Future of Platform Engineering
Jemma Hussein Allen
 
Kubernetes & AI - Beauty and the Beast !?! @KCD Istanbul 2024
Kubernetes & AI - Beauty and the Beast !?! @KCD Istanbul 2024Kubernetes & AI - Beauty and the Beast !?! @KCD Istanbul 2024
Kubernetes & AI - Beauty and the Beast !?! @KCD Istanbul 2024
Tobias Schneck
 
Connector Corner: Automate dynamic content and events by pushing a button
Connector Corner: Automate dynamic content and events by pushing a buttonConnector Corner: Automate dynamic content and events by pushing a button
Connector Corner: Automate dynamic content and events by pushing a button
DianaGray10
 
From Siloed Products to Connected Ecosystem: Building a Sustainable and Scala...
From Siloed Products to Connected Ecosystem: Building a Sustainable and Scala...From Siloed Products to Connected Ecosystem: Building a Sustainable and Scala...
From Siloed Products to Connected Ecosystem: Building a Sustainable and Scala...
Product School
 
Mission to Decommission: Importance of Decommissioning Products to Increase E...
Mission to Decommission: Importance of Decommissioning Products to Increase E...Mission to Decommission: Importance of Decommissioning Products to Increase E...
Mission to Decommission: Importance of Decommissioning Products to Increase E...
Product School
 
Empowering NextGen Mobility via Large Action Model Infrastructure (LAMI): pav...
Empowering NextGen Mobility via Large Action Model Infrastructure (LAMI): pav...Empowering NextGen Mobility via Large Action Model Infrastructure (LAMI): pav...
Empowering NextGen Mobility via Large Action Model Infrastructure (LAMI): pav...
Thierry Lestable
 
Accelerate your Kubernetes clusters with Varnish Caching
Accelerate your Kubernetes clusters with Varnish CachingAccelerate your Kubernetes clusters with Varnish Caching
Accelerate your Kubernetes clusters with Varnish Caching
Thijs Feryn
 
Knowledge engineering: from people to machines and back
Knowledge engineering: from people to machines and backKnowledge engineering: from people to machines and back
Knowledge engineering: from people to machines and back
Elena Simperl
 
Transcript: Selling digital books in 2024: Insights from industry leaders - T...
Transcript: Selling digital books in 2024: Insights from industry leaders - T...Transcript: Selling digital books in 2024: Insights from industry leaders - T...
Transcript: Selling digital books in 2024: Insights from industry leaders - T...
BookNet Canada
 
Epistemic Interaction - tuning interfaces to provide information for AI support
Epistemic Interaction - tuning interfaces to provide information for AI supportEpistemic Interaction - tuning interfaces to provide information for AI support
Epistemic Interaction - tuning interfaces to provide information for AI support
Alan Dix
 
Key Trends Shaping the Future of Infrastructure.pdf
Key Trends Shaping the Future of Infrastructure.pdfKey Trends Shaping the Future of Infrastructure.pdf
Key Trends Shaping the Future of Infrastructure.pdf
Cheryl Hung
 
JMeter webinar - integration with InfluxDB and Grafana
JMeter webinar - integration with InfluxDB and GrafanaJMeter webinar - integration with InfluxDB and Grafana
JMeter webinar - integration with InfluxDB and Grafana
RTTS
 
FIDO Alliance Osaka Seminar: Overview.pdf
FIDO Alliance Osaka Seminar: Overview.pdfFIDO Alliance Osaka Seminar: Overview.pdf
FIDO Alliance Osaka Seminar: Overview.pdf
FIDO Alliance
 
Smart TV Buyer Insights Survey 2024 by 91mobiles.pdf
Smart TV Buyer Insights Survey 2024 by 91mobiles.pdfSmart TV Buyer Insights Survey 2024 by 91mobiles.pdf
Smart TV Buyer Insights Survey 2024 by 91mobiles.pdf
91mobiles
 
FIDO Alliance Osaka Seminar: Passkeys at Amazon.pdf
FIDO Alliance Osaka Seminar: Passkeys at Amazon.pdfFIDO Alliance Osaka Seminar: Passkeys at Amazon.pdf
FIDO Alliance Osaka Seminar: Passkeys at Amazon.pdf
FIDO Alliance
 
UiPath Test Automation using UiPath Test Suite series, part 4
UiPath Test Automation using UiPath Test Suite series, part 4UiPath Test Automation using UiPath Test Suite series, part 4
UiPath Test Automation using UiPath Test Suite series, part 4
DianaGray10
 
The Art of the Pitch: WordPress Relationships and Sales
The Art of the Pitch: WordPress Relationships and SalesThe Art of the Pitch: WordPress Relationships and Sales
The Art of the Pitch: WordPress Relationships and Sales
Laura Byrne
 
Neuro-symbolic is not enough, we need neuro-*semantic*
Neuro-symbolic is not enough, we need neuro-*semantic*Neuro-symbolic is not enough, we need neuro-*semantic*
Neuro-symbolic is not enough, we need neuro-*semantic*
Frank van Harmelen
 
AI for Every Business: Unlocking Your Product's Universal Potential by VP of ...
AI for Every Business: Unlocking Your Product's Universal Potential by VP of ...AI for Every Business: Unlocking Your Product's Universal Potential by VP of ...
AI for Every Business: Unlocking Your Product's Universal Potential by VP of ...
Product School
 
FIDO Alliance Osaka Seminar: Passkeys and the Road Ahead.pdf
FIDO Alliance Osaka Seminar: Passkeys and the Road Ahead.pdfFIDO Alliance Osaka Seminar: Passkeys and the Road Ahead.pdf
FIDO Alliance Osaka Seminar: Passkeys and the Road Ahead.pdf
FIDO Alliance
 

Recently uploaded (20)

The Future of Platform Engineering
The Future of Platform EngineeringThe Future of Platform Engineering
The Future of Platform Engineering
 
Kubernetes & AI - Beauty and the Beast !?! @KCD Istanbul 2024
Kubernetes & AI - Beauty and the Beast !?! @KCD Istanbul 2024Kubernetes & AI - Beauty and the Beast !?! @KCD Istanbul 2024
Kubernetes & AI - Beauty and the Beast !?! @KCD Istanbul 2024
 
Connector Corner: Automate dynamic content and events by pushing a button
Connector Corner: Automate dynamic content and events by pushing a buttonConnector Corner: Automate dynamic content and events by pushing a button
Connector Corner: Automate dynamic content and events by pushing a button
 
From Siloed Products to Connected Ecosystem: Building a Sustainable and Scala...
From Siloed Products to Connected Ecosystem: Building a Sustainable and Scala...From Siloed Products to Connected Ecosystem: Building a Sustainable and Scala...
From Siloed Products to Connected Ecosystem: Building a Sustainable and Scala...
 
Mission to Decommission: Importance of Decommissioning Products to Increase E...
Mission to Decommission: Importance of Decommissioning Products to Increase E...Mission to Decommission: Importance of Decommissioning Products to Increase E...
Mission to Decommission: Importance of Decommissioning Products to Increase E...
 
Empowering NextGen Mobility via Large Action Model Infrastructure (LAMI): pav...
Empowering NextGen Mobility via Large Action Model Infrastructure (LAMI): pav...Empowering NextGen Mobility via Large Action Model Infrastructure (LAMI): pav...
Empowering NextGen Mobility via Large Action Model Infrastructure (LAMI): pav...
 
Accelerate your Kubernetes clusters with Varnish Caching
Accelerate your Kubernetes clusters with Varnish CachingAccelerate your Kubernetes clusters with Varnish Caching
Accelerate your Kubernetes clusters with Varnish Caching
 
Knowledge engineering: from people to machines and back
Knowledge engineering: from people to machines and backKnowledge engineering: from people to machines and back
Knowledge engineering: from people to machines and back
 
Transcript: Selling digital books in 2024: Insights from industry leaders - T...
Transcript: Selling digital books in 2024: Insights from industry leaders - T...Transcript: Selling digital books in 2024: Insights from industry leaders - T...
Transcript: Selling digital books in 2024: Insights from industry leaders - T...
 
Epistemic Interaction - tuning interfaces to provide information for AI support
Epistemic Interaction - tuning interfaces to provide information for AI supportEpistemic Interaction - tuning interfaces to provide information for AI support
Epistemic Interaction - tuning interfaces to provide information for AI support
 
Key Trends Shaping the Future of Infrastructure.pdf
Key Trends Shaping the Future of Infrastructure.pdfKey Trends Shaping the Future of Infrastructure.pdf
Key Trends Shaping the Future of Infrastructure.pdf
 
JMeter webinar - integration with InfluxDB and Grafana
JMeter webinar - integration with InfluxDB and GrafanaJMeter webinar - integration with InfluxDB and Grafana
JMeter webinar - integration with InfluxDB and Grafana
 
FIDO Alliance Osaka Seminar: Overview.pdf
FIDO Alliance Osaka Seminar: Overview.pdfFIDO Alliance Osaka Seminar: Overview.pdf
FIDO Alliance Osaka Seminar: Overview.pdf
 
Smart TV Buyer Insights Survey 2024 by 91mobiles.pdf
Smart TV Buyer Insights Survey 2024 by 91mobiles.pdfSmart TV Buyer Insights Survey 2024 by 91mobiles.pdf
Smart TV Buyer Insights Survey 2024 by 91mobiles.pdf
 
FIDO Alliance Osaka Seminar: Passkeys at Amazon.pdf
FIDO Alliance Osaka Seminar: Passkeys at Amazon.pdfFIDO Alliance Osaka Seminar: Passkeys at Amazon.pdf
FIDO Alliance Osaka Seminar: Passkeys at Amazon.pdf
 
UiPath Test Automation using UiPath Test Suite series, part 4
UiPath Test Automation using UiPath Test Suite series, part 4UiPath Test Automation using UiPath Test Suite series, part 4
UiPath Test Automation using UiPath Test Suite series, part 4
 
The Art of the Pitch: WordPress Relationships and Sales
The Art of the Pitch: WordPress Relationships and SalesThe Art of the Pitch: WordPress Relationships and Sales
The Art of the Pitch: WordPress Relationships and Sales
 
Neuro-symbolic is not enough, we need neuro-*semantic*
Neuro-symbolic is not enough, we need neuro-*semantic*Neuro-symbolic is not enough, we need neuro-*semantic*
Neuro-symbolic is not enough, we need neuro-*semantic*
 
AI for Every Business: Unlocking Your Product's Universal Potential by VP of ...
AI for Every Business: Unlocking Your Product's Universal Potential by VP of ...AI for Every Business: Unlocking Your Product's Universal Potential by VP of ...
AI for Every Business: Unlocking Your Product's Universal Potential by VP of ...
 
FIDO Alliance Osaka Seminar: Passkeys and the Road Ahead.pdf
FIDO Alliance Osaka Seminar: Passkeys and the Road Ahead.pdfFIDO Alliance Osaka Seminar: Passkeys and the Road Ahead.pdf
FIDO Alliance Osaka Seminar: Passkeys and the Road Ahead.pdf
 

Microsoft Powerpoint Glossary

  • 1. Microsoft PowerPoint Glossary Microsoft PowerPoint Glossary 3-D Chart 3-D charts are any charts that have a three-dimensional appearance, that is, height, width, and depth. 3-D Surface Chart 3-D surface charts show relationships between large amounts of data that would otherwise be difficult to see. Action Buttons Action buttons are buttons that you create in a presentation that perform an action when you click them. You can have an action button start a video, give information, play a sound, or move to a hyperlink. Animation Effects Animation effects are builds, movement, and other special effects that can be applied to objects and text to add interest and variety to a presentation. Animation Icon In Slide Sorter view, the animation icon is displayed under all slides that have animation applied to them. Animation Preview Use the Animation Preview command on the Slide Show menu to preview the animation effect in the thumbnail. Animations Animations are effects that allow you to reveal the points on a slide one by one. Application Window The PowerPoint application window holds the current presentation. It consists of the default toolbars, but many of the tools and menu items are not available if a presentation is not open. Area Chart Area charts show the relative importance of values over a period of time, placing emphasis on the amount of change. Audience Handouts Audience handouts are small, printed versions of your slides that can contain an area for notes. They are usually printed and distributed to the audience. AutoClipArt Use the AutoClipArt command to begin a concept keyword search of your slideshow. PowerPoint searches your slideshow for keywords that relate to the keywords associated with clip art images in the Clip Gallery. AutoContent Wizard The AutoContent Wizard guides you through a number of formatting selections that will help you develop a clear, professional style for your presentation. AutoLayouts AutoLayouts are slide layouts that have ready-made placeholders for titles, text, and objects such as clip art, graphs, and charts. AutoShapes AutoShapes are the shapes that are drawn automatically when you click the button representing the shape, and drag the drawing tool to the desired size. Background The Background dialog box provides various options that let you change the background look of a single slide or every slide in the presentation. Background Fill The Background fill options, located in the Background dialog box, allow you to change the color, shading, pattern, texture, and picture of slide backgrounds. Background Items Background items are any objects that are added to the Slide Master that appear on all of the slides in a presentation that follow the Slide Master’s formatting. Any object on the master, other than the master title and text, is considered to be a background item, including art, logos, the date and time, slide numbers, and the presentation name.
  • 2. Bar Chart Bar charts show individual figures at a specific time or show a comparison between items. Basic Shapes Basic shapes are shapes that can be created by simply clicking the appropriate Drawing tool, then clicking and dragging it to form that shape. Blank Presentation The Blank Presentation option opens PowerPoint’s default presentation. You can design or save any presentation as the default so that presentation will open every time you select the Blank Presentation option. Branching Slides Branching slides provides one way to make one presentation to suit different audiences. Branching allows you to have two or more slide shows within a single slide show where you can run each when appropriate. Bring Forward The Bring Forward option on the Order submenu allows you to send objects forward one level or layer of a slide at a time. Bring To Front The Bring to Front option on the Order submenu allows you to send objects all the way to the front or top level or layer of a slide. Bubble Chart Bubble charts are a type of chart that show the relationships between the chart values by the size of the circles. Build A build is a feature that is formed when bullets or objects appear one at a time with animated effects. Builds Builds are effects that allow you to reveal the points on a slide one by one. Bullets Bullets are dots, arrows, or other symbols used to identify items in a list. Case Case determines whether letters are capital (uppercase) or non-capital (lowercase.) This option allows you to change the case of a selected letter, letters, or text. Cell A cell is the intersection of a row and a column. Each cell is identified by the column letter and the row number, such as A1. Chart A chart is a diagram of relationships or comparisons between two or more things. Clip Art Clip art is a collection of professionally designed images that can be inserted into a presentation. Clip Art Categories Clip art categories in the ClipArt Gallery are topics that group similar types of clip art. Close Use the Close command to exit an active presentation without leaving the application. Column Chart Column charts show a variation over a period of time, or they show a comparison between items. Columns Columns are the vertical divisions of a datasheet that are identified by letters. Common Tasks Toolbar The Common Tasks toolbar appears as a floating toolbar on the PowerPoint screen. It consists of options that allow you to quickly access commonly used dialog boxes, and these options change depending on your current process. Crop Tool The Crop tool allows you to alter an object by hiding or cutting portions of it. Data Data is related information that is grouped and manipulated by an application. Data Labels Data labels provide additional information about the sections of a chart, such as values, names of data series or categories, percentages, or a combination of these. Data Series A data series is a group of figures about one item. For instance, if you are charting the sales figures for cogs and widgets for the last year, all of the cog figures make
  • 3. up the cog data series. Datasheet Datasheets contain related information or data to be analyzed. Doughnut Chart Doughnut charts show the proportions of parts to a whole and can show more than one series of data. Drag-and-drop Drag-and-drop is clicking the mouse button and holding it on a selected item, then dragging the item to a new location and releasing the mouse button. Drag-select Use drag-select to select text. With the I-beam mouse pointer, click before the text you want to select, and drag to the end of the text you want to select. The selected text appears highlighted (with a dark background) and is ready to be changed. Drawing Toolbar The Drawing toolbar is located on the left side of the PowerPoint window, and contains buttons that provide quick access to commonly used drawing tools and functions. Drawing Tools Drawing tools include AutoShapes, lines, and other options that make it easy to draw, color, or position presentation objects. Elapsed Time The elapsed time for the slides that have been rehearsed is displayed on the left side of the Rehearsal Timer. Exit Use the Exit command to close all active presentations as well as the application. Fill Effects Select Fill Effects in the Background fill section of the Background dialog box to choose from a variety of effects, including textures and patterns. Find The Find option allows you to locate every instance of a specified word or words. Floating Toolbar A floating toolbar is any toolbar that appears as a box in the working screen area. Any toolbar can be made into a floating toolbar by simply clicking-and-dragging the toolbar to the working screen area. Font Embedding Font embedding saves TrueType fonts in a presentation so text will be properly displayed on other computers. Font Size A font size is the size of a font measured in points. The more points there are in a font, the larger it will appear. There are 72 points to an inch. Footer A footer is any information located in the bottom margin of a document that is repeated on every page or every other page, such as page numbers or file names. Formatting Toolbar The Formatting toolbar is located beneath the Standard toolbar, and contains buttons that provide quick access to commonly used formatting tools and options for the application. Graphical Builds A graphical build is a series of objects that are placed on a slide one at a time to create an animated effect. Graphics Graphics are images such as clip art, word art, graphs, and charts. Handouts Handouts are smaller versions of your slides that are printed and can be distributed to the audience. Header A header is any information located in the top margin of a document that is repeated on every page or every other page, such as document titles or the date. Hidden Slides Hidden slides do not automatically appear in a presentation. You must prompt them by using a simple keystroke or menu option. Legend A legend is a box that contains entries and keys that help identify the data series in a chart.
  • 4. Legend Key The legend key is the symbol that appears next to the legend text that shows a sample of each data series indicator on the chart. Legend Text Legend text is the text that appears in a legend that identifies the data series on the chart. Line Chart Line charts show trends or changes in data over a period of time and at even intervals. Linking Slides Linking slides provides a way to make one presentation suit different audiences. Linking allows you to link a slide or presentation to the current presentation. You can then choose to run the presentation with or without the linked slide(s). Master Text The Master text (Object Area for AutoLayouts) is the placeholder that contains the formatting for the main text on the Slide Master. This placeholder contains the font, color, size, line spacing, and alignment settings of the main text as well as the text’s attributes, shape, and placement. Master Title The Master title (Title Area for AutoLayouts) is the placeholder that holds the formatting for the titles on a Slide Master. This placeholder contains the font, color, size, alignment, and line spacing settings of the slides titles as well as the text’s attributes, shape, and placement. Microsoft Clip Gallery The Microsoft Clip Gallery is a supplemental application that gives you access to clip art, pictures, sounds, and video clips. Most of the clip art, pictures, sounds, and video clips are located on a CD-ROM, and can be imported from the Clip Gallery dialog box. The Clip Gallery helps you organize and find the clip art and other elements easily. Microsoft Graph Microsoft Graph is a supplementary application that allows you to create charts in PowerPoint. Microsoft Org Chart Microsoft Organization Chart (also referred to as an Org Chart) is a supplementary application that allows you to create organization charts in PowerPoint. Monotype Sorts Monotype Sorts is a TrueType font that provides a variety of bullet styles. The Monotype Sorts font appears on most computers on which Windows has been installed. Mouse Pointer The mouse pointer is the arrow that shows up on the screen and is directed by the mouse. The mouse pointer often changes appearance depending on where it is positioned or what action you are taking. New Use the New command to create a new presentation. The New command allows you to create a presentation from scratch, or it offers a variety of designs and formats that can be used as a starting point. Notes Pages Notes Pages contain a reduced image of a slide as well as an area to include speakers notes. Office Assistant The Office Assistant appears on all PowerPoint screens until you close it and can be used to get help and tips on using PowerPoint. Online Presentation An online presentation is an electronic slide show that is run on or projected from a computer. Options Options on the Tools menu allows you to set your preferences for PowerPoint functions, such as the maximum number of undos, smart quotes, and viewing non- printing characters.
  • 5. Order Use the Order command to rearrange the order of objects on a slide. Organization Boxes Organization boxes are the boxes within an Organization chart that contain the name and job information for each position. Organization Chart An organization chart is a diagram or map that shows the hierarchy of a group or business. It usually shows a person’s name, and the position that person holds within the group or business. Outline View Outline view allows you to work with slide titles and main text without being distracted by background colors and graphics. You can see most of the text in your presentation at a glance instead of scrolling from slide to slide. You can also rearrange the order and organization of your slides and text, and make formatting changes. Outlining Toolbar The Outlining toolbar is available in Outline view by default, and is located on the left side of the window. The Outlining toolbar has buttons that provide quick access to outlining features such as indenting and text relocation. Pack And Go Pack And Go “wraps up” your presentations and all of its elements, along with the PowerPoint Viewer, into a Pack and Go executable file so you can load and view it on any machine. Pack And Go Wizard The Pack and Go Wizard is a series of dialog boxes that walks you through packaging a presentation so you can show it on other computers. Pen Tool Use the pen tool to mark on the slides during a presentation. Picture Pictures can be anything from scanned photographs to line art images to artwork from compact discs. Picture Toolbar Use the Picture toolbar to quickly make changes to the selected image. The Picture toolbar appears as a floating toolbar whenever you have an image selected. Pie Chart Pie charts show the proportions of parts to a whole. Placeholders Placeholders are predefined areas on Master slides and AutoLayouts that designate where specific objects or text should be placed. Placement Line The placement line appears in Outline view as you drag a slide icon to a new location. The line is used to make placement easier. PowerPoint Viewer The PowerPoint Viewer is a program that comes with PowerPoint, but it allows you to view presentations without having PowerPoint installed. Presentation A presentation is a collection of slides, handouts, speaker’s notes, and an outline, all combined into a file that can be printed onto transparencies or projected from a computer. Presentation Designs The Presentation Designs card in the New Presentation dialog box is a collection of templates that helps you determine the color scheme, fonts, and other design features of your presentation. Presentation Templates File A Presentation Templates file is any presentation background that is saved as a template. You can modify existing templates or create new templates from scratch, then save them as a Presentation Template. Preset Animations Use PowerPoint’s preset animation effects to quickly apply interesting animation effects to your slide show. Print Range The Print Range option in the Print dialog box allows you to specify what pages of
  • 6. a document you want to print. Print What The Print What option in the Print dialog box allows you to specify in what format you want the document to print. Radar Chart Radar charts show changes or frequencies of series of data relative to a center point and relative to each other. Regular Shapes Regular shapes refer to perfectly proportioned shapes, such as circles and squares, that can be inscribed within a square, or any shape with equal sides or equal distance from the center. Rehearsal Timer The Rehearsal Timer allows you to set timings for your slides so you can run the presentation on its own. Replace Use Replace on the Edit menu to search for and replace specified text. Resize Handles Resize handles are small, solid boxes that appear in the border of a selected object. The resize handles are used to change the size of the selected object. Rows Rows are the horizontal divisions of a datasheet that are identified by numbers. Ruler Guides The ruler guides are the lines on the ruler that move according to the pointer position. These lines help position the location of the pointer. Rulers Use rulers to help align and size objects on your slide. Select In order to work with an object, you must first select or activate it. One way to select an object by clicking it once with the mouse. Selection Box A selection box appears around a text box when it is selected on a PowerPoint slide. It includes the selection handles. It also appears around items as you click- and-drag the mouse pointer around a group of objects you want to select. Selection Handles Selection handles, which look like small squares, appear on objects when they are selected on a PowerPoint slide. They can be used to change the size of the object. Send Backward The Send Backward option on the Order submenu allows you to send objects back one level or layer of a slide at a time. Send To Back The Send to Back option on the Order submenu allows you to send objects all the way to the back level or layer of a slide. Shade Styles Shading an object in PowerPoint creates a gradient effect — a gradual shift from one color to another. All objects in PowerPoint can be filled with a shaded color. Shading Shading is a modification of a color that is made by adding complementary colors or small amounts of black. Shading Fill Shading Fill sets the overall style or direction of the shading. Shadow Use the Shadow effect to emphasize text. It produces a drop-shadow behind the text. Slide Color Scheme The Slide Color Scheme option on the Format menu lets you change colors in a color scheme, or select new colors for a single slide or an entire presentation. Slide Icon A slide icon is the graphical representation of a slide in Outline View that appears where each slide begins. The slide icon also displays small shapes if any graphics or other objects exist on the slide. Slide Master The Slide Master is the slide that holds the formatting for the title, the text, and any background items that appear on the slides. Any text styles or graphics that appear on the Slide Master will appear on all of the slides in a presentation.
  • 7. Slide Navigator The Slide Navigator allows you to go to any slide in your presentation while in Slide view. Slide Show Menu Icon Click the Slide Show Menu icon to open a menu with options to apply in Slide Show view. Slide Show View Slide Show View shows how a presentation will look when you run it. This allows you to do a test run and even create timed presentations. Slide Sorter Toolbar The Slide Sorter toolbar is available only in Slide Sorter view, and allows quick access to special PowerPoint effects such as transitions, builds, rehearse timing, and hide slides. Slide Sorter View Slide Sorter View displays a reduced image of all the slides in a grid-like fashion. This view makes it easier to rearrange the slides in a presentation and add transitions and special effects. Slide View Slide View allows you to work on one slide at a time. While in Slide View, you can add any element to a slide, including text, graphics, shapes, and graphs. Slides Slides are the individual pages of your presentation. Slides can be designed with different titles, graphics, text, and much more. Speaker’s Notes Speaker’s Notes are pages with a copy of a slide on top and space below it for taking notes. Standard Toolbar The Standard toolbar is located beneath the menu bar, and contains buttons that provide quick access to commonly used tools and options for the application. Status Bar The status bar is the area at the bottom of a window that provides messages that describe what you are seeing and doing in the presentation as you work. Subordinate A subordinate is someone in a lower rank or position. Supplementary Application A supplementary application is an application that can be opened and used within PowerPoint. Microsoft Graph, Microsoft Organization Chart, and Microsoft WordArt are examples of supplementary applications. Template A template is a slide or presentation that provides a predefined format and color scheme that can be applied to another presentation. PowerPoint provides more than 100 professionally designed templates, or you can use an existing presentation as a template. Thumbnail A thumbnail is a small view of the current slide. It appears in several different PowerPoint screens, including Outline view. Thumbnail Prints Thumbnail prints are small printed versions of slides. You can print 2, 3, or 6 thumbnails on a single page. Title Case Title case is when each major word in the text starts with a capital letter. Title Master The Title Master holds the master format for title slides in a presentation. Title Slide The Title slide is an AutoLayout that provides placeholders for a title and a subtitle for a presentation. Transition A transition is an effect that can be run between slides to signal a shift from one slide to the next. Transition Icon In Slide Sorter view, a transition icon appears under every slide that has a transition applied to it. Transitions A transition is an effect that can be run between slides to signal a shift from one
  • 8. slide to the next. TrueType Fonts TrueType fonts are scaled to fit your presentation so they always present a smooth, clear image. They are designed to be used on any printer and in any type size. Ungrouping Objects Ungrouping objects allows you to work with each part of a grouped object individually. Variant Variants are different shading orders of a selected style. WordArt WordArt is a supplementary application that can be used to manipulate text into shapes. For instance, you can make a phrase or sentence form a circle. XY (Scatter) Chart XY (scatter) charts show the relationship between the numeric values in several series of data.