Downloaded 159 times


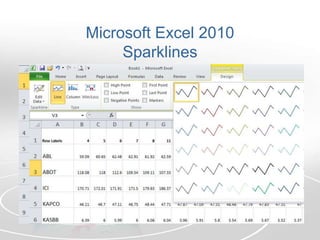

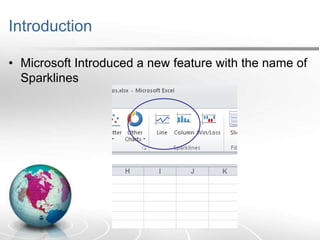
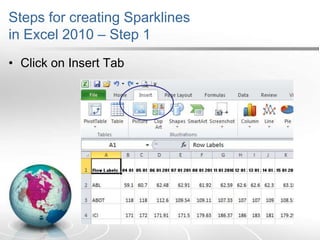
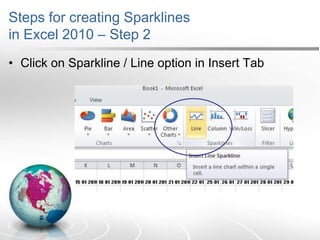
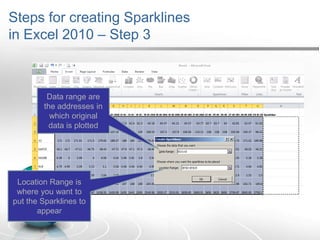
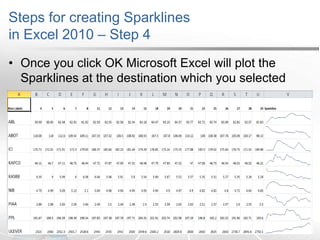


The document introduces the concept of sparklines in Microsoft Excel 2010, a feature that enables the visual representation of data trends in a compact format. It outlines the steps to create sparklines, including selecting data and inserting them using the appropriate options in Excel. The conclusion encourages further exploration of Excel functionalities on the provided website.