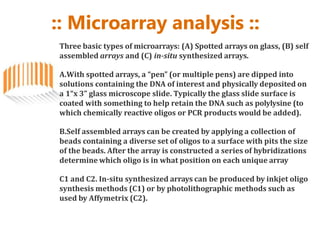
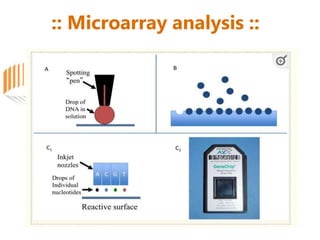
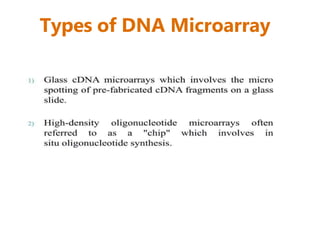
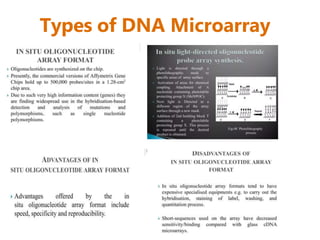
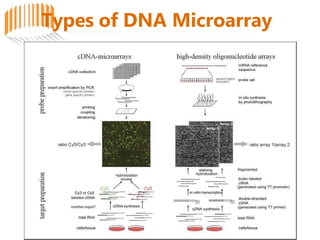
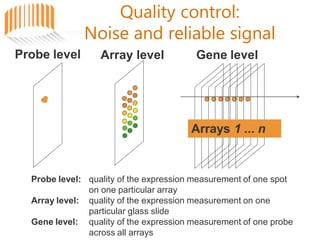
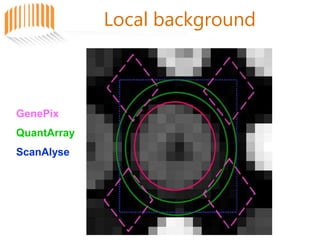
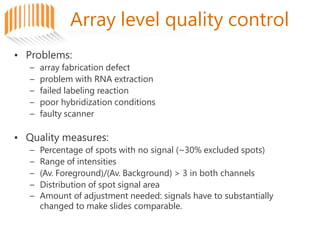
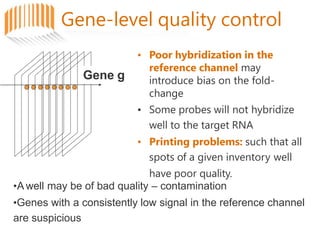
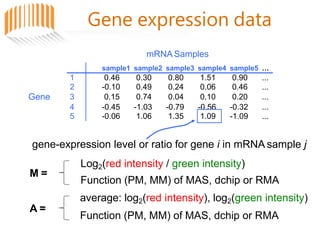
:: Microarray analysis ::
What is spotted DNA array?
The spotted array on glass: spotted arrays are arrays
made on poly-lysine coated glass microscope slides.
This provides binding of high-density DNA by using slotted
pins. It allows fluorescent labeling of the sample.
:: Microarray analysis ::
Three basic types of microarrays: (A) Spotted arrays on glass, (B) self
assembled arrays and (C) in-situ synthesized arrays.
A.With spotted arrays, a “pen” (or multiple pens) are dipped into
solutions containing the DNA of interest and physically deposited on
a 1“x 3” glass microscope slide. Typically the glass slide surface is
coated with something to help retain the DNA such as polylysine (to
which chemically reactive oligos or PCR products would be added).
B.Self assembled arrays can be created by applying a collection of
beads containing a diverse set of oligos to a surface with pits the size
of the beads. After the array is constructed a series of hybridizations
determine which oligo is in what position on each unique array
C1 and C2. In-situ synthesized arrays can be produced by inkjet oligo
synthesis methods (C1) or by photolithographic methods such as
used by Affymetrix (C2).
:: Microarray analysis ::
What is affymetrix microarray?
Affymetrix is a GeneChip microarray that is the
most widely used high-throughput technology
to measure gene expression, and a wide
variety of preprocessing methods have been
developed to transform probe intensities
reported by a microarray scanner into gene
expression estimates.
:: Microarray analysis ::
What is DNA and RNA microarray?
Microarray technology is a general laboratory approach
that involves binding an array of thousands to
millions of known nucleic acid fragments to a solid
surface, referred to as a “chip.” The chip is then bathed
with DNA or RNA isolated from a study sample (such as cells
or tissue).
DNA Microarray Technology ::
Principle of DNA Microarray
Technology ::
Principle of DNA Microarray
Technology ::
Principle of DNA Microarray
Technology ::
Types of DNA Microarray
Quality control:
Noise and reliable signal
Arrays 1 ... n
Array level Gene level
Probe level
Probe level: quality of the expression measurement of one spot
on one particular array
quality of the expression measurement on one
particular glass slide
quality of the expression measurement of one probe
across all arrays
Array level:
Gene level:
Probe-level quality control
• Individual spots printed on the slide
• Sources:
– faulty printing, uneven distribution, contamination with debris,
magnitude of signal relative to noise, poorly measured spots;
• Visual inspection:
– hairs, dust, scratches, air bubbles, dark regions, regions with haze
• Spot quality:
– Brightness: foreground/background ratio
– Uniformity: variation in pixel intensities and ratios of intensities within
a spot
– Morphology: area, perimeter, circularity.
– Spot Size: number of foreground pixels
• Action:
– set measurements to NA (missing values)
– local normalization procedures which account for regional
idiosyncrasies.
– use weights for measurements to indicate reliability in later analysis.
Spot identification
Individual spots are recognized, size and shape might be
adjusted per spot (automatically fine adjustments by
hand).
Additional manual flagging of bad (X) or non-present (NA)
spots
NA
X
poor spot quality good spot quality
Different Spot identification methods: Fixed circles, circles with
variable size, arbitrary spot shape (morphological opening)
Spot identification
• The signal of the spots is quantified.
Histogram of pixel
intensities of a single spot
„Donuts“
Mean / Median / Mode / 75% quantile
Local background
GenePix
QuantArray
ScanAlyse
Array level quality control
• Problems:
– array fabrication defect
– problem with RNA extraction
– failed labeling reaction
– poor hybridization conditions
– faulty scanner
• Quality measures:
– Percentage of spots with no signal (~30% excluded spots)
– Range of intensities
– (Av. Foreground)/(Av. Background) > 3 in both channels
– Distribution of spot signal area
– Amount of adjustment needed: signals have to substantially
changed to make slides comparable.
Gene-level quality control
Gene g
• Poor hybridization in the
reference channel may
introduce bias on the fold-
change
• Some probes will not hybridize
well to the target RNA
• Printing problems: such that all
spots of a given inventory well
have poor quality.
•A well may be of bad quality – contamination
•Genes with a consistently low signal in the reference channel
are suspicious
mRNA Samples
gene-expression level or ratio for gene i in mRNA sample j
sample1 sample2 sample3 sample4 sample5 …
1 0.46 0.30 0.80 1.51 0.90 ...
2 -0.10 0.49 0.24 0.06 0.46 ...
Gene 3 0.15 0.74 0.04 0.10 0.20 ...
4 -0.45 -1.03 -0.79 -0.56 -0.32 ...
5 -0.06 1.06 1.35 1.09 -1.09 ...
M =
Log2(red intensity / green intensity)
Function (PM, MM) of MAS, dchip or RMA
average: log2(red intensity), log2(green intensity)
Function (PM, MM) of MAS, dchip or RMA
A =
Gene expression data
Data Data (log scale)
Scatterplot
Message: look at your data on log-scale!
MA Plot
A = 1/2 log2(RG)
Median centering
Log
Signal,
centered
at
0
One of the simplest strategies is to bring all „centers“ of the array data to
the same level.
Assumption: the majority of genes are un-changed between
conditions.
Median is more robust to outliers than the mean.
Divide all
expression
measurements
of each array by
the Median.
Problem of median-centering
Log Green
Log
Red
after Median-centering
A = (Log Green + Log Red) / 2
M
=
Log
Red
-
Log
Green
M-A Plot of the same data
Median-Centering is a global Method. It does not adjust for local
effects, intensity dependent effects, print-tip effects, etc.
Scatterplot of log-Signals

Microarray-Technology.pptx

  • 1.
  • 2.
  • 3.
    :: Microarray analysis:: What is spotted DNA array? The spotted array on glass: spotted arrays are arrays made on poly-lysine coated glass microscope slides. This provides binding of high-density DNA by using slotted pins. It allows fluorescent labeling of the sample.
  • 4.
  • 5.
  • 6.
    :: Microarray analysis:: Three basic types of microarrays: (A) Spotted arrays on glass, (B) self assembled arrays and (C) in-situ synthesized arrays. A.With spotted arrays, a “pen” (or multiple pens) are dipped into solutions containing the DNA of interest and physically deposited on a 1“x 3” glass microscope slide. Typically the glass slide surface is coated with something to help retain the DNA such as polylysine (to which chemically reactive oligos or PCR products would be added). B.Self assembled arrays can be created by applying a collection of beads containing a diverse set of oligos to a surface with pits the size of the beads. After the array is constructed a series of hybridizations determine which oligo is in what position on each unique array C1 and C2. In-situ synthesized arrays can be produced by inkjet oligo synthesis methods (C1) or by photolithographic methods such as used by Affymetrix (C2).
  • 7.
  • 8.
    :: Microarray analysis:: What is affymetrix microarray? Affymetrix is a GeneChip microarray that is the most widely used high-throughput technology to measure gene expression, and a wide variety of preprocessing methods have been developed to transform probe intensities reported by a microarray scanner into gene expression estimates.
  • 9.
    :: Microarray analysis:: What is DNA and RNA microarray? Microarray technology is a general laboratory approach that involves binding an array of thousands to millions of known nucleic acid fragments to a solid surface, referred to as a “chip.” The chip is then bathed with DNA or RNA isolated from a study sample (such as cells or tissue).
  • 10.
  • 11.
    Principle of DNAMicroarray Technology ::
  • 12.
    Principle of DNAMicroarray Technology ::
  • 13.
    Principle of DNAMicroarray Technology ::
  • 14.
    Types of DNAMicroarray
  • 15.
    Types of DNAMicroarray
  • 16.
    Types of DNAMicroarray
  • 17.
    Types of DNAMicroarray
  • 20.
    Quality control: Noise andreliable signal Arrays 1 ... n Array level Gene level Probe level Probe level: quality of the expression measurement of one spot on one particular array quality of the expression measurement on one particular glass slide quality of the expression measurement of one probe across all arrays Array level: Gene level:
  • 21.
    Probe-level quality control •Individual spots printed on the slide • Sources: – faulty printing, uneven distribution, contamination with debris, magnitude of signal relative to noise, poorly measured spots; • Visual inspection: – hairs, dust, scratches, air bubbles, dark regions, regions with haze • Spot quality: – Brightness: foreground/background ratio – Uniformity: variation in pixel intensities and ratios of intensities within a spot – Morphology: area, perimeter, circularity. – Spot Size: number of foreground pixels • Action: – set measurements to NA (missing values) – local normalization procedures which account for regional idiosyncrasies. – use weights for measurements to indicate reliability in later analysis.
  • 22.
    Spot identification Individual spotsare recognized, size and shape might be adjusted per spot (automatically fine adjustments by hand). Additional manual flagging of bad (X) or non-present (NA) spots NA X poor spot quality good spot quality Different Spot identification methods: Fixed circles, circles with variable size, arbitrary spot shape (morphological opening)
  • 23.
    Spot identification • Thesignal of the spots is quantified. Histogram of pixel intensities of a single spot „Donuts“ Mean / Median / Mode / 75% quantile
  • 24.
  • 25.
    Array level qualitycontrol • Problems: – array fabrication defect – problem with RNA extraction – failed labeling reaction – poor hybridization conditions – faulty scanner • Quality measures: – Percentage of spots with no signal (~30% excluded spots) – Range of intensities – (Av. Foreground)/(Av. Background) > 3 in both channels – Distribution of spot signal area – Amount of adjustment needed: signals have to substantially changed to make slides comparable.
  • 26.
    Gene-level quality control Geneg • Poor hybridization in the reference channel may introduce bias on the fold- change • Some probes will not hybridize well to the target RNA • Printing problems: such that all spots of a given inventory well have poor quality. •A well may be of bad quality – contamination •Genes with a consistently low signal in the reference channel are suspicious
  • 27.
    mRNA Samples gene-expression levelor ratio for gene i in mRNA sample j sample1 sample2 sample3 sample4 sample5 … 1 0.46 0.30 0.80 1.51 0.90 ... 2 -0.10 0.49 0.24 0.06 0.46 ... Gene 3 0.15 0.74 0.04 0.10 0.20 ... 4 -0.45 -1.03 -0.79 -0.56 -0.32 ... 5 -0.06 1.06 1.35 1.09 -1.09 ... M = Log2(red intensity / green intensity) Function (PM, MM) of MAS, dchip or RMA average: log2(red intensity), log2(green intensity) Function (PM, MM) of MAS, dchip or RMA A = Gene expression data
  • 28.
    Data Data (logscale) Scatterplot Message: look at your data on log-scale!
  • 29.
    MA Plot A =1/2 log2(RG)
  • 30.
    Median centering Log Signal, centered at 0 One ofthe simplest strategies is to bring all „centers“ of the array data to the same level. Assumption: the majority of genes are un-changed between conditions. Median is more robust to outliers than the mean. Divide all expression measurements of each array by the Median.
  • 31.
    Problem of median-centering LogGreen Log Red after Median-centering A = (Log Green + Log Red) / 2 M = Log Red - Log Green M-A Plot of the same data Median-Centering is a global Method. It does not adjust for local effects, intensity dependent effects, print-tip effects, etc. Scatterplot of log-Signals