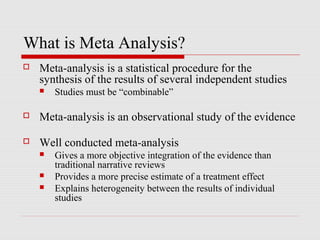
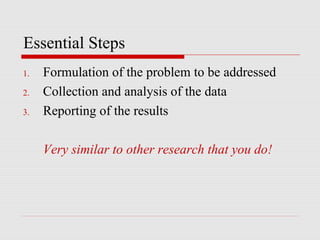
This document provides an overview of meta-analysis, including:
1) Meta-analysis is a statistical method for combining results from multiple studies to obtain a single estimate of effect. It provides a more precise estimate than individual studies.
2) Proper meta-analyses require a detailed protocol and eligibility criteria. Studies must be carefully selected and data extracted by multiple independent reviewers.
3) Results are typically reported as odds ratios, risk ratios, or mean differences along with confidence intervals. Forest plots visually display results and heterogeneity between studies.
A meta-analysis is the use of statistical methods to summaries the results of the studies. Meta-analyses are conducted to assess the strength of evidence present on a disease and treatment. The results of a meta-analysis can improve precision of estimates of effect, answer questions not posed by the individual studies, settle controversies arising from apparently conflicting studies, and generate new hypotheses. In particular, the examination of heterogeneity is vital to the development of new hypotheses.
Randomization is the process by which allocation of subjects to treatment groups is done by chance, without the ability to predict who is in what group. It is done in clinical trials. This presentation describes the methods of randmization used in clinical trials.
Introduction to meta-analysis (1612_MA_workshop)Ahmed Negida
Chapter 1: Introduction to Meta-analysis
- From the 1612 MA Workshop that will be held on 11th, December, 2016 at Dokki, Giza, Egypt
- Workshop instructor: Mr. Ahmed Negida, MBBCh candidate
Summary slides for "Systematic Review and Meta-Analysis Course for Healthcare Professionals", January 8-9, 2013, King Abdullah Medical City, Makkah, Saudi Arabia
http://KAMCResearch.org
Evaluates a meta analysis of family therapy interventions for families facing physical illness.
The slide presentation and article is discussed in greater detail at http://jcoynester.wordpress.com/2013/08/12/interventions-for-the-family-in-chronic-illness-a-meta-analysis-i-like/
Basics of Systematic Review and Meta-analysis: Part 3Rizwan S A
A 4 part lecture series on the basics of Systematic Review and Meta-analysis, Part 3 discusses the software needed and analytical techniques used for this purpose.
Webinar: Survival Analysis for Marketing Attribution - July 17, 2013Revolution Analytics
A central question in advertising is how to measure the effectiveness of different ad campaigns. In online advertising, including social media, it is possible to create thousands of different variations on an ad, and serve millions of impressions to targeted audiences each day. Rather too often, digital advertisers use the last click attribution model to evaluate the success of campaigns. In other words, when a user clicks on an ad impression, only the very last event is deemed as significant. This is convenient but doesn't help in making good marketing decisions.
Survival analysis is widely used in the modeling of living organisms and time to failure of components, but Chandler-Pepelnjak (2010) proposed to use survival analysis for marketing attribution analysis. Listen to our webinar to learn more about this theory and a big data case study, showing how DataSong used Revolution Analytics.
Biostatistics in clinical research involves the application of statistical methods to analyze and interpret data from clinical trials. It plays a crucial role in study design, sample size determination, data analysis, and result interpretation. Biostatisticians ensure that clinical research findings are valid, reliable, and meaningful, contributing to evidence-based medicine. Their expertise helps researchers make informed decisions, assess treatment efficacy, and draw accurate conclusions about the safety and effectiveness of interventions.
Study of the distribution and determinants of
health-related states or events in specified populations and the application of this study to control health problems.
John M. Last, Dictionary of Epidemiology
How Randomized Controlled Trials are Used in Meta-Analysis Pubrica
Randomized Controlled Trials (RCTs) are a commonly used research design in medical and scientific studies to assess the effectiveness of interventions or treatments. Meta-analysis, on the other hand, is a statistical technique used to combine and analyze the results of multiple studies on a particular topic to draw more robust conclusions.
Continue reading @ https://pubrica.com/academy/meta-analysis/how-randomized-controlled-trials-are-used-in-meta-analysis/
For all your research assistance visit us @ https://pubrica.com/services/research-services/
Biostatistics are widely used in clinical trials to collect and organize and describe and interpret these result and then give to us proves to take appropriate clinical decisions
Root cause Analysis (RCA) & Corrective and Preventive action (CAPA) in MRCT d...Bhaswat Chakraborty
This presentation describes Identification & differentiation of Protocol deviation & violation; Different methods of RCA & best suitable method for Multiregional Clinical Trial; CAPA management and CAPA application to other trial sites/CRO/SMO/ Country that is involved in same trial (Strategic Management and application of CAPA in MRCT)
This presentation gives effective solutions to outliers issue in bioequivalence trials. It described what would be acceptable to Regulatory agencies as well as some new approaches.
Equivalence approches for complex generics DIA 11 april 2019 Bhaswat Chakraborty
This is a workshop that i gave a few days ago on bioequivalence of complex generics like peptides, polymers, liposomes, colloids, ophthamic and topical produtcts.
Clinical trials that are needed for efficacy & safety evidence of Medical devices include feasibility (pilot) and Pivotal trials. An extended battery of preclinical trials are also needed for high risk devices.
Writing Science papers for for publication requires something more thatn creativity. Target journals, content organization, wrting style, elegance and referencing are equally important.
Multidisc review of NDAs and BLAs nipicon 2018 Dr. ChakrabortyBhaswat Chakraborty
NDAS and BLAs cannot be authoritatively reviewed these days until experts from different disciplines act together like a team. This presentation give some foundational points and an illustrative example in that regard.
Teaching by stories, anecdotes and historical facts sept 25 2018Bhaswat Chakraborty
Many difficult principles in science and humanities can be taught best by a story (of its discovery), by an anecdote or some historical facts about them.
Orientation and Adaptation for Post-Graduate Pharmacy ProgramsBhaswat Chakraborty
PG Pharmacy programs are more focused and professionally oriented than the undergraduate counterpart. Many soft skills are required along with the curricular competence for excellence at the PG level.
Scientific integrity calls for some basic originality. Plagiarism can destroy this original creativity and ideation. This presentation defines plagiarism (stealing from others' works) and some of the creative and systematic remedies.
Best Practices to Risk Based Data Integrity at Data Integrity Conference, Lon...Bhaswat Chakraborty
Data integrity can be implemented using several approaches. One of the most effective ways to implement DI is a risk based approach. The speaker elaborates this.
There are several dimensions in Pharmaceutical ethics -- Practice-, research- and community oriented. This presentation mainly deals with Clinical research oriented Ethics.
Young pharmaceutical scientists are and can get involved in all aspects of new drug discovery and development. They have to be appropriately qualified, trained and experienced though,
This presentation mainly deals with clinical development of biosimilar products. It also gives enough on non-clinical development so that the audience is well oriented.
High variability in PK can be a characteristic of certain drug products which require different from ordinary strategies and study designs for establishing bioequivalence.
Couples presenting to the infertility clinic- Do they really have infertility...Sujoy Dasgupta
Dr Sujoy Dasgupta presented the study on "Couples presenting to the infertility clinic- Do they really have infertility? – The unexplored stories of non-consummation" in the 13th Congress of the Asia Pacific Initiative on Reproduction (ASPIRE 2024) at Manila on 24 May, 2024.
Pulmonary Thromboembolism - etilogy, types, medical- Surgical and nursing man...VarunMahajani
Disruption of blood supply to lung alveoli due to blockage of one or more pulmonary blood vessels is called as Pulmonary thromboembolism. In this presentation we will discuss its causes, types and its management in depth.
Ozempic: Preoperative Management of Patients on GLP-1 Receptor Agonists Saeid Safari
Preoperative Management of Patients on GLP-1 Receptor Agonists like Ozempic and Semiglutide
ASA GUIDELINE
NYSORA Guideline
2 Case Reports of Gastric Ultrasound
Prix Galien International 2024 Forum ProgramLevi Shapiro
June 20, 2024, Prix Galien International and Jerusalem Ethics Forum in ROME. Detailed agenda including panels:
- ADVANCES IN CARDIOLOGY: A NEW PARADIGM IS COMING
- WOMEN’S HEALTH: FERTILITY PRESERVATION
- WHAT’S NEW IN THE TREATMENT OF INFECTIOUS,
ONCOLOGICAL AND INFLAMMATORY SKIN DISEASES?
- ARTIFICIAL INTELLIGENCE AND ETHICS
- GENE THERAPY
- BEYOND BORDERS: GLOBAL INITIATIVES FOR DEMOCRATIZING LIFE SCIENCE TECHNOLOGIES AND PROMOTING ACCESS TO HEALTHCARE
- ETHICAL CHALLENGES IN LIFE SCIENCES
- Prix Galien International Awards Ceremony
HOT NEW PRODUCT! BIG SALES FAST SHIPPING NOW FROM CHINA!! EU KU DB BK substit...GL Anaacs
Contact us if you are interested:
Email / Skype : kefaya1771@gmail.com
Threema: PXHY5PDH
New BATCH Ku !!! MUCH IN DEMAND FAST SALE EVERY BATCH HAPPY GOOD EFFECT BIG BATCH !
Contact me on Threema or skype to start big business!!
Hot-sale products:
NEW HOT EUTYLONE WHITE CRYSTAL!!
5cl-adba precursor (semi finished )
5cl-adba raw materials
ADBB precursor (semi finished )
ADBB raw materials
APVP powder
5fadb/4f-adb
Jwh018 / Jwh210
Eutylone crystal
Protonitazene (hydrochloride) CAS: 119276-01-6
Flubrotizolam CAS: 57801-95-3
Metonitazene CAS: 14680-51-4
Payment terms: Western Union,MoneyGram,Bitcoin or USDT.
Deliver Time: Usually 7-15days
Shipping method: FedEx, TNT, DHL,UPS etc.Our deliveries are 100% safe, fast, reliable and discreet.
Samples will be sent for your evaluation!If you are interested in, please contact me, let's talk details.
We specializes in exporting high quality Research chemical, medical intermediate, Pharmaceutical chemicals and so on. Products are exported to USA, Canada, France, Korea, Japan,Russia, Southeast Asia and other countries.
Knee anatomy and clinical tests 2024.pdfvimalpl1234
This includes all relevant anatomy and clinical tests compiled from standard textbooks, Campbell,netter etc..It is comprehensive and best suited for orthopaedicians and orthopaedic residents.
NVBDCP.pptx Nation vector borne disease control programSapna Thakur
NVBDCP was launched in 2003-2004 . Vector-Borne Disease: Disease that results from an infection transmitted to humans and other animals by blood-feeding arthropods, such as mosquitoes, ticks, and fleas. Examples of vector-borne diseases include Dengue fever, West Nile Virus, Lyme disease, and malaria.
The prostate is an exocrine gland of the male mammalian reproductive system
It is a walnut-sized gland that forms part of the male reproductive system and is located in front of the rectum and just below the urinary bladder
Function is to store and secrete a clear, slightly alkaline fluid that constitutes 10-30% of the volume of the seminal fluid that along with the spermatozoa, constitutes semen
A healthy human prostate measures (4cm-vertical, by 3cm-horizontal, 2cm ant-post ).
It surrounds the urethra just below the urinary bladder. It has anterior, median, posterior and two lateral lobes
It’s work is regulated by androgens which are responsible for male sex characteristics
Generalised disease of the prostate due to hormonal derangement which leads to non malignant enlargement of the gland (increase in the number of epithelial cells and stromal tissue)to cause compression of the urethra leading to symptoms (LUTS
Recomendações da OMS sobre cuidados maternos e neonatais para uma experiência pós-natal positiva.
Em consonância com os ODS – Objetivos do Desenvolvimento Sustentável e a Estratégia Global para a Saúde das Mulheres, Crianças e Adolescentes, e aplicando uma abordagem baseada nos direitos humanos, os esforços de cuidados pós-natais devem expandir-se para além da cobertura e da simples sobrevivência, de modo a incluir cuidados de qualidade.
Estas diretrizes visam melhorar a qualidade dos cuidados pós-natais essenciais e de rotina prestados às mulheres e aos recém-nascidos, com o objetivo final de melhorar a saúde e o bem-estar materno e neonatal.
Uma “experiência pós-natal positiva” é um resultado importante para todas as mulheres que dão à luz e para os seus recém-nascidos, estabelecendo as bases para a melhoria da saúde e do bem-estar a curto e longo prazo. Uma experiência pós-natal positiva é definida como aquela em que as mulheres, pessoas que gestam, os recém-nascidos, os casais, os pais, os cuidadores e as famílias recebem informação consistente, garantia e apoio de profissionais de saúde motivados; e onde um sistema de saúde flexível e com recursos reconheça as necessidades das mulheres e dos bebês e respeite o seu contexto cultural.
Estas diretrizes consolidadas apresentam algumas recomendações novas e já bem fundamentadas sobre cuidados pós-natais de rotina para mulheres e neonatos que recebem cuidados no pós-parto em unidades de saúde ou na comunidade, independentemente dos recursos disponíveis.
É fornecido um conjunto abrangente de recomendações para cuidados durante o período puerperal, com ênfase nos cuidados essenciais que todas as mulheres e recém-nascidos devem receber, e com a devida atenção à qualidade dos cuidados; isto é, a entrega e a experiência do cuidado recebido. Estas diretrizes atualizam e ampliam as recomendações da OMS de 2014 sobre cuidados pós-natais da mãe e do recém-nascido e complementam as atuais diretrizes da OMS sobre a gestão de complicações pós-natais.
O estabelecimento da amamentação e o manejo das principais intercorrências é contemplada.
Recomendamos muito.
Vamos discutir essas recomendações no nosso curso de pós-graduação em Aleitamento no Instituto Ciclos.
Esta publicação só está disponível em inglês até o momento.
Prof. Marcus Renato de Carvalho
www.agostodourado.com
New Directions in Targeted Therapeutic Approaches for Older Adults With Mantl...i3 Health
i3 Health is pleased to make the speaker slides from this activity available for use as a non-accredited self-study or teaching resource.
This slide deck presented by Dr. Kami Maddocks, Professor-Clinical in the Division of Hematology and
Associate Division Director for Ambulatory Operations
The Ohio State University Comprehensive Cancer Center, will provide insight into new directions in targeted therapeutic approaches for older adults with mantle cell lymphoma.
STATEMENT OF NEED
Mantle cell lymphoma (MCL) is a rare, aggressive B-cell non-Hodgkin lymphoma (NHL) accounting for 5% to 7% of all lymphomas. Its prognosis ranges from indolent disease that does not require treatment for years to very aggressive disease, which is associated with poor survival (Silkenstedt et al, 2021). Typically, MCL is diagnosed at advanced stage and in older patients who cannot tolerate intensive therapy (NCCN, 2022). Although recent advances have slightly increased remission rates, recurrence and relapse remain very common, leading to a median overall survival between 3 and 6 years (LLS, 2021). Though there are several effective options, progress is still needed towards establishing an accepted frontline approach for MCL (Castellino et al, 2022). Treatment selection and management of MCL are complicated by the heterogeneity of prognosis, advanced age and comorbidities of patients, and lack of an established standard approach for treatment, making it vital that clinicians be familiar with the latest research and advances in this area. In this activity chaired by Michael Wang, MD, Professor in the Department of Lymphoma & Myeloma at MD Anderson Cancer Center, expert faculty will discuss prognostic factors informing treatment, the promising results of recent trials in new therapeutic approaches, and the implications of treatment resistance in therapeutic selection for MCL.
Target Audience
Hematology/oncology fellows, attending faculty, and other health care professionals involved in the treatment of patients with mantle cell lymphoma (MCL).
Learning Objectives
1.) Identify clinical and biological prognostic factors that can guide treatment decision making for older adults with MCL
2.) Evaluate emerging data on targeted therapeutic approaches for treatment-naive and relapsed/refractory MCL and their applicability to older adults
3.) Assess mechanisms of resistance to targeted therapies for MCL and their implications for treatment selection
micro teaching on communication m.sc nursing.pdfAnurag Sharma
Microteaching is a unique model of practice teaching. It is a viable instrument for the. desired change in the teaching behavior or the behavior potential which, in specified types of real. classroom situations, tends to facilitate the achievement of specified types of objectives.
2. What is Meta Analysis?
Meta-analysis is a statistical procedure for the
synthesis of the results of several independent studies
Studies must be “combinable”
Meta-analysis is an observational study of the evidence
Well conducted meta-analysis
Gives a more objective integration of the evidence than
traditional narrative reviews
Provides a more precise estimate of a treatment effect
Explains heterogeneity between the results of individual
studies
3. Badly Conducted Meta Analysis
Ill conducted meta-analysis
May be biased owing to exclusion of relevant
studies or inclusion of inadequate studies
Other than selection bias, there may be wrong
estimates or calculation flaws
Can always be avoided if the basic principles are
adhered to
4. Essential Steps
1. Formulation of the problem to be addressed
2. Collection and analysis of the data
3. Reporting of the results
Very similar to other research that you do!
5. The Protocol of a Meta-analysis
The objectives
The hypotheses to be tested
The subgroups of interest
The proposed methods and criteria for
identifying and selecting relevant studies
Extracting and analyzing information
6. Eligibility (I/E) Criteria
Very similar to criteria for including and excluding patients in clinical
studies
Eligibility criteria for inclusion and exclusion of studies or data have to be
defined
These criteria relate to the quality of trials and to the combinability of
treatments, patients, outcomes, and lengths of follow up
Quality and design features of a study can influence the results
Ideally, include only controlled trials with proper randomization of patients that
report on all initially included patients according to the intention to treat
principle
and with an objective, preferably blinded, outcome assessment
Assessing the quality of a study can be a subjective process, however,
especially since the information reported is often inadequate for this
purpose
It is therefore preferable to define only basic inclusion criteria and to
perform a thorough sensitivity analysis
7. The Strategy for Identifying the Relevant
Studies
Deecide whether to include unpublished studies, as their results may
differ from published trials
a meta-analysis of restricted published evidence may produce
distorted results owing to such publication bias
For published studies, electronic databases are useful, but, alone
they may miss a substantial proportion of relevant studies
The Cochrane Collaboration has an extensive manual search of
medical journals published in English and many other languages
The Cochrane Controlled Trials Register is probably the best single
electronic source of trials
However, citation indices and the bibliographies of review articles,
monographs, and the located studies should also be scrutinized
8. Data Collection
A standard record form is needed for data collection
It is useful if two independent observers extract the data, to
avoid errors
At this stage the quality of the studies may be rated, with
one of several specially designed scales
Blinding observers to the names of the authors and their
institutions, the names of the journals, sources of funding,
and acknowledgments leads to more consistent scores
Entails either photocopying papers, removing the title page, and
concealing journal identifications and other characteristics with a
black marker, or scanning the text of papers into a computer and
preparing standardized formats
9. Summary of the Principles
Meta-analysis should be as carefully planned with a
detailed written protocol in advance
A priori eligibility criteria for inclusion & a thorough
search for such studies make high quality meta-analysis
The graphical display of results from individual studies
on a common scale is an important intermediate step
allowing examination of degree of heterogeneity between studies
Different statistical methods exist for combining the data,
but there is no single "correct" method
A thorough sensitivity analysis is essential to assess the
robustness of combined estimates to different
assumptions and inclusion criteria
10. Standard Outcome Measures
Individual results are expressed in a standard format to allow comparison
between studies
If the end point is continuous—for example, blood pressure—the mean
difference between the treatment and control groups is used
The size of a difference, however, is influenced by the underlying
population value
E.g., An antihypertensive drug is likely to have a greater absolute effect on
blood pressure in overtly hypertensive patients than in borderline hypertensive
patients
Differences are therefore often presented in units of SD
If the end point is binary—for example, disease versus no disease, or dead
versus alive) then odds ratios or relative risks are calculated
The odds ratio has convenient mathematical properties, allow combining data
and testing the overall effect for significance
Absolute measures, e.g., absolute risk reduction or the number of patients to
be treated to prevent one event, are more helpful when applying results in
clinical practice
11. Odds and odds ratio
The odds is the number of patients
who fulfil the criteria for a given
endpoint divided by the number of
patients who do not.
E.g., the odds of diarrhoea during
treatment with an antibiotic in a group
of 10 patients may be 4 to 6 (4 with
diarrhoea divided by 6 without, 0.66); in
a control group the odds may be 1 to 9
(0.11) (a bookmaker would refer to this
as 9 to 1).
The odds ratio of treatment to control
group would be 6 (0.66÷0.11).
Risk and relative risk
The risk is the number of patients who fulfil the criteria for a given end point divided by
the total number of patients. In the example above the risks would be 4 in 10 in the
treatment group and 1 in 10 in the control group, giving a risk ratio, or relative risk, of 4
(0.4÷0.1).
12. Statistical Methods for Calculating Overall
Effect: FE
The last step consists in calculating the overall effect by combining
the data
A simple arithmetic average of the results from all the trials would
give misleading results
The results from small studies are more subject to the play of
chance and should therefore be given less weight
Methods used for meta-analysis use a weighted average of the
results, in which the larger trials have more influence than the
smaller ones
The statistical techniques to do this can be broadly classified into
two models, the difference consisting in the way the variability of
the results between the studies is treated
The "fixed effects" model considers, often unreasonably, that this
variability is exclusively due to random variation. Therefore, if all
the studies were infinitely large they would give identical results.
13. Statistical Methods for Calculating Overall
Effect: RE
The "random effects" model assumes a different underlying effect
for each study and takes this into consideration as an additional
source of variation
Which leads to somewhat wider confidence intervals than the fixed
effects model
Effects are assumed to be randomly distributed, and the central
point of this distribution is the focus of the combined effect
estimate
Although neither of two models can be said to be "correct," a
substantial difference in the combined effect calculated by the fixed
and random effects models will be seen only if studies are markedly
heterogeneous
14. Bayesian Meta-analysis
Some statisticians feel that other statistical approaches are more
appropriate than either of the above
One approach uses Bayesian statistics
express the size of an effect by specifying some prior probability
distribution before seeing the data
and then they update that belief by deriving a posterior probability
distribution, taking the data into account
Bayesian models are available under both the fixed and random
effects assumption
The confidence interval (or the 95% credible interval, which covers
95% of the posterior probability distribution) will often be wider
than conventional 95% CI
because another component of variability, the prior distribution, is
introduced
Bayesian approaches are controversial because the definition of
prior probability will often be based on subjective assessments and
opinion.
15. Heterogeneity between Study Results
If the results of the studies differ greatly then it may not
be appropriate to combine the results
One approach is to examine statistically the degree of
similarity in the studies' outcomes
in other words, to test for heterogeneity across studies
in such procedures, whether the results of a study reflect a single
underlying effect, rather than a distribution of effects, is assessed
if this test shows homogeneous results then the differences between
studies are assumed to be a consequence of sampling variation, and
a fixed effects model is appropriate
if, however, the test shows that significant heterogeneity exists
between study results then a random effects model is advocated
16. Heterogeneity between Study Results contd.
A major limitation with this approach is that the statistical tests
lack power—they often fail to reject the null hypothesis of
homogeneous results even if substantial differences between
studies exist
Although there is no statistical solution to this issue,
heterogeneity between study results should not be seen as purely
a problem for meta-analysis
it also provides an opportunity for examining why treatment effects
differ in different circumstances
Heterogeneity should not simply be ignored after a statistical test
is applied
It should be scrutinized, with an attempt to explain it
17. Graphic Presentation of Data
Results from each trial are usefully graphically displayed, together
with their confidence intervals.
The next figure represents a meta-analysis of 17 trials of ß blockers
in secondary prevention after myocardial infarction
Each study is represented by a black square and a horizontal line,
which correspond to the point estimate and the 95% confidence
intervals of the odds ratio
The 95% confidence intervals would contain the true underlying effect
in 95% of the occasions if the study was repeated again and again
The solid vertical line corresponds to no effect of treatment (odds ratio
1.0)
If the confidence interval includes 1, then the difference in the effect of
experimental and control treatment is not significant at conventional
levels (P>0.05)
The area of the black squares reflects the weight of the study in the
meta-analysis
The confidence interval of all but two studies cross this line, indicating
that the effect estimates were non-significant (P>0.05)
18. Graphic Presentation of Data contd.
The diamond represents the combined odds ratio, calculated using
a fixed effects model, with its 95% confidence interval
The combined odds ratio shows that oral ß blockade starting a few
days to a few weeks after the acute phase reduces subsequent
mortality by an estimated 22% (odds ratio 0.78; 95% confidence
interval 0.71 to 0.87)
A dashed line is plotted vertically through the combined odds
ratio. This line crosses the horizontal lines of all individual studies
except one (N)
This indicates a fairly homogenous set of studies
Indeed, the test for heterogeneity gives a non-significant P value of
0.2
19. Total mortality from trials of {beta}
blockers in secondary prevention after
myocardial infarction. The black square
and horizontal line correspond to odds
ratio and 95% confidence interval for each
trial. The size of the black square reflects
the weight of each trial. The diamond
represents the combined odds ratio and
95% confidence interval, showing 22% a
reduction in the odds of death (references
are available from the authors)
Egger, M. et al. BMJ 1997;315:1533-1537
20. Graphic Presentation of Data contd.
A logarithmic scale was used for plotting the odds ratios in the
above figure
There are several reasons that ratio measures are best plotted on
logarithmic scales
Most importantly, the value of an odds ratio and its reciprocal—
for example, 0.5 and 2—which represent odds ratios of the
same magnitude but opposite directions, will be equidistant
from 1.0
Studies with odds ratios below and above 1.0 will take up equal
space on the graph and thus look equally important
Also, confidence intervals will be symmetrical around the point
estimate.
21. Relative and Absolute Measures of Effect
Repeating the analysis by using relative risk instead of the odds ratio gives
an overall relative risk of 0.80 (95% confidence interval 0.73 to 0.88)
The odds ratio is thus close to the relative risk, as expected when the
outcome is relatively uncommon
The relative risk reduction, obtained by subtracting the relative risk from 1
and expressing the result as a percentage, is 20% (12% to 27%)
The relative measures used in this analysis ignore the absolute underlying
risk
The risk of death among patients who have survived the acute phase of
myocardial infarction, however, varies widely
E.g., among patients with three or more cardiac risk factors the probability of
death at two years after discharge ranged from 24% to 60%
Conversely, two year mortality among patients with no risk factors was less
than 3%.
The absolute risk reduction or risk difference reflects both the underlying
risk without treatment and the risk reduction associated with treatment
Taking the reciprocal of the risk difference gives the "number needed to
treat" (the number of patients needed to be treated to prevent one event)
22. ß Blockade in secondary prevention after myocardial infarction—absolute
risk reductions and numbers needed to treat for one year to prevent one
death for different levels of mortality in control group
One year mortality risk among controls
(%) Absolute risk reduction No needed to treat
1 0.002 500
3 0.006 167
5 0.01 100
10 0.02 50
20 0.04 25
30 0.06 17
40 0.08 13
50 0.1 10
Calculations assume a constant relative risk reduction of 20%.
23. Sensitivity Analysis
The robustness of the findings to different assumptions
should therefore always be examined in a thorough
sensitivity analysis
This is illustrated in Figure below for the meta-analysis
of ß blockade after myocardial infarction
Firstly, the overall effect was calculated by different
statistical methods, by using both a fixed and a random
effects model
The Figure shows that the overall estimates are virtually
identical and that confidence intervals are only slightly wider
with the random effects model
This is explained by the relatively small amount of variation
between trials in this meta-analysis.
24. Sensitivity analysis of meta-
analysis of β-blockers in
secondary prevention after
myocardial infarction
Egger, M. et al. BMJ 1997;315:1533-1537
25. Sensitivity Analysis contd.
Methodological quality was assessed in terms of how
patients were allocated to active treatment or control
groups, how outcome was assessed, and how the data were
analysed
The maximum credit of nine points was given if patient
allocation was truly random, if assessment of vital status
was independent of treatment group, and if data from all
patients initially included were analysed according to the
intention to treat principle
The above Figure shows that the three low quality studies
(7 points) showed more benefit than the high quality trials
Exclusion of these three studies, however, leaves the overall effect
and the confidence intervals practically unchanged
26. Sensitivity Analysis contd.
Significant results are more likely to get published than
non-significant findings,and this can distort the findings
of meta-analyses
Presence of such publication bias can be identified by
stratifying the analysis by study size—smaller effects can be
significant in larger studies
If publication bias is present, it is expected that, of published
studies, the largest ones will report the smallest effects
The above Figure shows that this is indeed the case, with the
smallest trials (50 or fewer deaths) showing the largest effect.
However, exclusion of the smallest studies has little effect on
the overall estimate.
27. Sensitivity Analysis contd.
Two studies (J and N) were stopped earlier than anticipated
on the grounds of the results from interim analyses
Estimates of treatment effects from trials that were stopped early
are liable to be biased away from the null value
Bias may thus be introduced in a meta-analysis that includes such
trials
Exclusion of these trials, however, affects the overall estimate only
marginally
The sensitivity analysis thus shows that the results from this
meta-analysis are robust to the choice of the statistical
method and to the exclusion of trials of poorer quality or of
studies stopped early
It also suggests that publication bias is unlikely to have
distorted its findings
28. References
1. Egger M., Smith G.D., Phillips A.N. Meta-analysis: Principles
and procedures. BMJ 1997;315:1533-1537