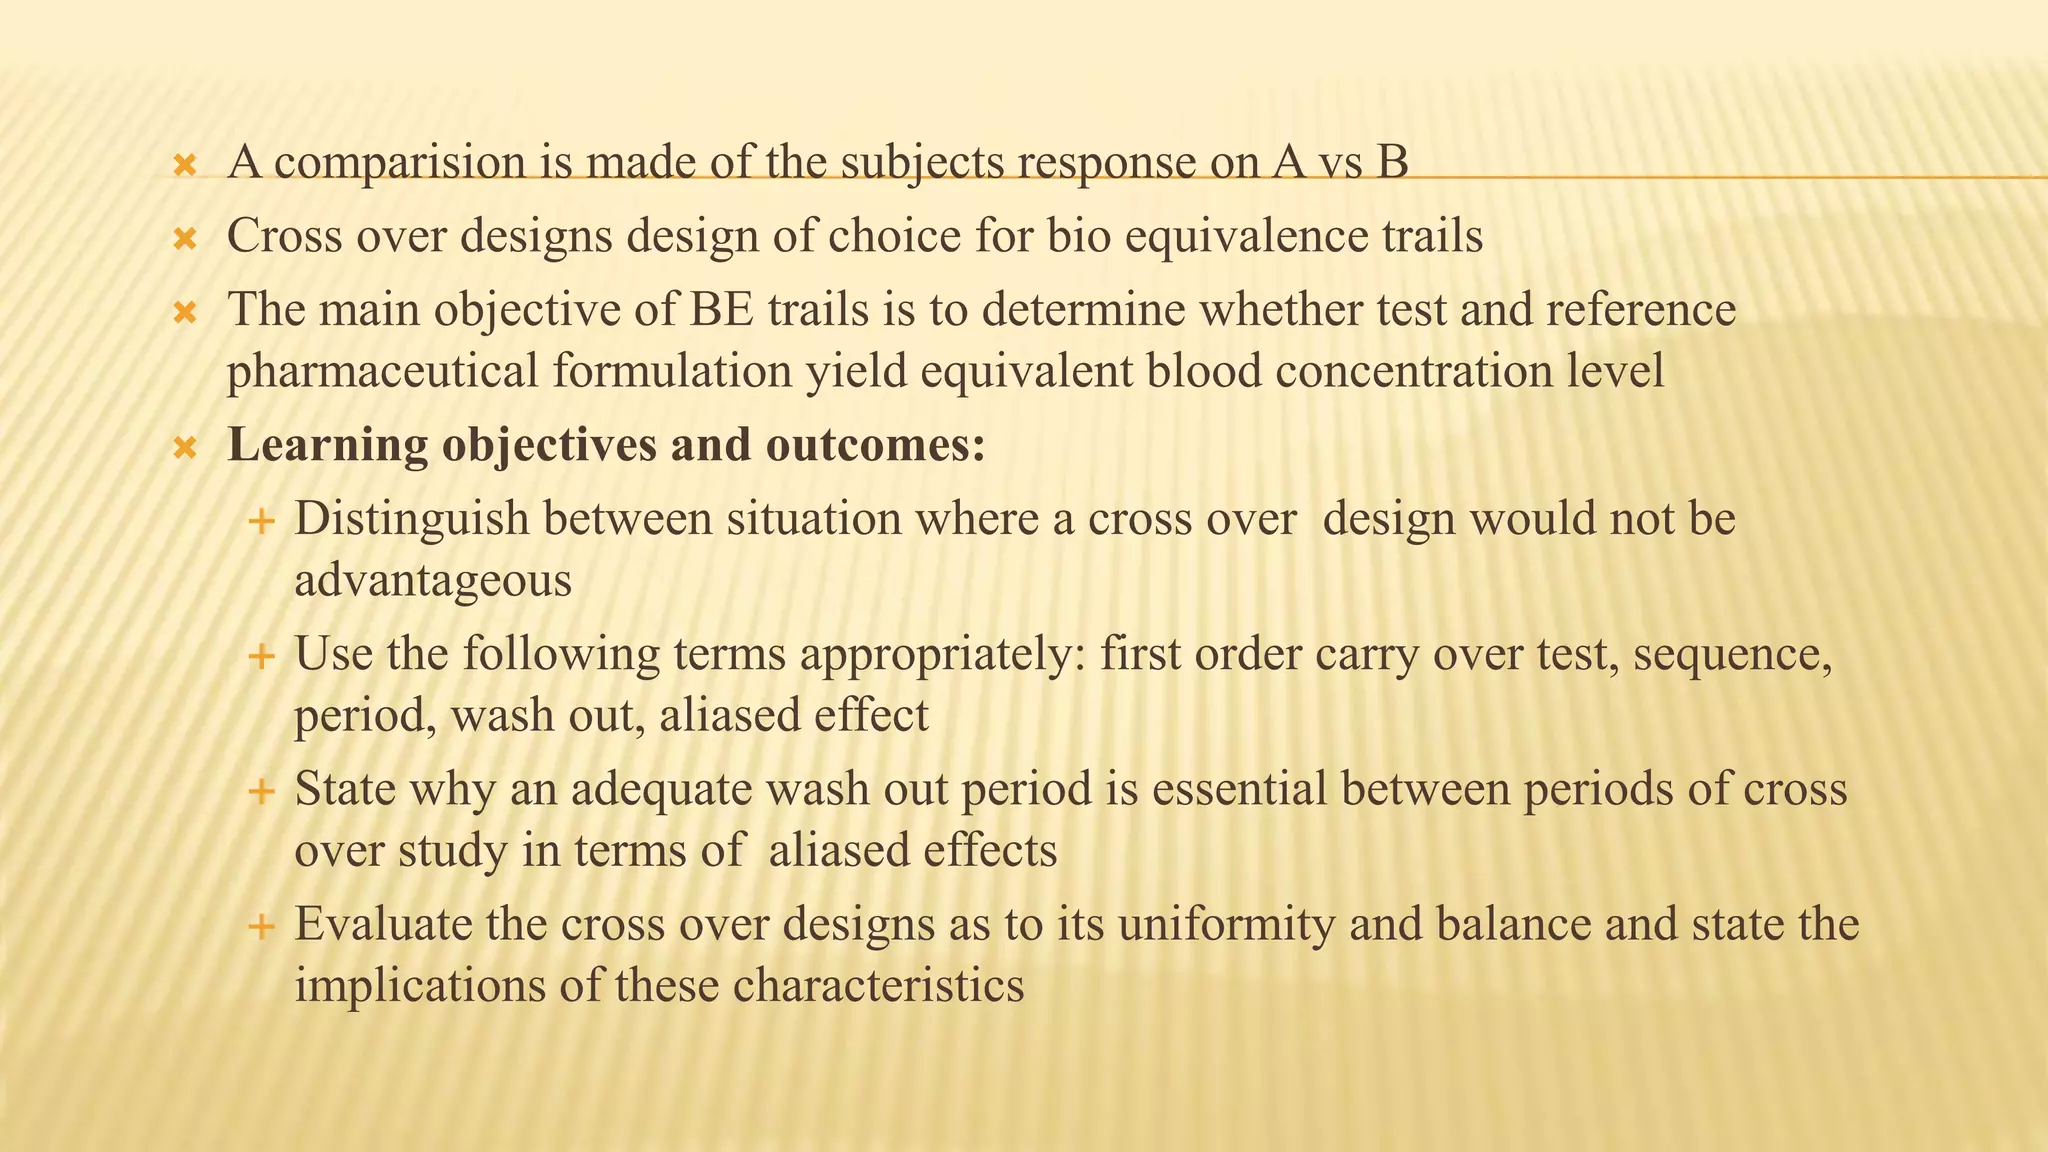
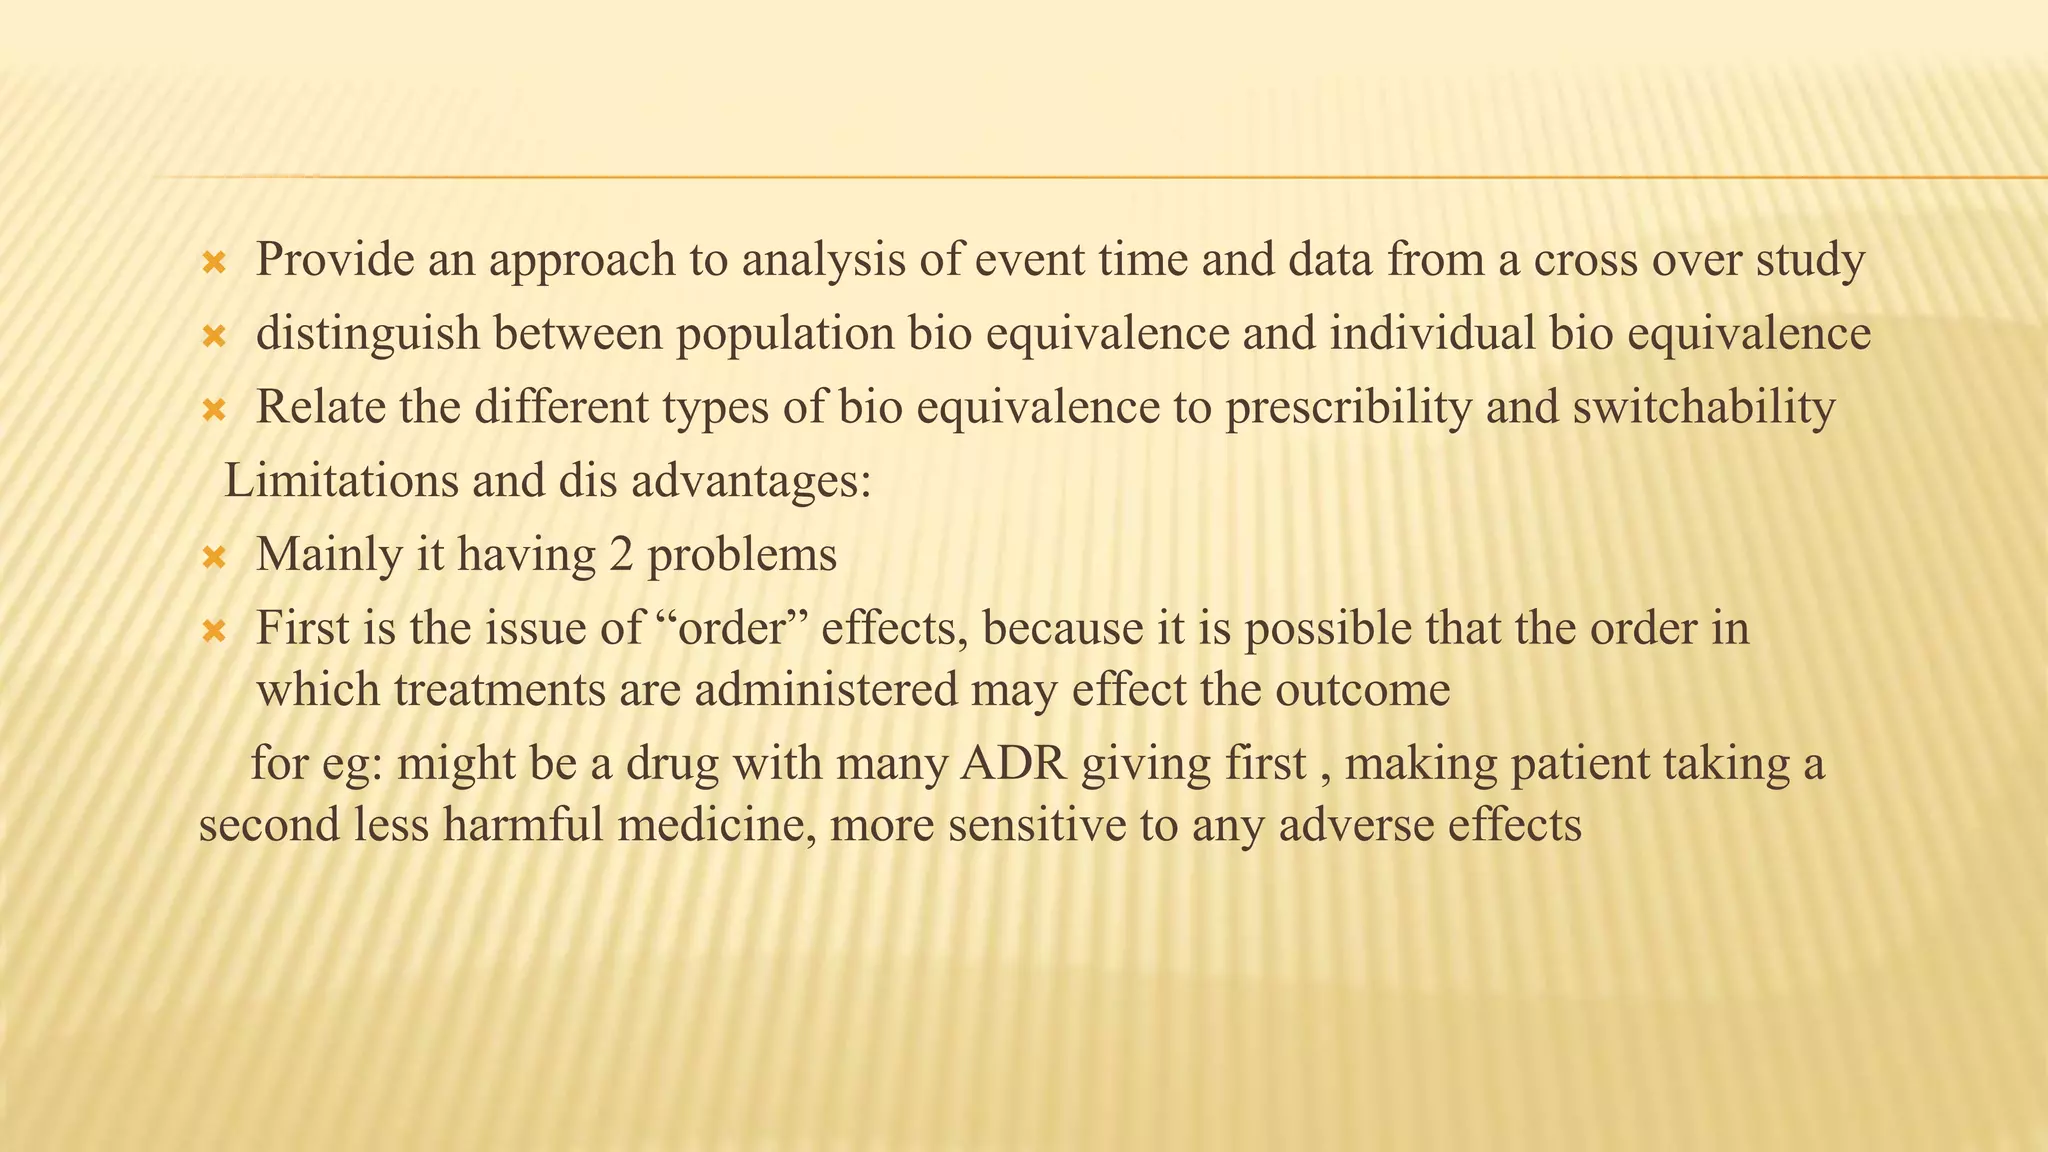
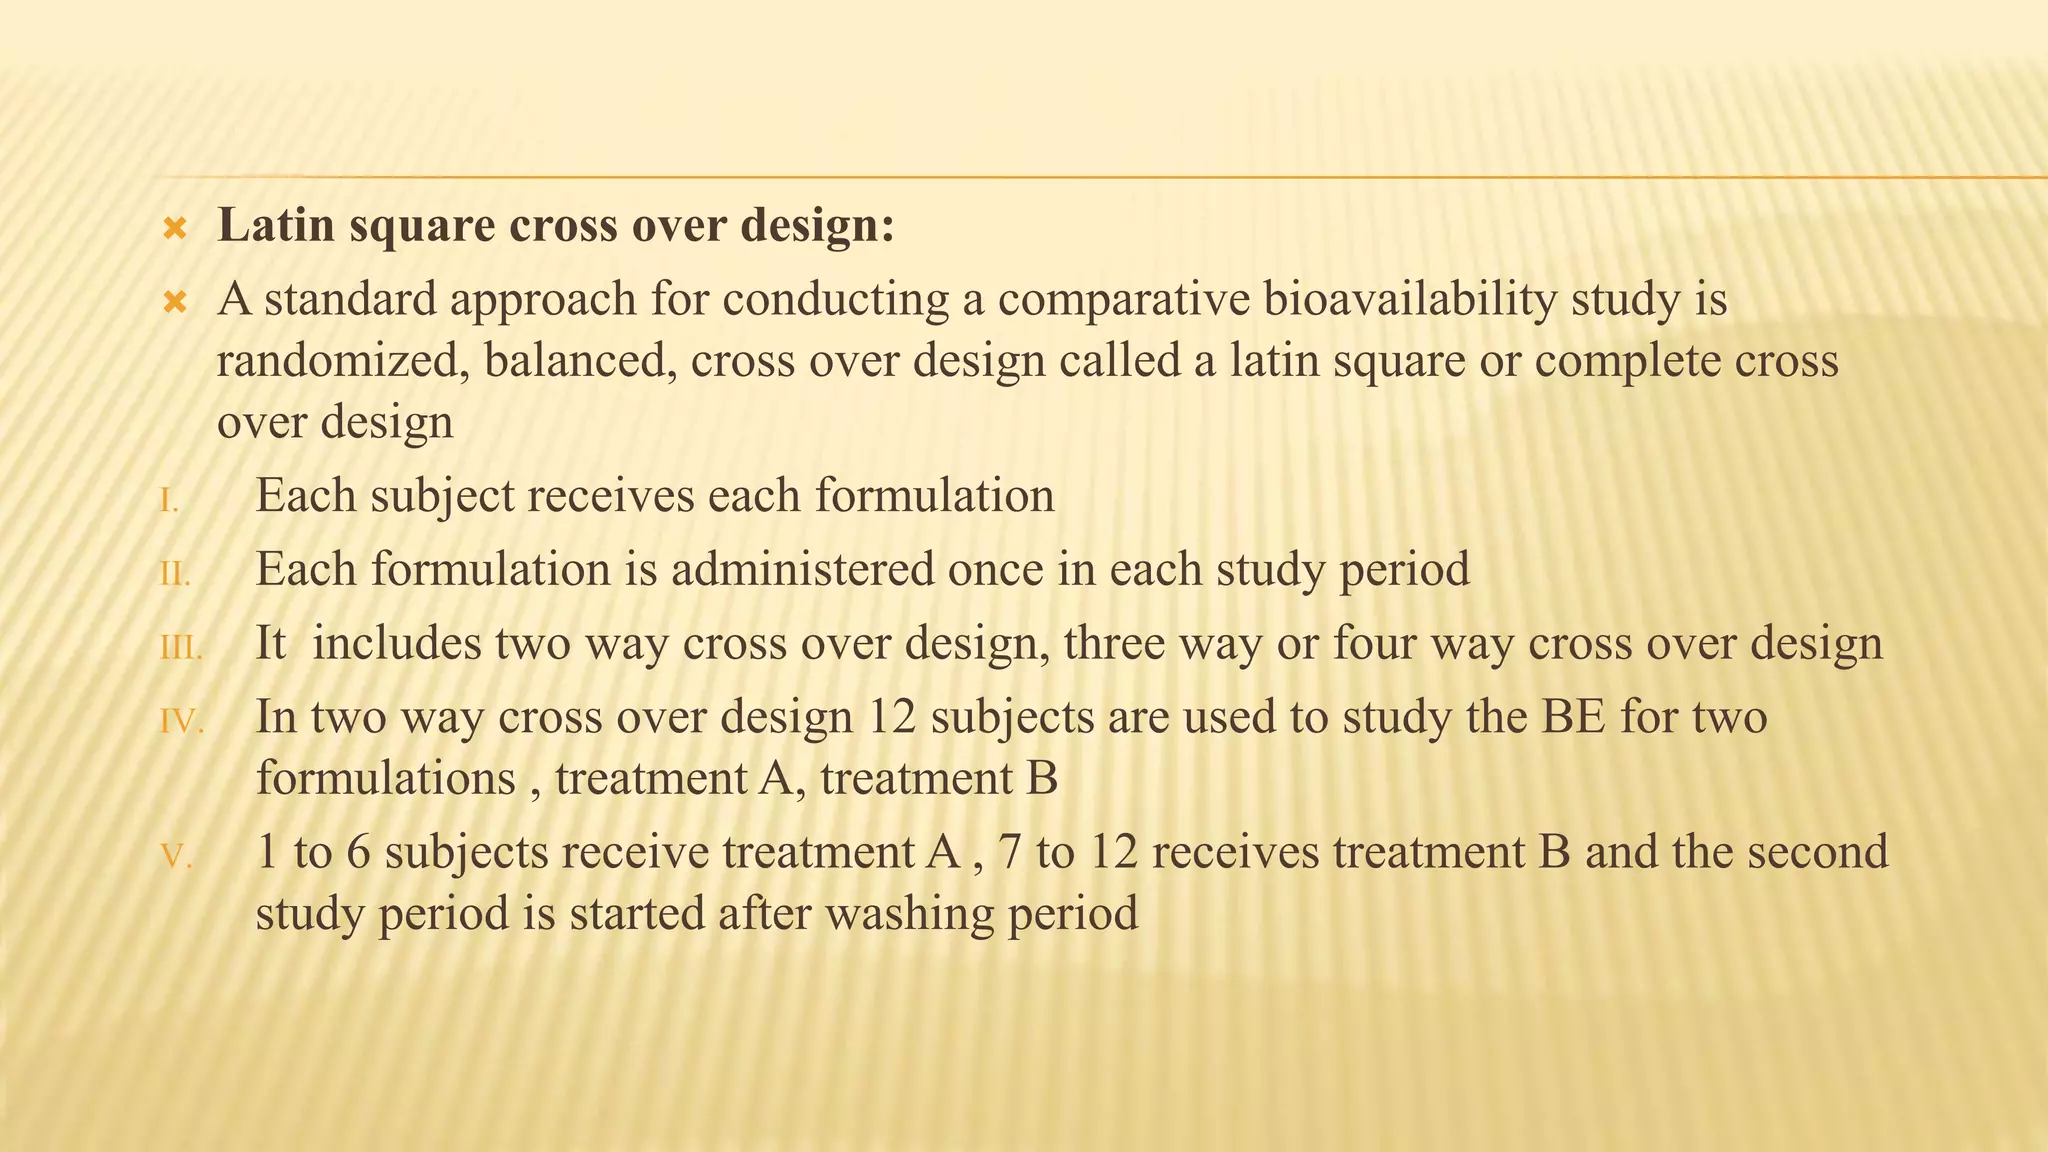
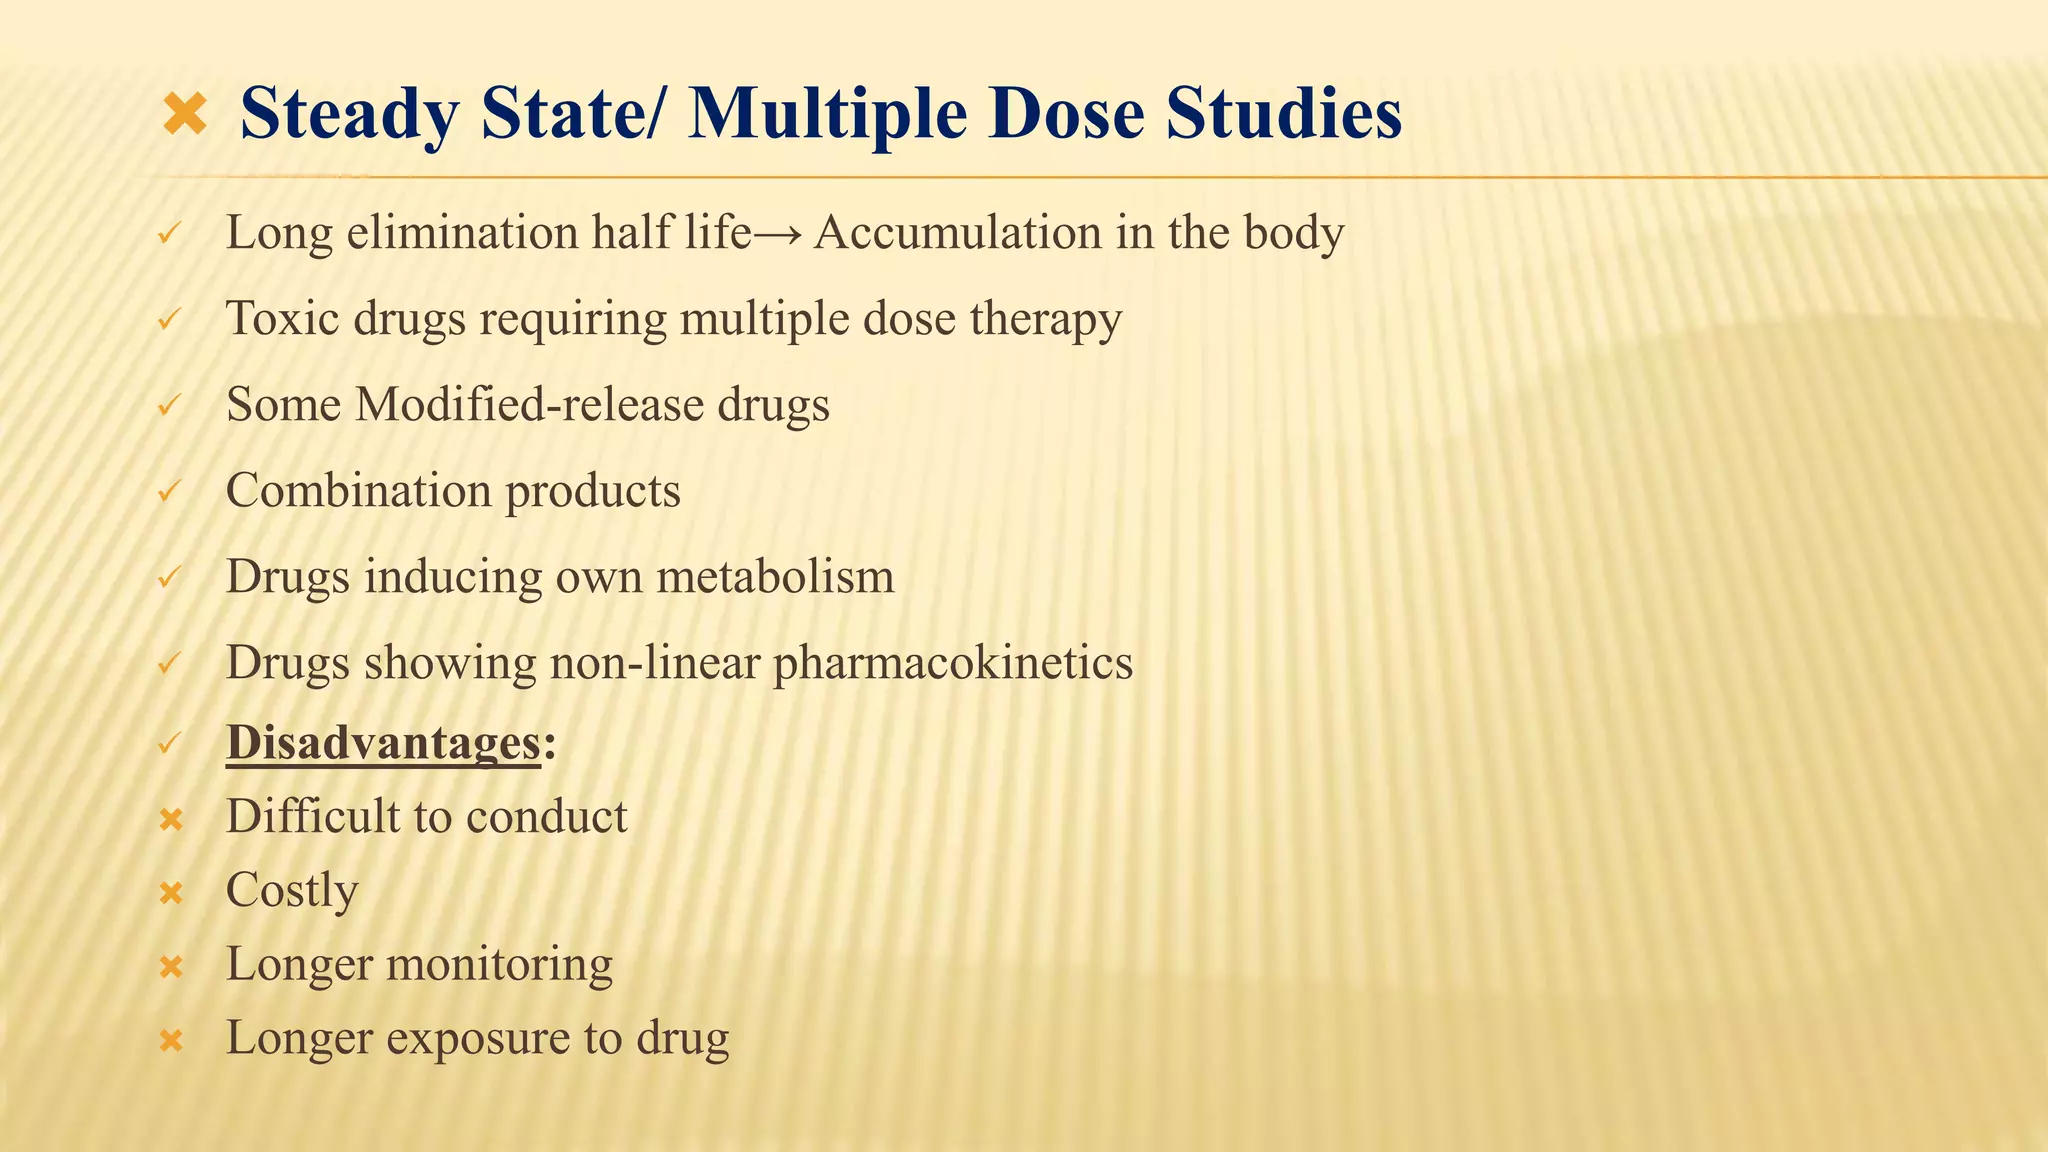
This document discusses bioequivalence studies. It defines bioequivalence as when two drug products reach systemic circulation to the same relative extent, with their plasma concentration-time profiles being identical without statistically significant differences. It describes the analytical methods, pharmacokinetic evaluation, and statistical evaluation used in bioequivalence studies. It also discusses study designs such as parallel designs, crossover designs, and fasting versus fed conditions that can be used in bioequivalence studies.
Introduction,Definations,Types of Bioequivalence studies,Invitro,Invivo studies,Biowaivers,Study protocol,Types of study designs,statistical procedures,conclusion
Bioequivalence is a term in pharmacokinetics used to assess the expected in vivo biological equivalence of two proprietary preparations of a drug. If two products are said to be bioequivalent it means that they would be expected to be, for all intents and purposes, the same.
The first generation of biological drugs, which
have introduced many revolutionary treatments to life threatening and rare illnesses, is currently facing patent expiration. As a result, research-based and generics pharmaceutical companies alike are pursuing the opportunity to develop “generic” substitutes to original biologics, which are also known as biosimilars.
Bioequivalence – Still a Quality Achilles’ Heel? 16 October 2014Ajaz Hussain
Therapeutic Equivalence of a generic product to its reference listed drug is a function of Pharmaceutical Equivalence, Bio-equivalence, Labeling considerations and compliance with CGMPs. Bio-equivalence assessment is often the primary focus of discussion when questions are raised on Therapeutic Equivalence. This presentation argues that Pharmaceutical Equivalence can often pose a challenge and we currently may not be giving due attention to this aspect.
Significance of BA/BE studies in drug research and evaluation of different as...inemet
PharmaCon2007 Congress, Dubrovnik, Croatia "New Technologies and Trends in Pharmacy, Pharmaceutical Industry and Education" http://www.pharmacon2007.com
Abstract is available at http://www.pharmaconnectme.com
This In-house presentation was given as part of MSc. Clinical Research and consist only the Design and Conduct of BA/BE Studies of CDSCO Guideline. (INDIA)
Freshers in clinical research and regulatory affairs must go through this presentation. It will help you to understand the basis of clinical trial design as per European guidelines, which is the most preferred reference guideline. Initially, I also faced many problems to understand this concept. A student who is studying a clinical research diploma can also use this presentation for their basic understanding.
Randomized control trial is so called because the patients who constitute the unit of study are allocated into ‘study group’ and ‘control group’ at random depending upon whether they receive or do not receive the intervention.
RANDOMIZED CONTROL trials
an assessment method
questions validity and applicability of many preventive and therapeutic procedures
reference Park's Preventive and social medicine
How to scientifically conduct a clinical professional research trial? In the current era of Collaborate or parish, we need to keep this design in our mind.
Enjoy
@copyLeft
Levelwise PageRank with Loop-Based Dead End Handling Strategy : SHORT REPORT ...Subhajit Sahu
Abstract — Levelwise PageRank is an alternative method of PageRank computation which decomposes the input graph into a directed acyclic block-graph of strongly connected components, and processes them in topological order, one level at a time. This enables calculation for ranks in a distributed fashion without per-iteration communication, unlike the standard method where all vertices are processed in each iteration. It however comes with a precondition of the absence of dead ends in the input graph. Here, the native non-distributed performance of Levelwise PageRank was compared against Monolithic PageRank on a CPU as well as a GPU. To ensure a fair comparison, Monolithic PageRank was also performed on a graph where vertices were split by components. Results indicate that Levelwise PageRank is about as fast as Monolithic PageRank on the CPU, but quite a bit slower on the GPU. Slowdown on the GPU is likely caused by a large submission of small workloads, and expected to be non-issue when the computation is performed on massive graphs.
StarCompliance is a leading firm specializing in the recovery of stolen cryptocurrency. Our comprehensive services are designed to assist individuals and organizations in navigating the complex process of fraud reporting, investigation, and fund recovery. We combine cutting-edge technology with expert legal support to provide a robust solution for victims of crypto theft.
Our Services Include:
Reporting to Tracking Authorities:
We immediately notify all relevant centralized exchanges (CEX), decentralized exchanges (DEX), and wallet providers about the stolen cryptocurrency. This ensures that the stolen assets are flagged as scam transactions, making it impossible for the thief to use them.
Assistance with Filing Police Reports:
We guide you through the process of filing a valid police report. Our support team provides detailed instructions on which police department to contact and helps you complete the necessary paperwork within the critical 72-hour window.
Launching the Refund Process:
Our team of experienced lawyers can initiate lawsuits on your behalf and represent you in various jurisdictions around the world. They work diligently to recover your stolen funds and ensure that justice is served.
At StarCompliance, we understand the urgency and stress involved in dealing with cryptocurrency theft. Our dedicated team works quickly and efficiently to provide you with the support and expertise needed to recover your assets. Trust us to be your partner in navigating the complexities of the crypto world and safeguarding your investments.
Chatty Kathy - UNC Bootcamp Final Project Presentation - Final Version - 5.23...John Andrews
SlideShare Description for "Chatty Kathy - UNC Bootcamp Final Project Presentation"
Title: Chatty Kathy: Enhancing Physical Activity Among Older Adults
Description:
Discover how Chatty Kathy, an innovative project developed at the UNC Bootcamp, aims to tackle the challenge of low physical activity among older adults. Our AI-driven solution uses peer interaction to boost and sustain exercise levels, significantly improving health outcomes. This presentation covers our problem statement, the rationale behind Chatty Kathy, synthetic data and persona creation, model performance metrics, a visual demonstration of the project, and potential future developments. Join us for an insightful Q&A session to explore the potential of this groundbreaking project.
Project Team: Jay Requarth, Jana Avery, John Andrews, Dr. Dick Davis II, Nee Buntoum, Nam Yeongjin & Mat Nicholas
Show drafts
volume_up
Empowering the Data Analytics Ecosystem: A Laser Focus on Value
The data analytics ecosystem thrives when every component functions at its peak, unlocking the true potential of data. Here's a laser focus on key areas for an empowered ecosystem:
1. Democratize Access, Not Data:
Granular Access Controls: Provide users with self-service tools tailored to their specific needs, preventing data overload and misuse.
Data Catalogs: Implement robust data catalogs for easy discovery and understanding of available data sources.
2. Foster Collaboration with Clear Roles:
Data Mesh Architecture: Break down data silos by creating a distributed data ownership model with clear ownership and responsibilities.
Collaborative Workspaces: Utilize interactive platforms where data scientists, analysts, and domain experts can work seamlessly together.
3. Leverage Advanced Analytics Strategically:
AI-powered Automation: Automate repetitive tasks like data cleaning and feature engineering, freeing up data talent for higher-level analysis.
Right-Tool Selection: Strategically choose the most effective advanced analytics techniques (e.g., AI, ML) based on specific business problems.
4. Prioritize Data Quality with Automation:
Automated Data Validation: Implement automated data quality checks to identify and rectify errors at the source, minimizing downstream issues.
Data Lineage Tracking: Track the flow of data throughout the ecosystem, ensuring transparency and facilitating root cause analysis for errors.
5. Cultivate a Data-Driven Mindset:
Metrics-Driven Performance Management: Align KPIs and performance metrics with data-driven insights to ensure actionable decision making.
Data Storytelling Workshops: Equip stakeholders with the skills to translate complex data findings into compelling narratives that drive action.
Benefits of a Precise Ecosystem:
Sharpened Focus: Precise access and clear roles ensure everyone works with the most relevant data, maximizing efficiency.
Actionable Insights: Strategic analytics and automated quality checks lead to more reliable and actionable data insights.
Continuous Improvement: Data-driven performance management fosters a culture of learning and continuous improvement.
Sustainable Growth: Empowered by data, organizations can make informed decisions to drive sustainable growth and innovation.
By focusing on these precise actions, organizations can create an empowered data analytics ecosystem that delivers real value by driving data-driven decisions and maximizing the return on their data investment.
As Europe's leading economic powerhouse and the fourth-largest hashtag#economy globally, Germany stands at the forefront of innovation and industrial might. Renowned for its precision engineering and high-tech sectors, Germany's economic structure is heavily supported by a robust service industry, accounting for approximately 68% of its GDP. This economic clout and strategic geopolitical stance position Germany as a focal point in the global cyber threat landscape.
In the face of escalating global tensions, particularly those emanating from geopolitical disputes with nations like hashtag#Russia and hashtag#China, hashtag#Germany has witnessed a significant uptick in targeted cyber operations. Our analysis indicates a marked increase in hashtag#cyberattack sophistication aimed at critical infrastructure and key industrial sectors. These attacks range from ransomware campaigns to hashtag#AdvancedPersistentThreats (hashtag#APTs), threatening national security and business integrity.
🔑 Key findings include:
🔍 Increased frequency and complexity of cyber threats.
🔍 Escalation of state-sponsored and criminally motivated cyber operations.
🔍 Active dark web exchanges of malicious tools and tactics.
Our comprehensive report delves into these challenges, using a blend of open-source and proprietary data collection techniques. By monitoring activity on critical networks and analyzing attack patterns, our team provides a detailed overview of the threats facing German entities.
This report aims to equip stakeholders across public and private sectors with the knowledge to enhance their defensive strategies, reduce exposure to cyber risks, and reinforce Germany's resilience against cyber threats.
1. JAWAHARLAL NEHRU TECHNOLOGICAL UNIVERSITY,
KAKINADA
SUBMITTED TO
M.VINAY KUMAR SIR SUBMITTED BY
K.PUSHPA LATHA
1ST M.PHARM
PHARMACEUTICS
BIO EQUIVALENCE STUDIES
2. Bioequivalence:
Denotes that the drug substance in two or more identical dosageform , reaches the
systemic circulation at the same relative extent i.e., their plasma concentration-time
profiles will be identical with out significant differences are statistically significant
differences are observed in the bioavailability of two or more drug products, bio-
equivalence is indicated.
Evaluation of bio equivalence studies:
Analytical methods:
• Accuracy, precision, and specificity.
• More than one analytical method not be valid.
• Data presented in both tabulated and graphical form.
• Plasma drug concentration versus time curve for each drug product and each subject.
3. Pharmacokinetic evaluation of the data:
• single dose study: AUC0-t,AUC0-∞, Tmax, Cmax, Cmin and percent
fluctuation[100*(Cmax-Cmin)/Cmin].
Statistical evaluation of the data:
• No statistical difference between the bioavailability of the test product and
the reference product.
• Bell-shaped curve
• Log values resembles more closely a normal distribution
Analysis of variance(ANOVA):
• No significance difference
• AUC0-∞, Tmax&Cmax
4. • Evaluate variability in subjects, treatment groups, study period , formulation &
other variables.
• Variability in the data is large then two drug products are bioequivalent.
• Statistically significant , if p≤0.05.
• P-level of stastitical significance.
• If p≥0.05 the difference between the two drug products are not statistically
significant
• To detect small differences between the test products , a power test is
performed
• Sample size, variability of the data & desired level of significance
• Power is set at 0.80 with an α=0.2 & a level of significance of 0.05.
5. Two one sided tests procedure:
• Confidence interval approach
• Greater 20%
• 90% confidence limts
• Students t-distribution of the data
• With in 20%
• Low 90% confidence interval for the ratio of means cannot be less than 0.8 & the
upper 90%confidence interval for the ratio of the means cannot be greater than 1.20
• Log transformed data , 90%confidence interval is set at 80 to 125%
• Confidence limits termed the bio equivalencecui interval
• No statistical difference the mean AUC & Cmax values of the test drug product
should not be less than 0.8(80%) nor greater than 1.25(125%) of the reference
product based on log transformed data.
6. CLINICAL SIGNIFICANCE:
Clinical interpretation is important in evaluating the results of a
bioequivalence study
Difference of less 20% in AUC & Cmax between the drug products are
unlikely to be clinically significant n patients
A small , statisically significant difference if the study well controlled &the
no. of subjects is sufficient large.
Above MEC & do not reach the MTC
Elderly or patients
Normal healthy volunteers
Minimize product to product variability by different manufactures & lot to
variability with a single manufacturer .
7. Study design:
Steps involved in designing a study:
outline of the study
Title the study
Research questions
Research hypothesis(specific hypothetical and sequential sets of questions to be
addressed)
Significance of the study
Comprehensive description of the study
Inclusion and exclusion criteria
What out comes and other factors will be measured
How will data be analysed
8. Study design conti…
How will the data be safe guarded
Potential problem areas_ logistics
Limitations of study and how can these be corrected
Is the study proposal approved(approved pending ) by IRB
POTENTIAL PROBLEMS AND SOLUTIONS IN DESIGNING
STUDIES:
Research question is too broad/general
Not enough subject available
Proposal confusing (or) unclear
Too expensive
9. TYPES OF STUDY DESIGNS:
1. Observational studies
2. Experimental studies
In both, the effects of casual may be assessed. The effects are the outcomes, where
the causes are usually generically called “exposures”
The key difference for experimental and observational study is the control of
exposures.
In some experimental studies the investigator can control exposure and determines
who get exposure and how much exposure one gets.
In some experimental studies, the investigator able to control allocation of exposure
groups. Such studies are generally referred as quasi-experimental studies
Quasi-experimental studies more easily conducted and poorer internal validity when
compared to randomized studies.
10. • In contrast, the observational studies , the investigator does not get to control
the exposure but classifies the participants based on their pre existing
exposure status. The determinants of the exposure lie in the population, or
otherwise outside the control of the investigator.
Observational Studies Experimental studies
1. Descriptive or case-series 1. Controlled trails
2. Retrospective or case-control a)parallel designs
3. Cross-sectional (prevalence),surveys b)sequential designs
4. Prospective (cohorot) c)external controls
5. Retrospective cohort 2)studies with no control
11. Obeservtional studies:
1) Retrospective studies:
• Begin with disease/condition/outcome and look back for fetures (exposure) of
those with or with out outcome
• Useful for:
o Hypothesizing causes of disease
o Identifying risk factors
• Weaknesses:
o Biased case and and/ or control selection
o Biased exposure ascertainment
o Temporal sequence of exposure/outcome
• Advantages :
o Data availability (design of choice for choice for chart reviews)
o Usually expensive
o Can be performed quickly
12. Matching cases and controls:
o prevents imbalance of known risk factor and potential confounding
o Can reduce variability (increase efficiency)
o Require special analysis techniqes
2)Retrospective cohort design:
Use previously collected data on well defined cohort
Common approach for disease or treatment registries since meticulous record
keeping is required
All follow up took place in the past
Subject to many of the same biases of other retrospective designs
Allows estimation of prospective-like measures
13. Cross-sectional design:
o Classifies a population or group with respect to both out come and exposure at a
single point in time
useful for
Disease description
diagnosis and staging
describing disease processes, mechanism
weaknesses:
Subject to sampling and recall biases
Temporal order problem
Can’t estimate disease incidence only prevelance
Surveys:
Single point in time studies; many utilizes sampling techniques to assure
generability
Complex survey designs use probability sampling
14. Target population is divided into clusters; subsets of cluster are sampled randomly
Certain clusters may be “over sampled” to assure representation
statistical analyses require special methods that correct variance for study designs
• Prospective design:
Start with cohort study and follow up for occurrence of disease/ outcome
Considered the optimal design for observational studies
Uses for:
Finding causes and estimating incidence of disease
Identification of risk factors
Following natural history , determining prognosis
• Weaknesses:
Subject to selection bias and survillence bias
Losses to follow up or drop outs
Temporal changes in health habits.
15. Can be expensive and always take time
Advantages :
Correct temporal relationship between exposure and disease/ outcome
Allows estimation of disease incidence and relative risks
EXPERIMENTAL STUDIES:
CLINICAL TRAILS:
Participants are assigned to an experimental treatment and followed for event
of interest
Clinical trail may be:
a) be randomized or non- randomized
b) include a control group or have no control group
c) compare current treatment to an historical control
d) employ parallel or cross over design
e) employ blinding of investigator and/ or participant
16. The randomized , double-blind,placebo- controlled parallel design is
considered to be the best determine efficasy
Randomization:
Purpose: to balance group on both observed and unobserved factors
No guarantees: balance occurs in expectation(i.e., there is chance that
some factors will not be balanced)
In cross over design, it’s best to randomize treatment order(if possible)
Stratification used to assure balance on factor of interest.
17. Parallel design:
o This designs are helpful to minimize the experimental variables and to avoid a
bias
o In this design, two formulations are administered randomly to the volunteers
o Disadvantage:
o Inter subject variation is not being corrected
Parallel design is preffered in case of:
The inter subject variability is relatively low compared with intra subject
variability
The drug is toxic or it may have long half life examples: triptorillin, goserillin
acetate
The population of interest consists of very ill patients
The cost for increasing the no. of subjects is less than that of adding additional
treatment period
18. Non control or non randomized designs:
Patients not assigned to treatment (or treatment order) via
randomization; interpret with caution
External or historical controls: compare current experiment to an
external control group (eg: from prior study or literature) interpret
with caution
Uncontrolled trail: experimental group only (no comparsion);
interpret with caution
19. Cross over design:
A cross over design is a repeated measurements design such that each
experimental unit(patient) receives different treatments during the different time
periods i,e., the patients cross over from one treatment to another during the
course of trail. This is in contrast to a parallel design in which patients are
randomized to a treatment and remain on that treatment through out the duration
of the trail
The reason to consider a cross over design when planning a clinical trail that it
could yield a more efficient comparison of treatment than parallel design
Institutively this seems reasonable because each patient serves as his/her own
matched control
Every patient should receive both A and B
Cross over design are popularly used for agriculture, medicine ,
manufacturing, education and many other disciplaines
20. A comparision is made of the subjects response on A vs B
Cross over designs design of choice for bio equivalence trails
The main objective of BE trails is to determine whether test and reference
pharmaceutical formulation yield equivalent blood concentration level
Learning objectives and outcomes:
Distinguish between situation where a cross over design would not be
advantageous
Use the following terms appropriately: first order carry over test, sequence,
period, wash out, aliased effect
State why an adequate wash out period is essential between periods of cross
over study in terms of aliased effects
Evaluate the cross over designs as to its uniformity and balance and state the
implications of these characteristics
21. Provide an approach to analysis of event time and data from a cross over study
distinguish between population bio equivalence and individual bio equivalence
Relate the different types of bio equivalence to prescribility and switchability
Limitations and dis advantages:
Mainly it having 2 problems
First is the issue of “order” effects, because it is possible that the order in
which treatments are administered may effect the outcome
for eg: might be a drug with many ADR giving first , making patient taking a
second less harmful medicine, more sensitive to any adverse effects
22. Second is the issue of “carry-over” between treatments which
confunds the estimates of the treatments effect. In practice carry- over
effect can be avoided with a long sufficiently long wash out period
between treatments
Cross over study:
Usually a substantial inter subject variability exists in drug levels
achieved from any given dose of medication in panel
The cross over design minimize the effect of inter subject variability
in the study by using each subject as his own control
It is of 2types
1.Latin square cross over design
2.Balanced incomplete block design
23. Latin square cross over design:
A standard approach for conducting a comparative bioavailability study is
randomized, balanced, cross over design called a latin square or complete cross
over design
I. Each subject receives each formulation
II. Each formulation is administered once in each study period
III. It includes two way cross over design, three way or four way cross over design
IV. In two way cross over design 12 subjects are used to study the BE for two
formulations , treatment A, treatment B
V. 1 to 6 subjects receive treatment A , 7 to 12 receives treatment B and the second
study period is started after washing period
24. In second study period 1 to 6 receives treatment B, where 7 to 12 receives treatment A.
there fore each subject as his own control
Advantages:
It minimizes the effect of inter subject variability in the study by using each subject
as his or her own control
It requires less no.of subjects to get meaning full results
It minimizes the effect of time on bioavailability since each dosage form is
administered in each study period
Dis advantages:
It requires longer duration to complete the study
The time to complete the trail is based on no.of formulations evaluated in the study
Increased no. of study periods leads to high subject dropouts and the study becomes
difficult
25. Balanced in complete block design:
A BBID eliminates many of the difficulties encountered
with the latin square design. Salient features of design :
Each subject receives not more than two formulations
Each formulation is administred te same no of times
Each pair of formulations occurs together in the same no of subjects
Table shows 4 formulations
Eac subject receives 2 formulations
Each formaulation administred 6
times and eah pair of formulation
Occur together in 2 subjects, pairs
Are AB,AC,AD,BC,BD,CD
26. Replicated cross over design:
These study deigns are critical when an individual BE approach is used to
allow estimation of with in – subject variences for T and R measures and the
subject by formulation interacton varience component
Following is the four – period , two- sequence, two- formulation design
recommended for replicated BE studies
Period 1 2 3
Group 1 T R T
Group 2 R T R
4
R
T
27. Fasting & Fed State Conditions
Fasting Conditions:
Single dose study:
Overnight fast (10 hrs) and subsequent fast of 4 hrs
Multiple dose study:
Two hours fasting before and after the dose
28. Fed State Studies
Required when:
Drug recommended with food
Modified release product
Assessment of Cmax and Tmax difficult with fasting state study
Requires consumption of a high fat food, 15 minutes before dosing
Provide 950-1000 kcals
Fat- 50%, Proteins 15-20%, Carbohydrate- 30-35%
Ethnic & cultural variation considered
Specified in protocol
29. Steady State/ Multiple Dose Studies
Long elimination half life→ Accumulation in the body
Toxic drugs requiring multiple dose therapy
Some Modified-release drugs
Combination products
Drugs inducing own metabolism
Drugs showing non-linear pharmacokinetics
Disadvantages:
Difficult to conduct
Costly
Longer monitoring
Longer exposure to drug
30. Evaluation of data:
Statistical Evaluation
Primary concern of bioequivalence is to limit Consumer’s &
Manufacturer’s risk
Cmax & AUC analysed using ANOVA
Tmax analysed by non-parametric methods
Use natural log transformation of Cmax and AUC
Calculate Geometric means of Cmax of Test [Cmax’t]
Calculate Geometric means of Cmax of Reference [Cmax’r]
Calculate Geometric Mean Ratio = [Cmax’t] / [Cmax’r]
Calculate 90% confidence interval for this GMR for Cmax
Similarly calculate GMR for AUC
31. To establish BE:
The calculated 90% CI for Cmax & AUC, should fall within range:
80-125% (Range of Bioequivalence)
Non-parametric data 90% CI for Tmax should lie within
clinical acceptable range
BE Results
T/R (%)80% 125%
Demonstrate BE
Demonstrate BE
Fail to Demonstrate BE
Fail to Demonstrate BE Fail to Demonstrate BE
32. Study submission and drug review process:
IND / NDAS:
Documentation of bioequivalence may be useful during the investigation of new
drug to find links between
(I) early and late clinical trial formulations
(II) formulations used in clinical trial and constancy studies, if different
(III) clinical trial formulations and to be marketed pharmaceutical drug product
(IV) other evaluation, as appropriate.
In each comparison, the new formulation or new method of manufacture is the
pharmaceutical test product and the prior formulation or method of manufacture
is the reference product.
33. It is suggested that the determination of re-document
bioequivalence during the new drug application period because the
pharmaceutical test product produces higher or lower measures of
rate and extent of absorption in our body or because the
performance of the pharmaceutical test or reference is more
In some cases, BIOINEQUIVALENCE is observed because of
insufficient numbers of subjects entered into the BE study.
34. ANDAs
Bioequivalence studies are a critical component of ANDA
submissions.
The purpose of these studies is to demonstrate BE between a
pharmaceutically equivalent generic drug product and the
corresponding reference listed drug (21 CFR 314.94). Together with
the determination of pharmaceutical equivalence, establishing BE
allows a regulatory conclusion of therapeutic equivalence.
In addition to a BE study under fasting conditions, it is recommended
a BE study under fed conditions for administered the immediate-
release drug products in orally
35. Bio-pharmaceutical classification system:
Introduction
The Biopharmaceutics Classification System (BCS) is a scientific
framework for classifying drug substances based on their aqueous solubility and
intestinal permeability. This classification system was devised by Amidon et al.
This concept underlying the BCS published finally led to introducing the
possibility of waiving in vivo bioequivalence (BE) studies in favor of specific
comparative in vitro testing to conclude BE of oral immediate release (IR)
products with systemic actions.
36. Solubility determination
The solubility of any substance can be defined as the amount of substance that has
passed into solution when equilibrium is attained between the solution and excess
(undissolved substance) at a given temperature and pressure.
A drug substance or an active pharmaceutical ingredient (api) is considered highly
soluble when the highest dose strength is soluble in 250 ml or less of aqueous
medium over a specific ph range.
The ph solubility profile of the drug substance is determined at 37 + 1°c in aqueous
medium with ph in the range of 1-7.5 as per united states food and drug
administration (USFDA) guidelines,1.2-6.8 as per world health organization (WHO)
guidelines and 1-8 as per european medicines academy (EMEA)
37. . Standard buffer solutions described in pharmacopoeias are considered
appropriate for use in solubility studies. Methods other than shake-flask method
can also be used with justification to support the ability of such methods to
predict equilibrium solubility of test drug substance
Permeability determination:
The methods that are routinely used for determination of permeability include the
following:
a. Pharmacokinetic studies in human subjects including mass balance studies
and absolute bioavailability (BA) studies or intestinal permeability methods
b. In vivo or in situ intestinal perfusion in a suitable animal model
c. In vitro permeability methods using excised intestinal tissues
d. Monolayers of suitable epithelial cells e.g. Caco-2 cells or TC-7 cells
38. In mass balance studies, unlabeled, stable isotopes or
radiolabeled drug substances are used to determine the extent of
drug absorption.
In absolute BA studies, oral BA is determined and compared
against the intravenous BA as reference.
Intestinal perfusion models and in vitro methods are suggested
for passively transported drugs.
39. It is a scientific framework for classifying drug substances based on their aqueous
solubility and intestinal permeability.
It is a drug-development tool that allows estimation of the contributions of three
major factors, dissolution, solubility and intestinal permeability that affect oral
drug absorption from IR solid oral dosage forms.
It was first introduced into regulatory decision-making process in the guidance
document on immediate release solid oral dosage forms: Scale-up and
postapproval changes.
The drugs are divided into high/low-solubility and permeability classes.
Currently, BCS guidelines are provided by USFDA, WHO and EMEA
40. Class boundaries:
Solubility
Permeability
Disssolution
Classification
According to BCS, drug substances or APIs are divided into
high/ low solubility and permeability classes as follow:
Class I : High Solubility - High Permeability
Class II : Low Solubility - High Permeability
Class III : High Solubility - Low Permeability
Class IV : Low Solubility - Low Permeability
41. In combination with the dissolution, the BCS takes into account the
three major factors governing BA, viz. dissolution, solubility and
permeability.
The BCS in accordance with WHO guideline is shown in Figure 1.
This classification is associated with drug dissolution and absorption
model, which identifies the key parameters controlling drug
absorption as a set of dimensionless numbers.
Absorption number, (An) = Mean residence time/mean absorption
time Dissolution number, (Dn) = Mean residence time/mean
dissolution time
43. Applications of BCS:
Class 1- high solubility & high permeability
1. Achieve a target release profile associated with a particular
pharmacokinetic and /or pharmacodynamics profile
2. Formulation approaches include both control of release rate and
certain physicochemicak properties of drug like ph- solubility profile
of drug
Class 2: high permeability& low solubility
1. Micronisation
2. Addition of surfactants
3. Formulation as emulasions micro emulsions systems
4. Use of complexing agents like cyclodextrins
44. Class 3- low permeability & high solubility
1. Require the technologies that address to fundamental limitations of
absolute or regional permeability
2. Peptides and proteins constitute the part of class 3 and the
technologies handling such materials are on rise now days
Class 4- low solubility & low permeability:
1. Major challenge for development of drug delivery system and choice
for administering such drugs is parenteral (solubility enhancers)
2. Fortunately , etreme examples are the exception rather than the rule
and are rarely develop and reach the market