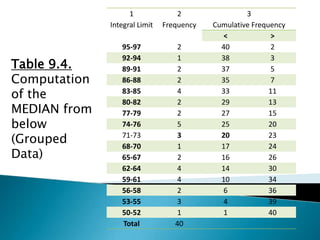
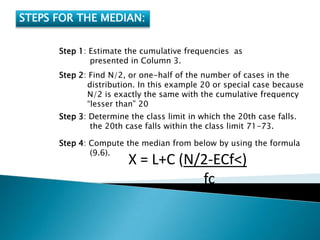
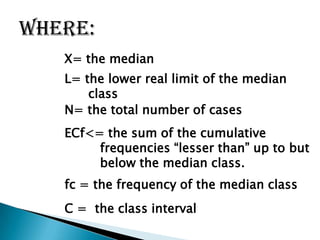
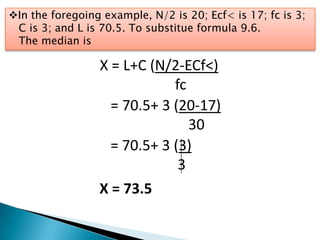
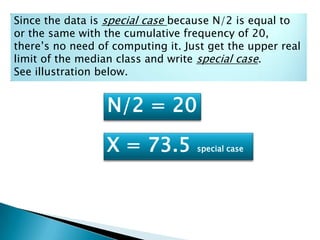
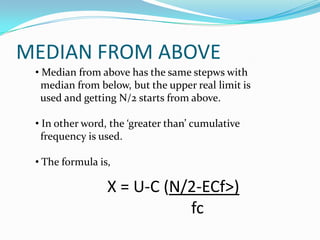
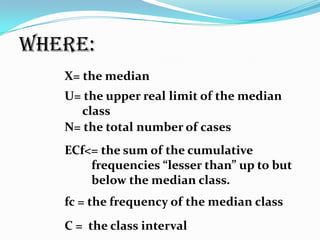
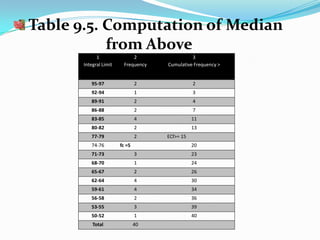
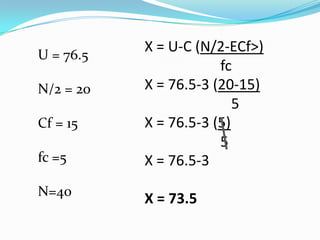
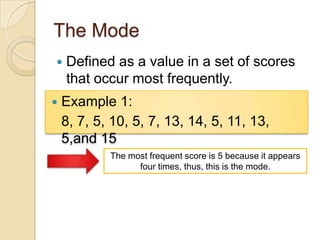
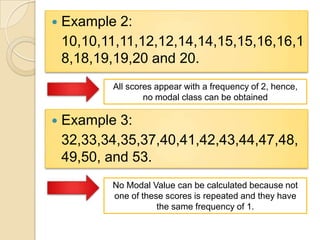
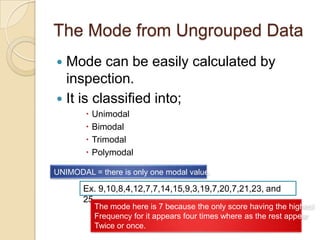
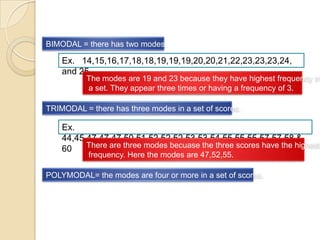
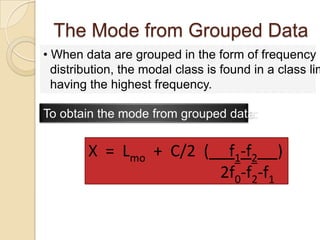
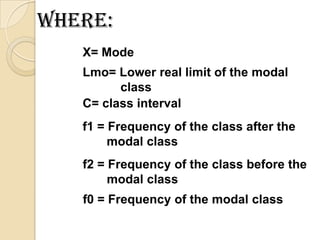
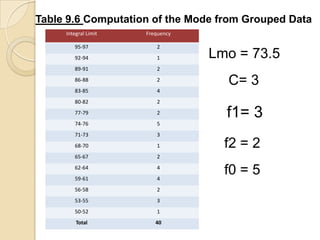
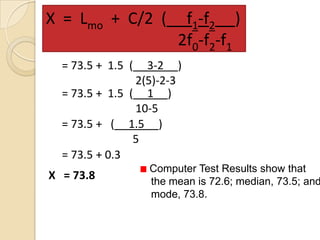
 Another measure of central tendency that is commonly used by
by class room teachers.
 Defined as a point on scale such that scores above or below lie
50 % of the cases.
THE MEDIAN FROM UNGROUPED
The median of a set ungrouped data is obtained by computing
the midpoints of the two middle scores when the set of score is even.
When the set of scores is odd, pick out the middle most point.
ILLUSTRATION # 1
ILLUSTRATION # 2:
Set of Score is EVEN
ILLUSTRATION # 3:
Two Middle Scores with the same VALUE!
or
X
THE MEDIAN FROM
GROUP DATA
 The median from grouped data in the form of frequency
distribution, the concept is to determine a value such
that 50 % of the observations fall above this value and
the other half below it.
1
Integral Limit
2
Frequency
3
Cumulative Frequency
< >
95-97 2 40 2
92-94 1 38 3
89-91 2 37 5
86-88 2 35 7
83-85 4 33 11
80-82 2 29 13
77-79 2 27 15
74-76 5 25 20
71-73 3 20 23
68-70 1 17 24
65-67 2 16 26
62-64 4 14 30
59-61 4 10 34
56-58 2 6 36
53-55 3 4 39
50-52 1 1 40
Total 40
Table 9.4.
Computation
of the
MEDIAN from
below
(Grouped
Data)
STEPS FOR THE MEDIAN:
Step 1: Estimate the cumulative frequencies as
presented in Column 3.
Step 2: Find N/2, or one-half of the number of cases in the
distribution. In this example 20 or special case because
N/2 is exactly the same with the cumulative frequency
“lesser than” 20
Step 3: Determine the class limit in which the 20th case falls.
the 20th case falls within the class limit 71-73.
Step 4: Compute the median from below by using the formula
(9.6).
X = L+C (N/2-ECf<)
fc
where:
X= the median
L= the lower real limit of the median
class
N= the total number of cases
ECf<= the sum of the cumulative
frequencies “lesser than” up to but
below the median class.
fc = the frequency of the median class
C = the class interval
In the foregoing example, N/2 is 20; Ecf< is 17; fc is 3;
C is 3; and L is 70.5. To substitue formula 9.6.
The median is
X = L+C (N/2-ECf<)
fc
= 70.5+ 3 (20-17)
30
= 70.5+ 3 (3)
3
X = 73.5
Since the data is special case because N/2 is equal to
or the same with the cumulative frequency of 20,
there’s no need of computing it. Just get the upper real
limit of the median class and write special case.
See illustration below.
N/2 = 20
X = 73.5 special case
MEDIAN FROM ABOVE
• Median from above has the same stepws with
median from below, but the upper real limit is
used and getting N/2 starts from above.
• In other word, the ‘greater than’ cumulative
frequency is used.
• The formula is,
X = U-C (N/2-ECf>)
fc
where:
X= the median
U= the upper real limit of the median
class
N= the total number of cases
ECf<= the sum of the cumulative
frequencies “lesser than” up to but
below the median class.
fc = the frequency of the median class
C = the class interval
Table 9.5. Computation of Median
from Above
1
Integral Limit
2
Frequency
3
Cumulative Frequency >
95-97 2 2
92-94 1 3
89-91 2 4
86-88 2 7
83-85 4 11
80-82 2 13
77-79 2 ECf>= 15
74-76 fc =5 20
71-73 3 23
68-70 1 24
65-67 2 26
62-64 4 30
59-61 4 34
56-58 2 36
53-55 3 39
50-52 1 40
Total 40
X = U-C (N/2-ECf>)
fc
X = 76.5-3 (20-15)
5
X = 76.5-3 (5)
5
X = 76.5-3
X = 73.5
U = 76.5
N/2 = 20
Cf = 15
fc =5
N=40
The Mode
 Defined as a value in a set of scores
that occur most frequently.
 Example 1:
8, 7, 5, 10, 5, 7, 13, 14, 5, 11, 13,
5,and 15
The most frequent score is 5 because it appears
four times, thus, this is the mode.
 Example 2:
10,10,11,11,12,12,14,14,15,15,16,16,1
8,18,19,19,20 and 20.
All scores appear with a frequency of 2, hence,
no modal class can be obtained
 Example 3:
32,33,34,35,37,40,41,42,43,44,47,48,
49,50, and 53.
No Modal Value can be calculated because not
one of these scores is repeated and they have
the same frequency of 1.
The Mode from Ungrouped Data
 Mode can be easily calculated by
inspection.
 It is classified into;
 Unimodal
 Bimodal
 Trimodal
 Polymodal
UNIMODAL = there is only one modal value.
Ex. 9,10,8,4,12,7,7,14,15,9,3,19,7,20,7,21,23, and
25
The mode here is 7 because the only score having the highest
Frequency for it appears four times where as the rest appear
Twice or once.
BIMODAL = there has two modes.
Ex. 14,15,16,17,18,18,19,19,19,20,20,21,22,23,23,23,24,
and 25
The modes are 19 and 23 because they have highest frequency in
a set. They appear three times or having a frequency of 3.
TRIMODAL = there has three modes in a set of scores.
Ex.
44,45,47,47,47,50,51,52,52,52,53,53,54,55,55,55,57,57,58 &
60 There are three modes becuase the three scores have the highest
frequency. Here the modes are 47,52,55.
POLYMODAL= the modes are four or more in a set of scores.
The Mode from Grouped Data
• When data are grouped in the form of frequency
distribution, the modal class is found in a class lim
having the highest frequency.
To obtain the mode from grouped data:
X = Lmo + C/2 ( f1-f2 )
2f0-f2-f1
where:
X= Mode
Lmo= Lower real limit of the modal
class
C= class interval
f1 = Frequency of the class after the
modal class
f2 = Frequency of the class before the
modal class
f0 = Frequency of the modal class
Table 9.6 Computation of the Mode from Grouped Data
Integral Limit Frequency
95-97 2
92-94 1
89-91 2
86-88 2
83-85 4
80-82 2
77-79 2
74-76 5
71-73 3
68-70 1
65-67 2
62-64 4
59-61 4
56-58 2
53-55 3
50-52 1
Total 40
Lmo = 73.5
C= 3
f1= 3
f2 = 2
f0 = 5
X = Lmo + C/2 ( f1-f2 )
2f0-f2-f1
= 73.5 + 1.5 ( 3-2 )
2(5)-2-3
= 73.5 + 1.5 ( 1 )
10-5
= 73.5 + ( 1.5 )
5
= 73.5 + 0.3
X = 73.8
Computer Test Results show that
the mean is 72.6; median, 73.5; and
mode, 73.8.
THANK
YOU ^_^

Median and Mode used in Teaching

  • 2.
     Another measureof central tendency that is commonly used by by class room teachers.  Defined as a point on scale such that scores above or below lie 50 % of the cases. THE MEDIAN FROM UNGROUPED The median of a set ungrouped data is obtained by computing the midpoints of the two middle scores when the set of score is even. When the set of scores is odd, pick out the middle most point.
  • 3.
  • 4.
    ILLUSTRATION # 2: Setof Score is EVEN
  • 5.
    ILLUSTRATION # 3: TwoMiddle Scores with the same VALUE! or X
  • 6.
    THE MEDIAN FROM GROUPDATA  The median from grouped data in the form of frequency distribution, the concept is to determine a value such that 50 % of the observations fall above this value and the other half below it.
  • 7.
    1 Integral Limit 2 Frequency 3 Cumulative Frequency <> 95-97 2 40 2 92-94 1 38 3 89-91 2 37 5 86-88 2 35 7 83-85 4 33 11 80-82 2 29 13 77-79 2 27 15 74-76 5 25 20 71-73 3 20 23 68-70 1 17 24 65-67 2 16 26 62-64 4 14 30 59-61 4 10 34 56-58 2 6 36 53-55 3 4 39 50-52 1 1 40 Total 40 Table 9.4. Computation of the MEDIAN from below (Grouped Data)
  • 8.
    STEPS FOR THEMEDIAN: Step 1: Estimate the cumulative frequencies as presented in Column 3. Step 2: Find N/2, or one-half of the number of cases in the distribution. In this example 20 or special case because N/2 is exactly the same with the cumulative frequency “lesser than” 20 Step 3: Determine the class limit in which the 20th case falls. the 20th case falls within the class limit 71-73. Step 4: Compute the median from below by using the formula (9.6). X = L+C (N/2-ECf<) fc
  • 9.
    where: X= the median L=the lower real limit of the median class N= the total number of cases ECf<= the sum of the cumulative frequencies “lesser than” up to but below the median class. fc = the frequency of the median class C = the class interval
  • 10.
    In the foregoingexample, N/2 is 20; Ecf< is 17; fc is 3; C is 3; and L is 70.5. To substitue formula 9.6. The median is X = L+C (N/2-ECf<) fc = 70.5+ 3 (20-17) 30 = 70.5+ 3 (3) 3 X = 73.5
  • 11.
    Since the datais special case because N/2 is equal to or the same with the cumulative frequency of 20, there’s no need of computing it. Just get the upper real limit of the median class and write special case. See illustration below. N/2 = 20 X = 73.5 special case
  • 12.
    MEDIAN FROM ABOVE •Median from above has the same stepws with median from below, but the upper real limit is used and getting N/2 starts from above. • In other word, the ‘greater than’ cumulative frequency is used. • The formula is, X = U-C (N/2-ECf>) fc
  • 13.
    where: X= the median U=the upper real limit of the median class N= the total number of cases ECf<= the sum of the cumulative frequencies “lesser than” up to but below the median class. fc = the frequency of the median class C = the class interval
  • 14.
    Table 9.5. Computationof Median from Above 1 Integral Limit 2 Frequency 3 Cumulative Frequency > 95-97 2 2 92-94 1 3 89-91 2 4 86-88 2 7 83-85 4 11 80-82 2 13 77-79 2 ECf>= 15 74-76 fc =5 20 71-73 3 23 68-70 1 24 65-67 2 26 62-64 4 30 59-61 4 34 56-58 2 36 53-55 3 39 50-52 1 40 Total 40
  • 15.
    X = U-C(N/2-ECf>) fc X = 76.5-3 (20-15) 5 X = 76.5-3 (5) 5 X = 76.5-3 X = 73.5 U = 76.5 N/2 = 20 Cf = 15 fc =5 N=40
  • 16.
    The Mode  Definedas a value in a set of scores that occur most frequently.  Example 1: 8, 7, 5, 10, 5, 7, 13, 14, 5, 11, 13, 5,and 15 The most frequent score is 5 because it appears four times, thus, this is the mode.
  • 17.
     Example 2: 10,10,11,11,12,12,14,14,15,15,16,16,1 8,18,19,19,20and 20. All scores appear with a frequency of 2, hence, no modal class can be obtained  Example 3: 32,33,34,35,37,40,41,42,43,44,47,48, 49,50, and 53. No Modal Value can be calculated because not one of these scores is repeated and they have the same frequency of 1.
  • 18.
    The Mode fromUngrouped Data  Mode can be easily calculated by inspection.  It is classified into;  Unimodal  Bimodal  Trimodal  Polymodal UNIMODAL = there is only one modal value. Ex. 9,10,8,4,12,7,7,14,15,9,3,19,7,20,7,21,23, and 25 The mode here is 7 because the only score having the highest Frequency for it appears four times where as the rest appear Twice or once.
  • 19.
    BIMODAL = therehas two modes. Ex. 14,15,16,17,18,18,19,19,19,20,20,21,22,23,23,23,24, and 25 The modes are 19 and 23 because they have highest frequency in a set. They appear three times or having a frequency of 3. TRIMODAL = there has three modes in a set of scores. Ex. 44,45,47,47,47,50,51,52,52,52,53,53,54,55,55,55,57,57,58 & 60 There are three modes becuase the three scores have the highest frequency. Here the modes are 47,52,55. POLYMODAL= the modes are four or more in a set of scores.
  • 20.
    The Mode fromGrouped Data • When data are grouped in the form of frequency distribution, the modal class is found in a class lim having the highest frequency. To obtain the mode from grouped data: X = Lmo + C/2 ( f1-f2 ) 2f0-f2-f1
  • 21.
    where: X= Mode Lmo= Lowerreal limit of the modal class C= class interval f1 = Frequency of the class after the modal class f2 = Frequency of the class before the modal class f0 = Frequency of the modal class
  • 22.
    Table 9.6 Computationof the Mode from Grouped Data Integral Limit Frequency 95-97 2 92-94 1 89-91 2 86-88 2 83-85 4 80-82 2 77-79 2 74-76 5 71-73 3 68-70 1 65-67 2 62-64 4 59-61 4 56-58 2 53-55 3 50-52 1 Total 40 Lmo = 73.5 C= 3 f1= 3 f2 = 2 f0 = 5
  • 23.
    X = Lmo+ C/2 ( f1-f2 ) 2f0-f2-f1 = 73.5 + 1.5 ( 3-2 ) 2(5)-2-3 = 73.5 + 1.5 ( 1 ) 10-5 = 73.5 + ( 1.5 ) 5 = 73.5 + 0.3 X = 73.8 Computer Test Results show that the mean is 72.6; median, 73.5; and mode, 73.8.
  • 24.