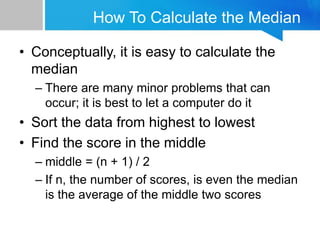
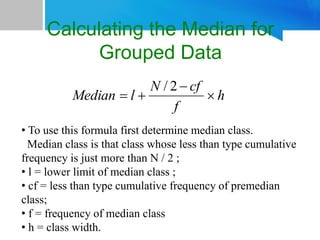
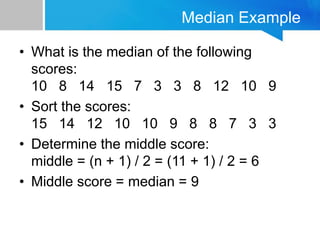
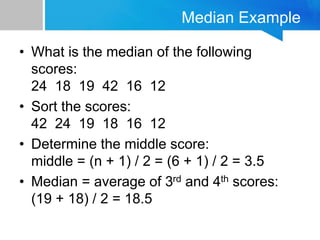
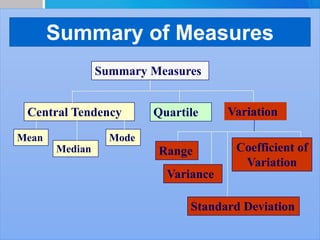
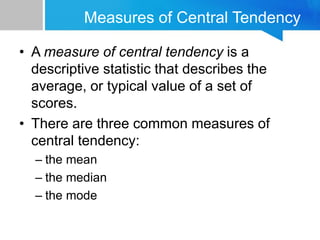
This document provides information about various measures of central tendency including the mean, median, and mode. It defines each measure and provides examples of how to calculate them using both raw data and grouped data. The mean is the average value and can be influenced by outliers. The median is the middle value and is not affected by outliers. The mode is the most frequent value. Each measure is suited for certain types of data distributions and the document discusses when each should be used.


![Find the mean of the following data:
Mean =
[3(10)+10(9)+9(8)+8(7)+10(6)+
2(5)]/42 = 7.57
Score Number of
students
10 3
9 10
8 9
7 8
6 10
5 2
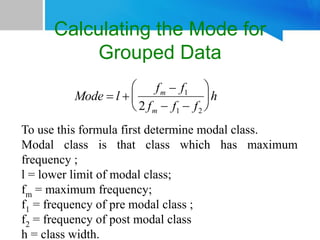
Calculating the Mean for Grouped Data](https://image.slidesharecdn.com/measuresinstatistics-231128133322-213dddc5/85/Measures-in-Statistics-kjc-pptx-7-320.jpg)