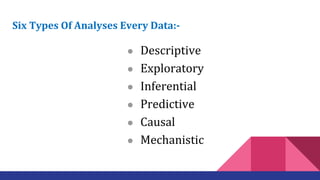
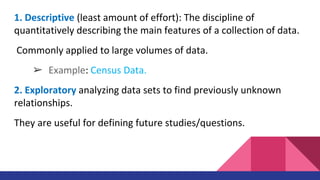
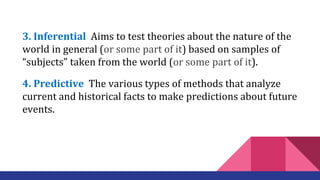
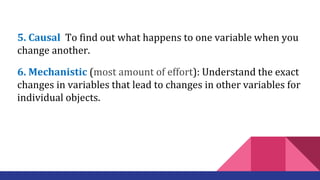
This document discusses analyzing and summarizing data. It defines key terms like data, variables, and different types of data including quantitative, qualitative, discrete, and continuous data. It also discusses different types of data analysis including descriptive, exploratory, inferential, predictive, causal, and mechanistic. Finally, it explains measures of central tendency including the mean, median, and mode. It provides examples and formulas for calculating each as well as their advantages and disadvantages.
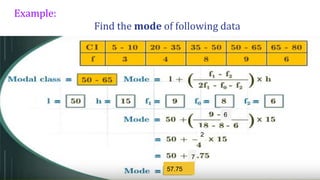
2. Objectives:
1 - Define the Data.
2 - Analyze the Data.
3 - Explain the types of Data.
4 - Number the measures of the central
tendency.
5 - Charts of tables.
6 - Explain How changing the Data will affect
the central tendency.
3. Definition of Data.
Statistics: is the science of collecting, organizing, analyzing and
interpreting Data.
*It’s all about Data.
Variables: Characteristic or condition that has different values.
4. Data: Measurements or observation of Variable.
Example:-
When a nurse weight a patient (measurement)
5. Data analysis
Analysis of data is a process of inspecting, cleansing,
transforming, and modeling data with the goal of discovering
useful information, suggesting conclusions, and supporting
decision-making.
6. Six Types Of Analyses Every Data:-
● Descriptive
● Exploratory
● Inferential
● Predictive
● Causal
● Mechanistic
7. 1. Descriptive (least amount of effort): The discipline of
quantitatively describing the main features of a collection of data.
Commonly applied to large volumes of data.
➢ Example: Census Data.
2. Exploratory analyzing data sets to find previously unknown
relationships.
They are useful for defining future studies/questions.
8. 3. Inferential Aims to test theories about the nature of the
world in general (or some part of it) based on samples of
“subjects” taken from the world (or some part of it).
4. Predictive The various types of methods that analyze
current and historical facts to make predictions about future
events.
9. 5. Causal To find out what happens to one variable when you
change another.
6. Mechanistic (most amount of effort): Understand the exact
changes in variables that lead to changes in other variables for
individual objects.
10. The process of data analysis
● Analysis refers to breaking a whole into its separate
components for individual examination.
● Data analysis is a process for obtaining raw data and
converting it into information useful for decision-
making by users.
12. Quantitative Data (Numerical data)
These data have meaning as a measurement, such as a person’s
height, weight, IQ, or blood pressure;
Or they’re a count, such as the number of stock shares a person
owns, how many teeth a child has, or how many pages you can
read of your favorite book before you fall asleep.
13. Numerical data can be further broken into
two types:
Discrete data Continuous data
14. Discrete data
● Represent items that can be counted; they take on possible
values that can be listed out.
● The list of possible values may be fixed (also called finite); or
it may go from 0, 1, 2, on to infinity (making it countably
infinite).
15. Discrete data
Example: the number of students in a class (you can't have half
a student).
Example: the results of rolling 2 dice; can only have the values
2, 3, 4, 5, 6, 7, 8, 9, 10, 11 and 12.
16. Continuous data
● Represent measurements.
● Their possible values cannot be counted and can only be
described using intervals on the real number line.
● In this way, continuous data can be thought of as being
unaccountably infinite.
● For ease of recordkeeping, statisticians usually pick some
point in the number to round off.
17. Continuous data
Examples:
● A person's height: could be any value (within the range
of human heights), not just certain fixed heights.
● Time in a race: you could even measure it to fractions of
a second.
● A dog's weight.
● The length of a leaf.
18. QUALITATIVE DATA
Qualitative data deals with characteristics and descriptors that can't be easily
measured, but can be observed subjectively—such as smells, tastes, textures,
attractiveness, and color.
The objects being studied are grouped into categories based on some
qualitative trait.
The resulting data are merely labels or categories.
19. There are three main kinds of qualitative data.
NOMINAL (unordered)
A type of categorical data in which objects fall into unordered categories.
Examples
Hair color – blonde, brown, red, black, etc.
Race – Caucasian African American, Asian, etc.
20. ORDINAL DATA
A type of categorical data in which order is important. Ordinal scales are typically
measures of non-numeric concepts like satisfaction, happiness, discomfort, etc.
example
Take a look at the example below. In each case, we know that a #4 is better than a #3 or #2, but we don’t
know–and cannot quantify–how much better it is
21. BINARY DATA
A type of categorical data in which there are only two categories.
Binary data can either be nominal or ordinal
Binary data place things in one of two mutually exclusive categories:
Example
right/wrong, true/false, or accept/reject
23. Mean: is the average of the numbers
(a calculated "central" value of a set of
numbers).
➢ The Mean
24. To calculate: Just add up all the numbers, then divide by how many
numbers there are.
The Formula:
Mean for Ungrouped Data
25. To calculate: we formulate the midpoint of each age interval and
then format the FX table.
To get the mean: divide the total sum of the FX points by the total
sum of the given frequency.
The Formula:
Mean for Grouped Data
26. Advantages of mean
1. Easy to compute and interpret.
2. Generally the best measure of central location.
3. For a given set of data there is one and only one mean.
27. Disadvantages of mean
1. It cannot be used with qualitative variables.
2. It is affected by the extreme observation.
28. The median is the halfway point in a data set. Before you can find this
point, the data must be arranged in an increasing order. When the
data set is ordered, it is called a data array.
The median either will be a specific value in the data set or will fall
between two values, as shown in the next examples.
The median is the midpoint of the data array. The symbol for the
median is MD.
➢ The Median
29.
30. Finding the Median of an Ungrouped data
Step 1: Arrange the data values in ascending order.
Step 2: Determine the number of values in the data set.(n)
Step 3:
a. If n is odd, select the middle data value as the median.
… Or use this formula, Median = ( )th value.
b. If n is even, find the mean of the two middle values. That is, add them
……… and divide the sum by 2.
Or use this formula, Median =
31. Example 1
police officers killed
The number of police officers killed in the line of duty over the
last 11 years is shown . Find the median
177, 153, 141, 189, 155, 122, 162, 165, 149, 157, 240
32. Solution
Step 1 : arrange the data in ascending order
122,141,149,153,155,157,162,165,177,189,240
Step 2 : there are an odd number of data values , namely ,11. (n=11)
Step 3 : select the middle data value .
122, 141, 149, 153, 155, 157 , 162, 165, 177, 189, 240
The median number of police officers killed for the 11 year period is 157
Median
33. Example 2
Tornadoes in United States
The number of Tornadoes that have occurred in the United
State over an 8 years period follows . Find the median
684,764,656,702,856,1133,1132,1303
34. Solution
Step 1 : arrange the data in ascending order
656 , 684 , 702 , 764 , 856 , 1132 , 1133 , 1303
Step 2 : there are an even number of data values , namely ,8. (n=8)
Step 3 : the middle two data values are 764 and 856 .
656 , 684 , 702 , 764 , 856 , 1132 , 1133 , 1303
Median
● Since the middle point falls halfway between 764 and 856 , find the
median (MD) by adding the two values and dividing by 2 .
MD = (764 + 856 )/2 = 1620 / 2 = 810
The median number of tornadoes is 810 .
35. Step 1: Construct the cumulative frequency distribution.
Step 2: Decide the class that contain the median.
…… … Class Median is the first class with the value of cumulative frequency
…… … equal at least n/2.
Step 3: Find the median by using the following formula:
Finding the Median of a Grouped Data
Median =
39. Therefore,
Median =
● Thus, 25 persons take less than 23.75 minutes to study.
And another 25 persons take more than 23.75 23.75minutes
to study.
40. The advantages of Median
1. The median is used to find the center or middle value of a data set.
2. The median is used when it is necessary to find out whether the data values fall into
the upper half or lower half of the distribution.
3. The median is used for an open-ended distribution.
4. The median is affected less than the mean by extremely high or extremely low
values.
41. The disadvantages of Median
1. It does not take into account the precise value of each observation and hence
does not use all information available in the data.
2. Unlike mean, median is not amenable to further mathematical calculation and
hence is not used in many statistical tests.
3. If we pool the observations of two groups, median of the pooled group cannot be
expressed in terms of the individual medians of the pooled groups.
43. Finding the Mode
To find the mode, or modal value,
First put the numbers in order.
Second count how many of each number. (the
number that appears most often is the mode).
44. Example:
3, 7, 5, 13, 20, 23, 29, 23, 40, 23, 14, 12, 56, 23, 29
In order these numbers are:
3, 5, 7, 12, 13, 14, 20, 23, 23, 23, 23, 29, 29, 40, 56
This makes it easy to see which numbers appear most often.
In this case the mode is 23.
45. Another Example:
{19, 8, 29, 35, 19, 28, 15}
Arrange them in order: {8, 15, 19, 19, 28, 29, 35}
19 appears twice, all the rest appear only once, so 19 is
the mode.
How to remember? Think "mode is most"
46. More Than One Mode
We can have more than one mode.
Example:
{1, 3, 3, 3, 4, 4, 6, 6, 6, 9}
3 appears three times, as does 6.
So there are two modes: at 3 and 6
●Having two modes is called "bimodal".
●Having more than two modes is called
"multimodal".
47. Grouping
When all values appear the same number of times
the idea of a mode is not useful. But we could
group them to see if one group has more than the
others.
48. Grouping also helps to find what the typical values are when the real world
messes things up!
Example: How long to fill a pallet?
Philip recorded how long it takes to fill a pallet in minutes:
{35, 36, 32, 42, 58, 56, 35, 39, 46, 47, 34, 37}
49. It takes longer if there is break time or lunch so an average is not
very useful.
But grouping by 5s gives:
30 - 34 : 2
35 - 39 : 5
40 - 44 : 1
45 - 49 : 2
50 - 54 : 0
54 - 59 : 2
"35-39" appear most often, so we can say it
normally takes about 37 minutes to fill a pallet.
50. Example:
Find the mode in the following data?
The most common one is “7” in 15-20
We can say that the mode is about 18
51. Finding the mode
Here,
l = lower limit of modal class
f1 = frequency of modal class
fo = frequency of class preceding the modal class.
f2 = frequency of class succeeding the modal class
h = size of class interval.
55. Mean For Grouped Data.
Mean = X’ = ∑ fX / ∑f
Where,
f = frequency of each class
X =midpoint of each class
∑ fX = Summation of f1X1+f2X2+.....fnXn
56. Mode for Grouped Data (class intervals).
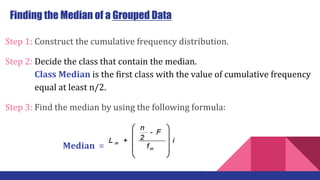
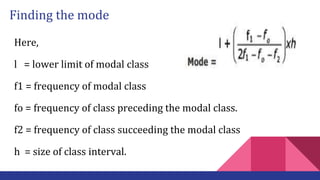
Mode = l + [ fm – f1 / (fm – f1 ) + (fm - f2 )] x i
l = lower limit of modal class
fm = frequency of modal class
f1 = frequency of preceding class to modal class
f2 = frequency of the succeeding class to the modal class
i = size of the modal class
57. How data affects measure of central tendency
Measure of central tendency can be affected by
1. Outliers
2. Skewness
3. Types of data
58. Outliers
Sometimes there are extreme values that are separated from the rest of the
data. These extreme values are called outliers. Outliers affect the mean.
● It is better to use median or mode if a data has an outlier value as it affects
the mean highly.
● It is advised to either eliminate an outlier and use a trimmed mean* if mean
average is to be calculated on such data.
59. Skewness
In symmetrical distributions, the median and mean are equal
For normal distributions, mean = median = mode
In positively skewed distributions, the mean is greater than the median
In negatively skewed distributions, the mean is smaller than the median
It is better to use median if the date is skewed positively or negatively
because it can effect mode and mean.
60. Type of data and their use
For nominal data, mode should be used.
For ordinal data, and skewed interval data, median should be used.
For unskewd interval data and continuous data, mean should be used