Measures of centraltendency are statistical values that
represent the center or typical value of a dataset.
▪The three main measures of central tendency are:
1. Mean – the arithmetic average of a set of numbers,
calculated by summing all values and dividing by the
number of observations.
2. Median – the middle value of an ordered dataset.
➢If the number of observations is odd, the median is the
middle number.
➢If even, it is the average of the two middle numbers.
4.
3. Mode –the most frequently occurring value in a
dataset.
➢A dataset may have no mode, one mode (unimodal), or
multiple modes (bimodal or multimodal).
5.
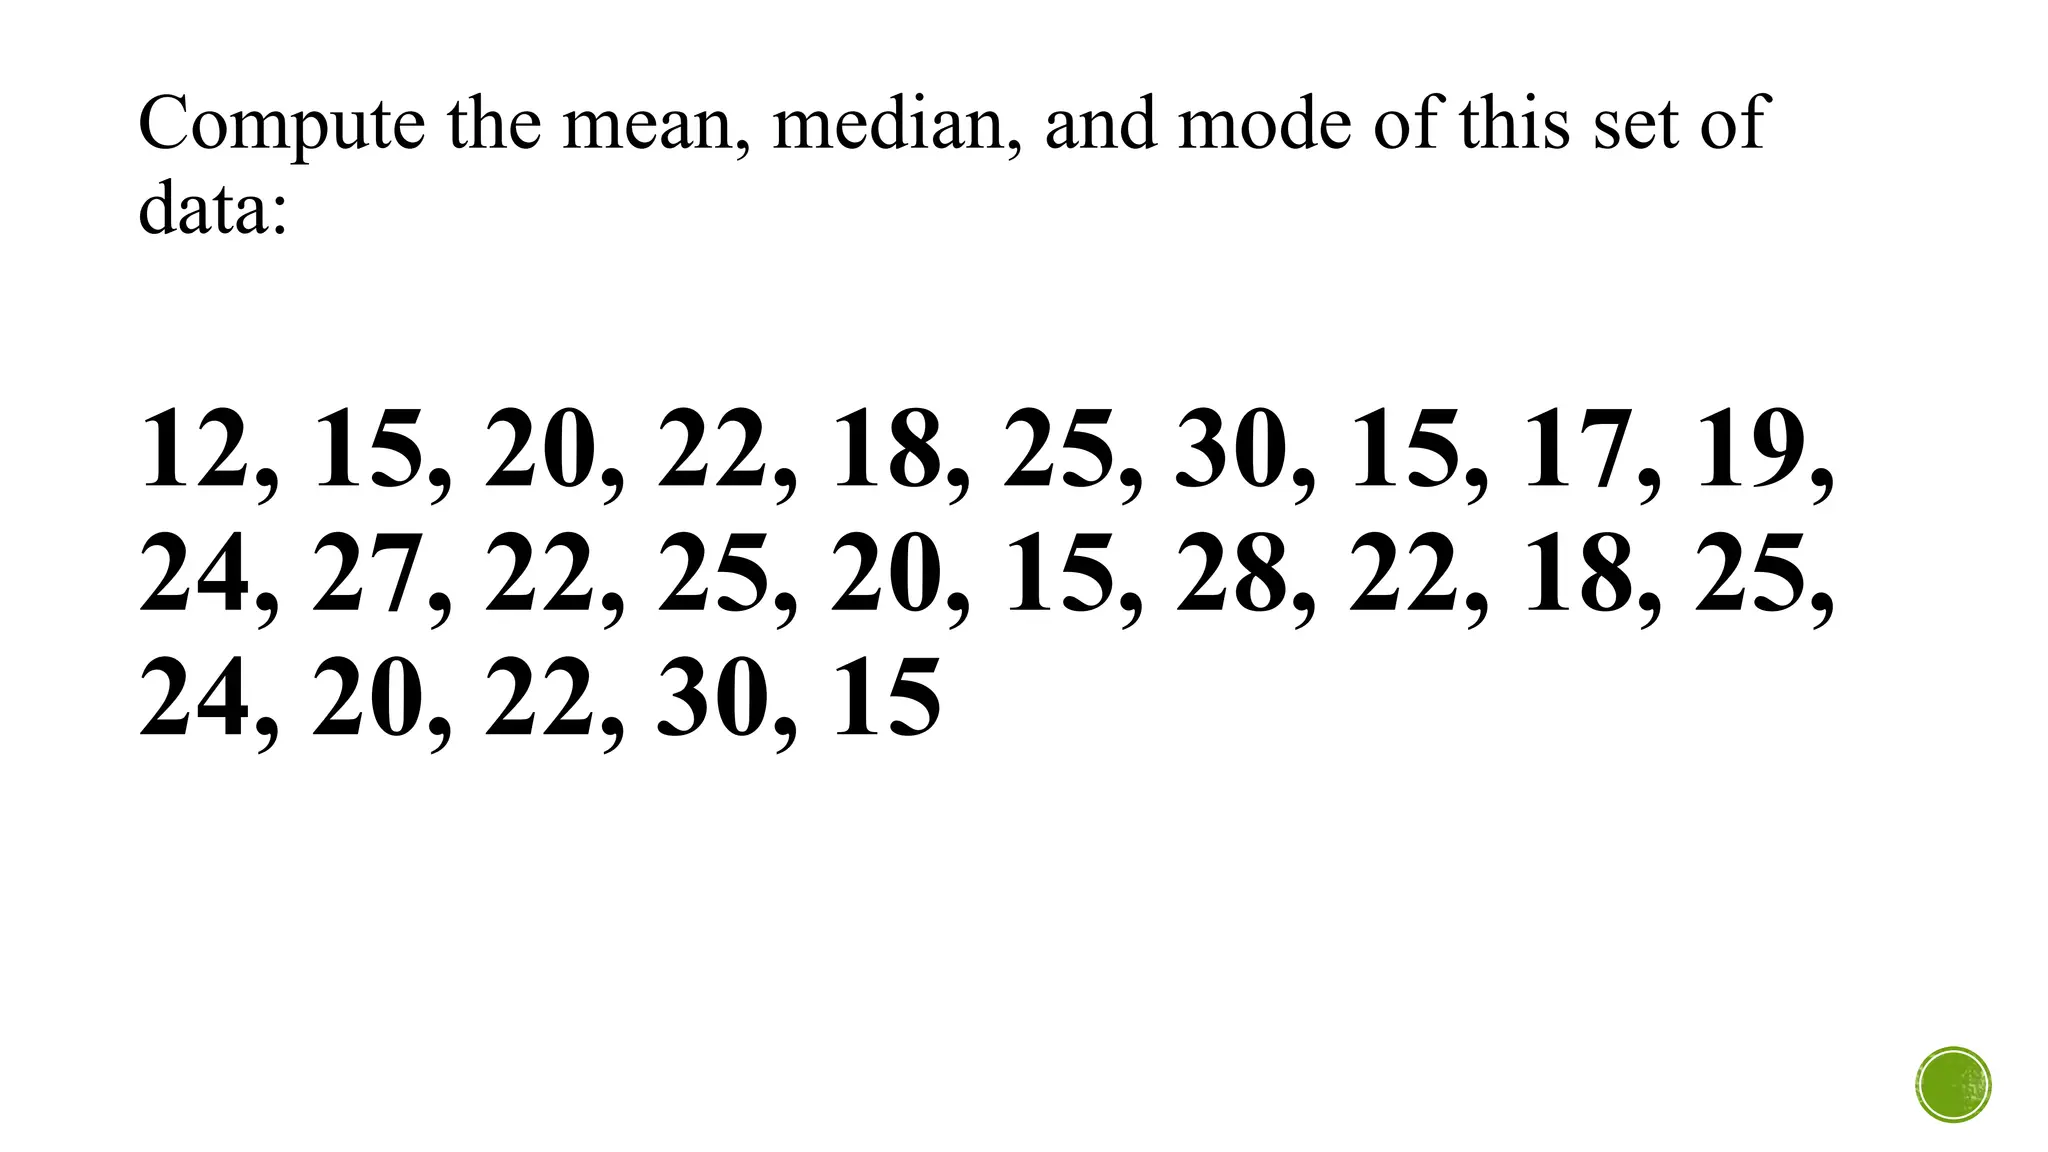
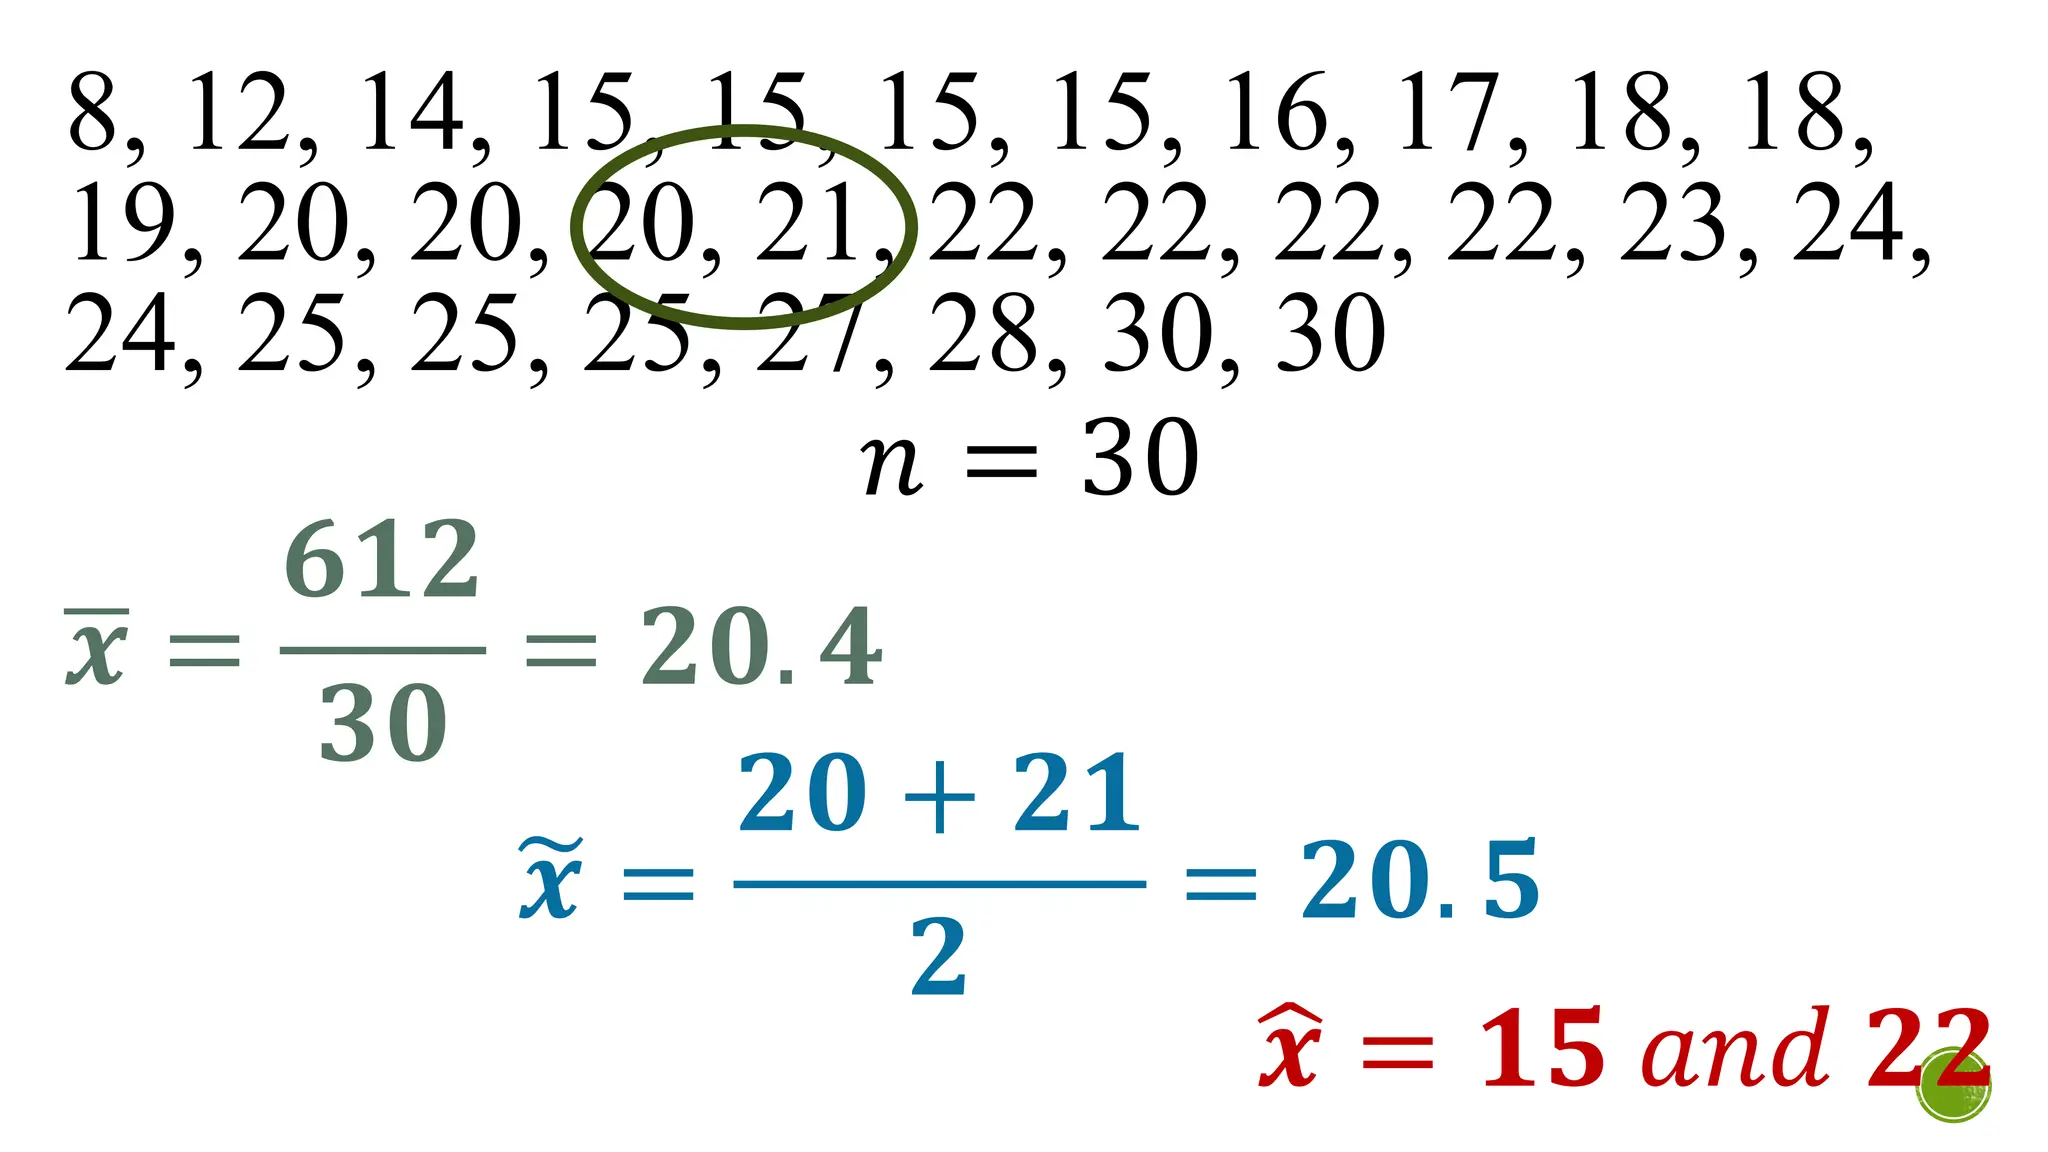
Compute the mean,median, and mode of this set of
data:
12, 15, 20, 22, 18, 25, 30, 15, 17, 19,
24, 27, 22, 25, 20, 15, 28, 22, 18, 25,
24, 20, 22, 30, 15
Measures of variabilityare statistical tools used to
describe the spread or dispersion of data points in a
dataset.
▪ It indicates how much the values in a dataset differ
from the mean or from each other.
▪ High variability means the data points are widely
spread, while low variability means they are closely
clustered around the mean.
9.
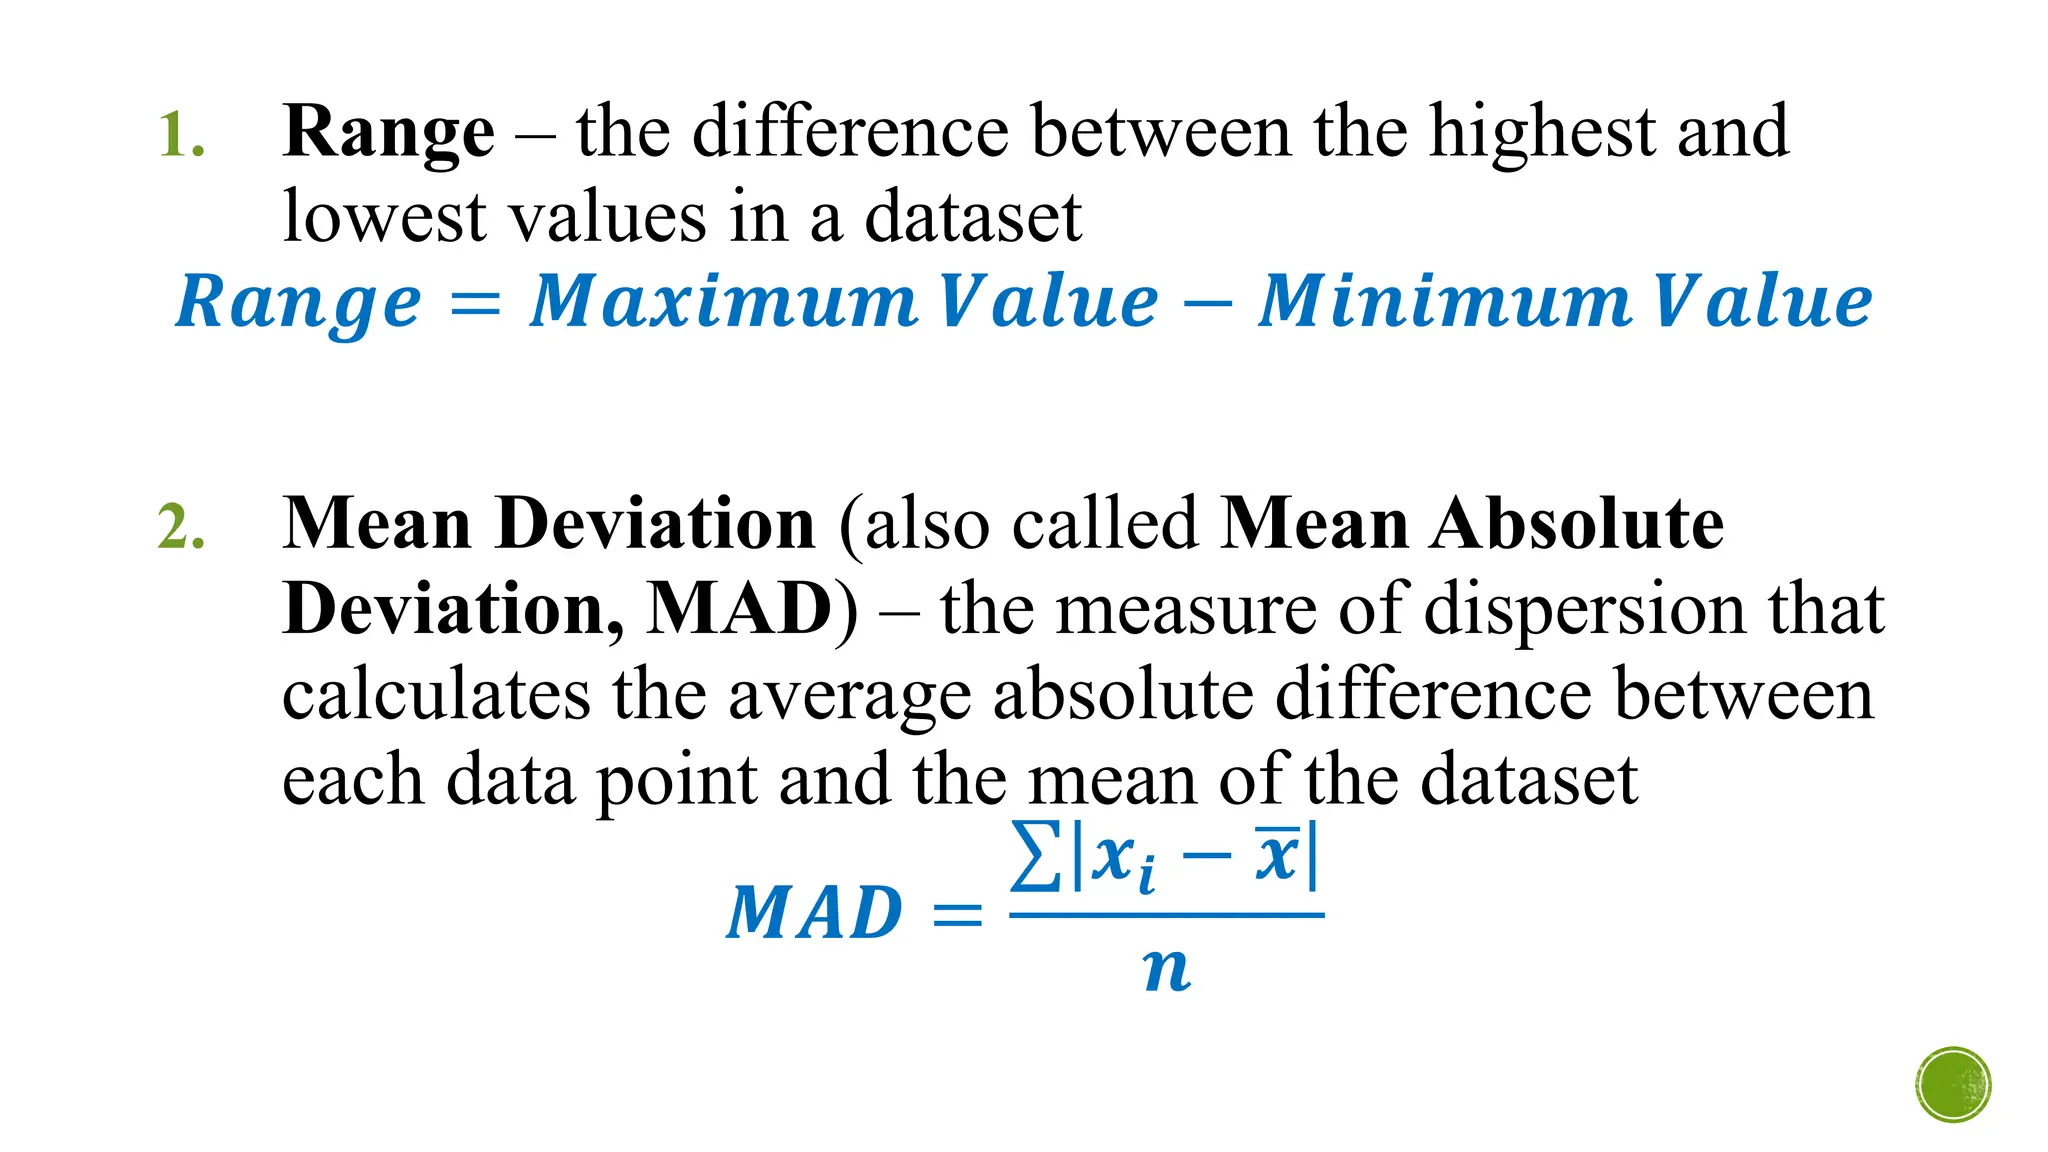
1. Range –the difference between the highest and
lowest values in a dataset
𝑹𝒂𝒏𝒈𝒆 = 𝑴𝒂𝒙𝒊𝒎𝒖𝒎 𝑽𝒂𝒍𝒖𝒆 − 𝑴𝒊𝒏𝒊𝒎𝒖𝒎 𝑽𝒂𝒍𝒖𝒆
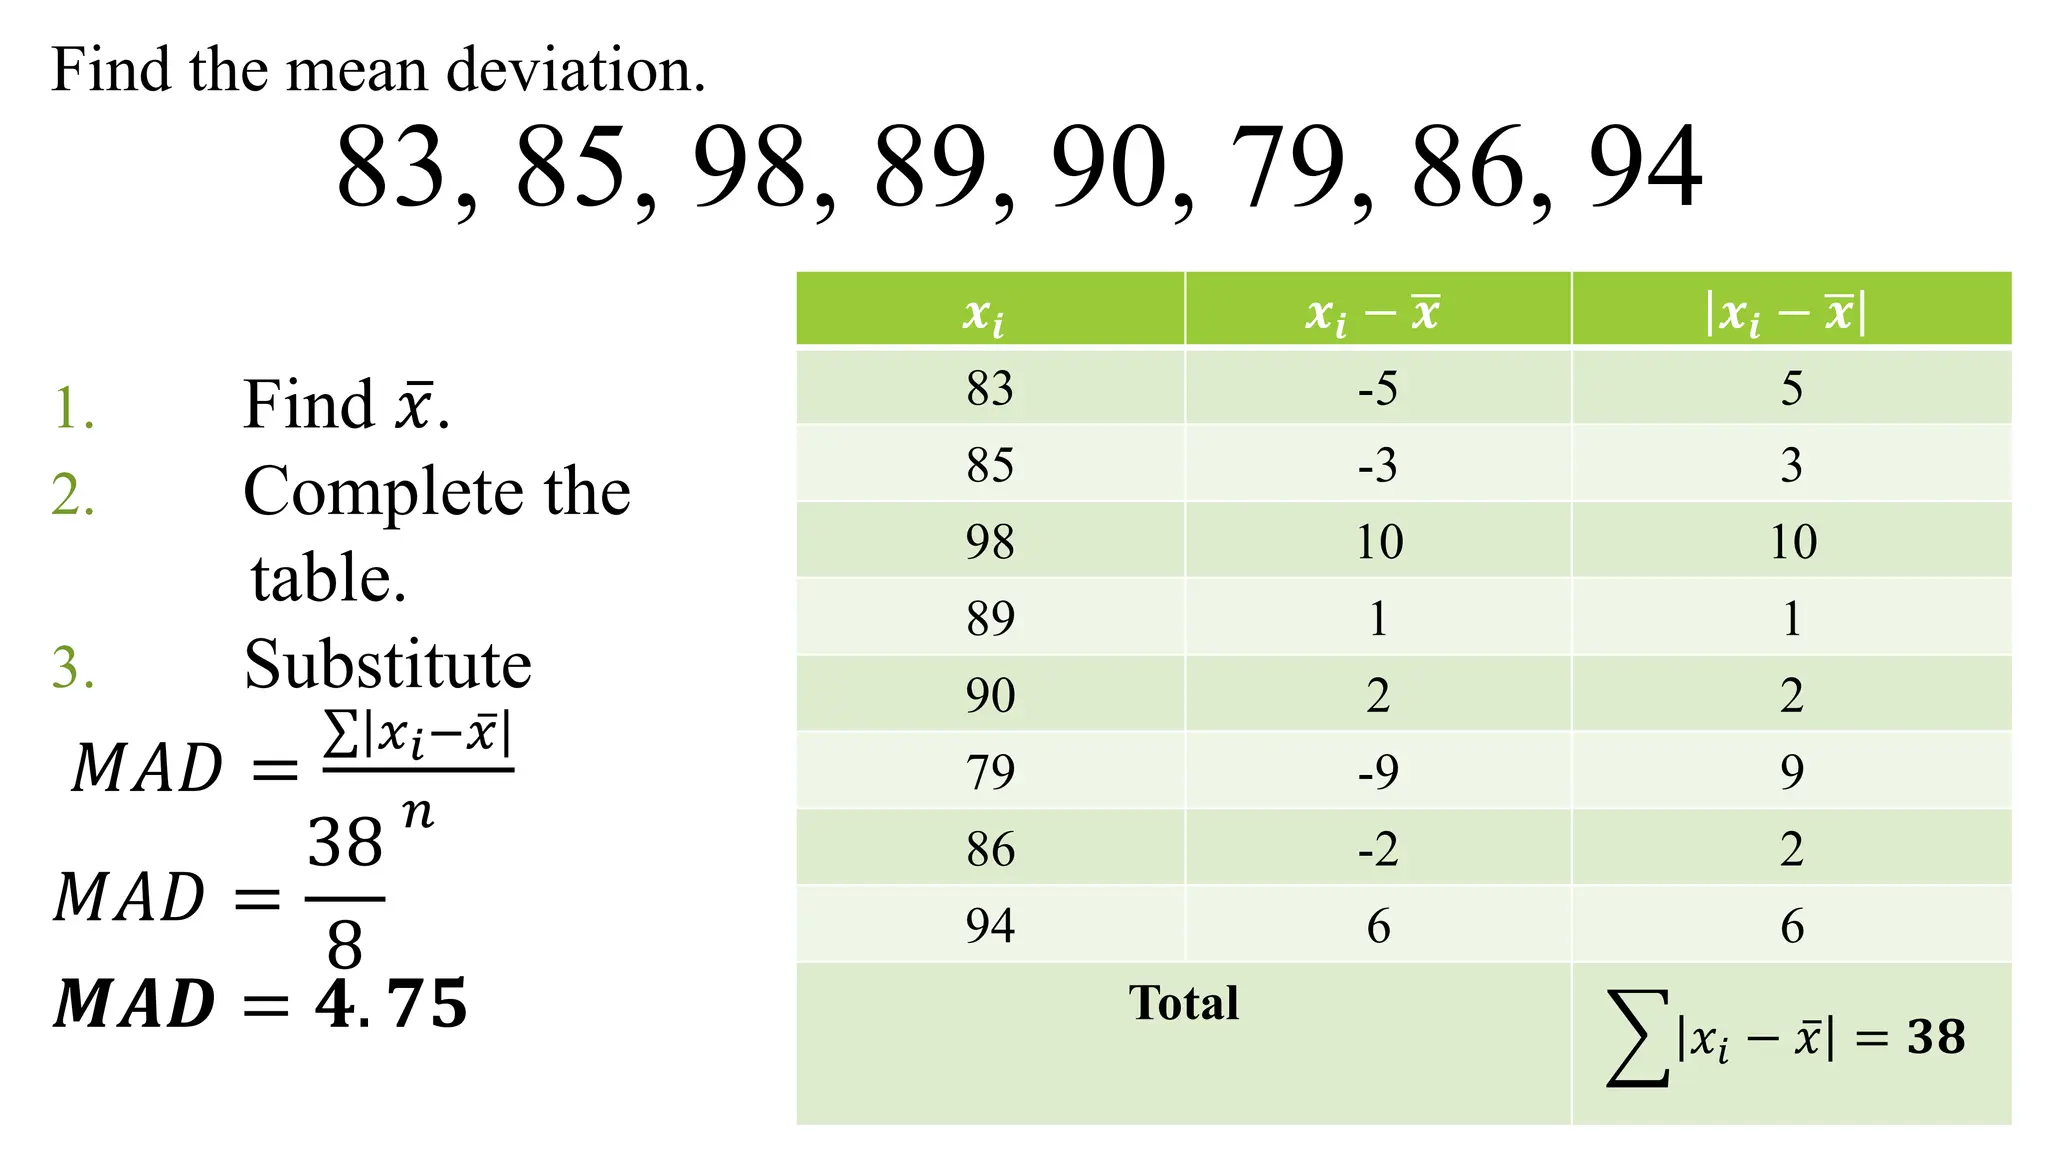
2. Mean Deviation (also called Mean Absolute
Deviation, MAD) – the measure of dispersion that
calculates the average absolute difference between
each data point and the mean of the dataset
𝑴𝑨𝑫 =
σ 𝒙𝒊 − ഥ
𝒙
𝒏
10.
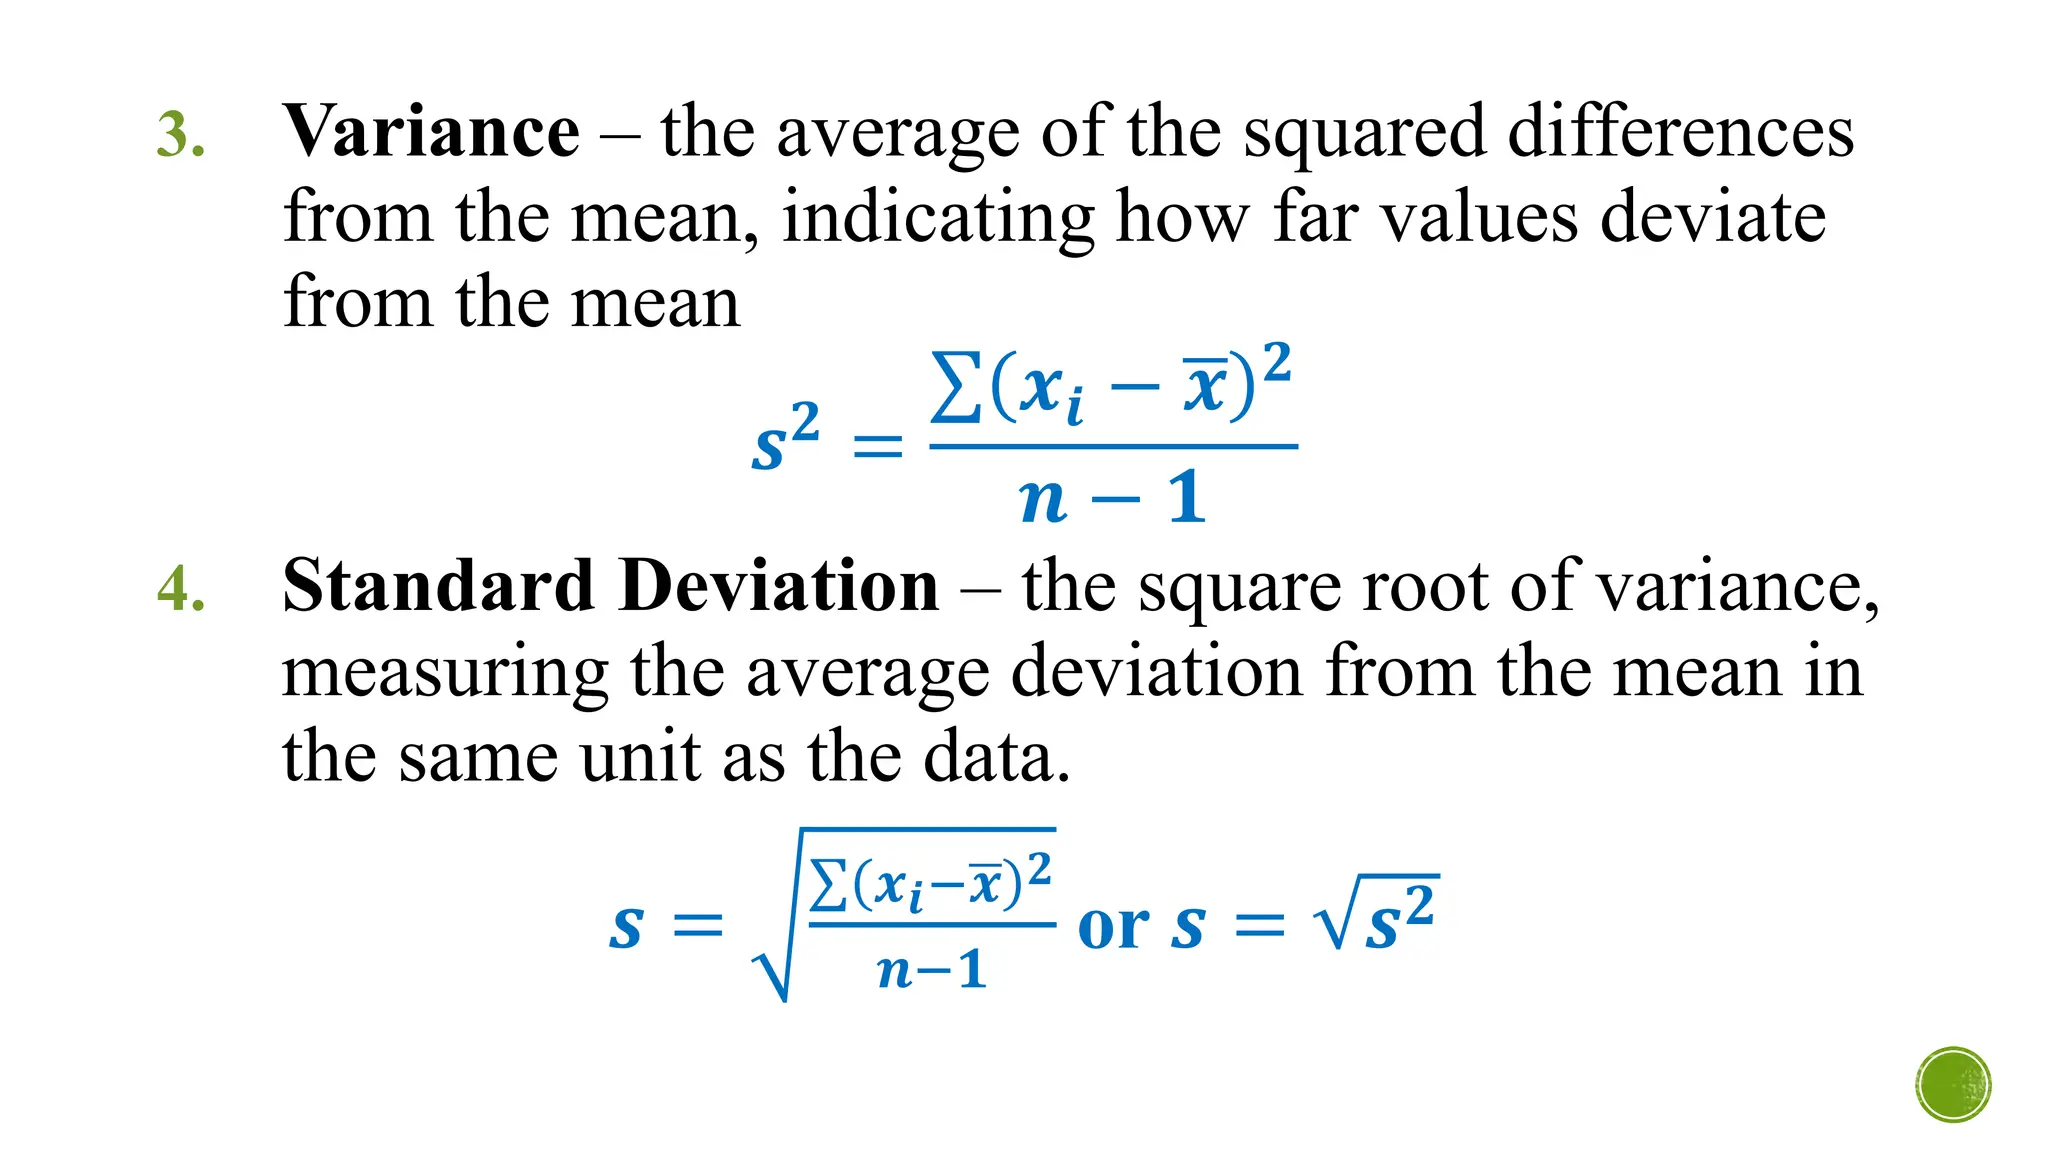
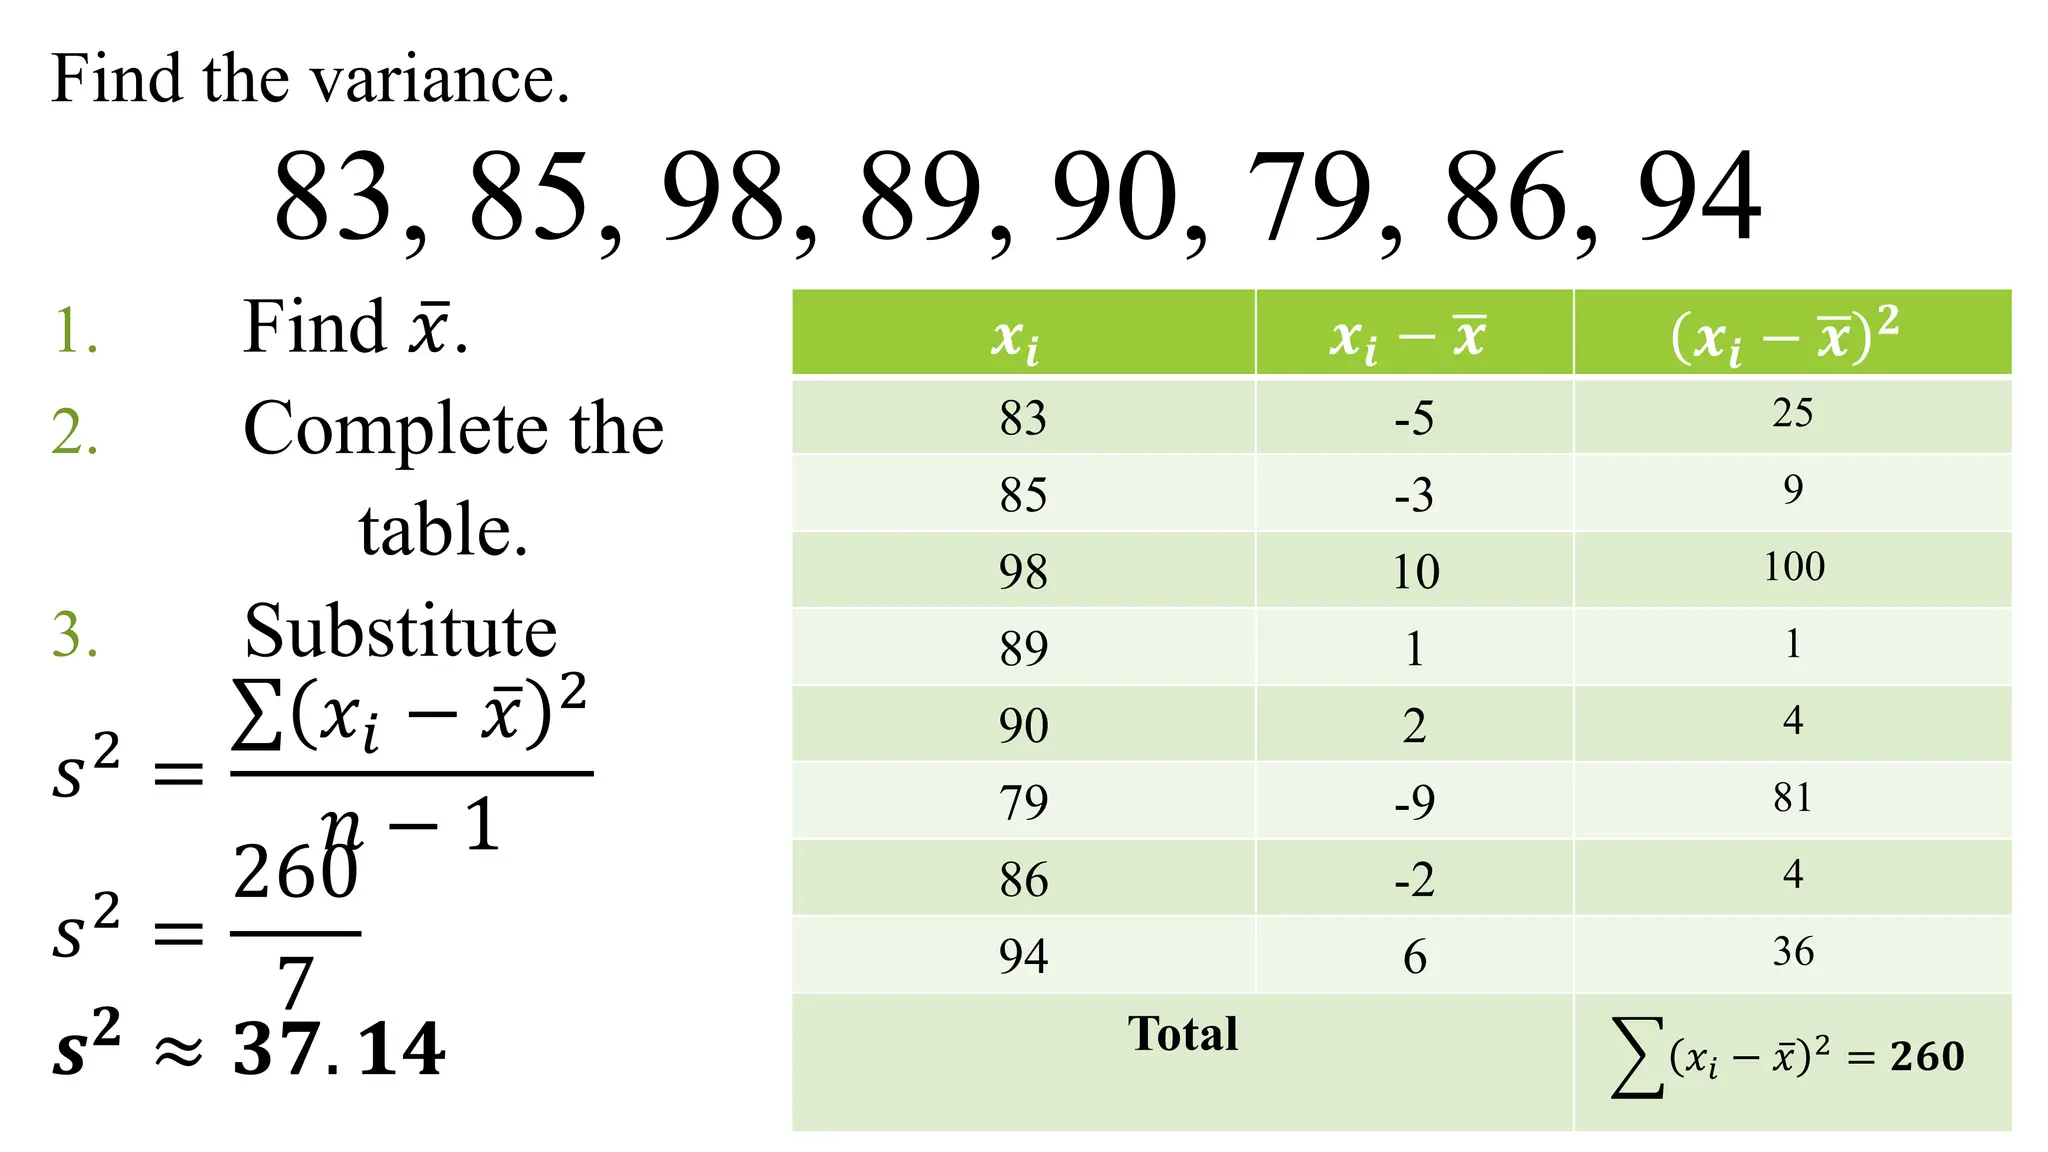
3. Variance –the average of the squared differences
from the mean, indicating how far values deviate
from the mean
𝒔𝟐
=
σ 𝒙𝒊 − ഥ
𝒙 𝟐
𝒏 − 𝟏
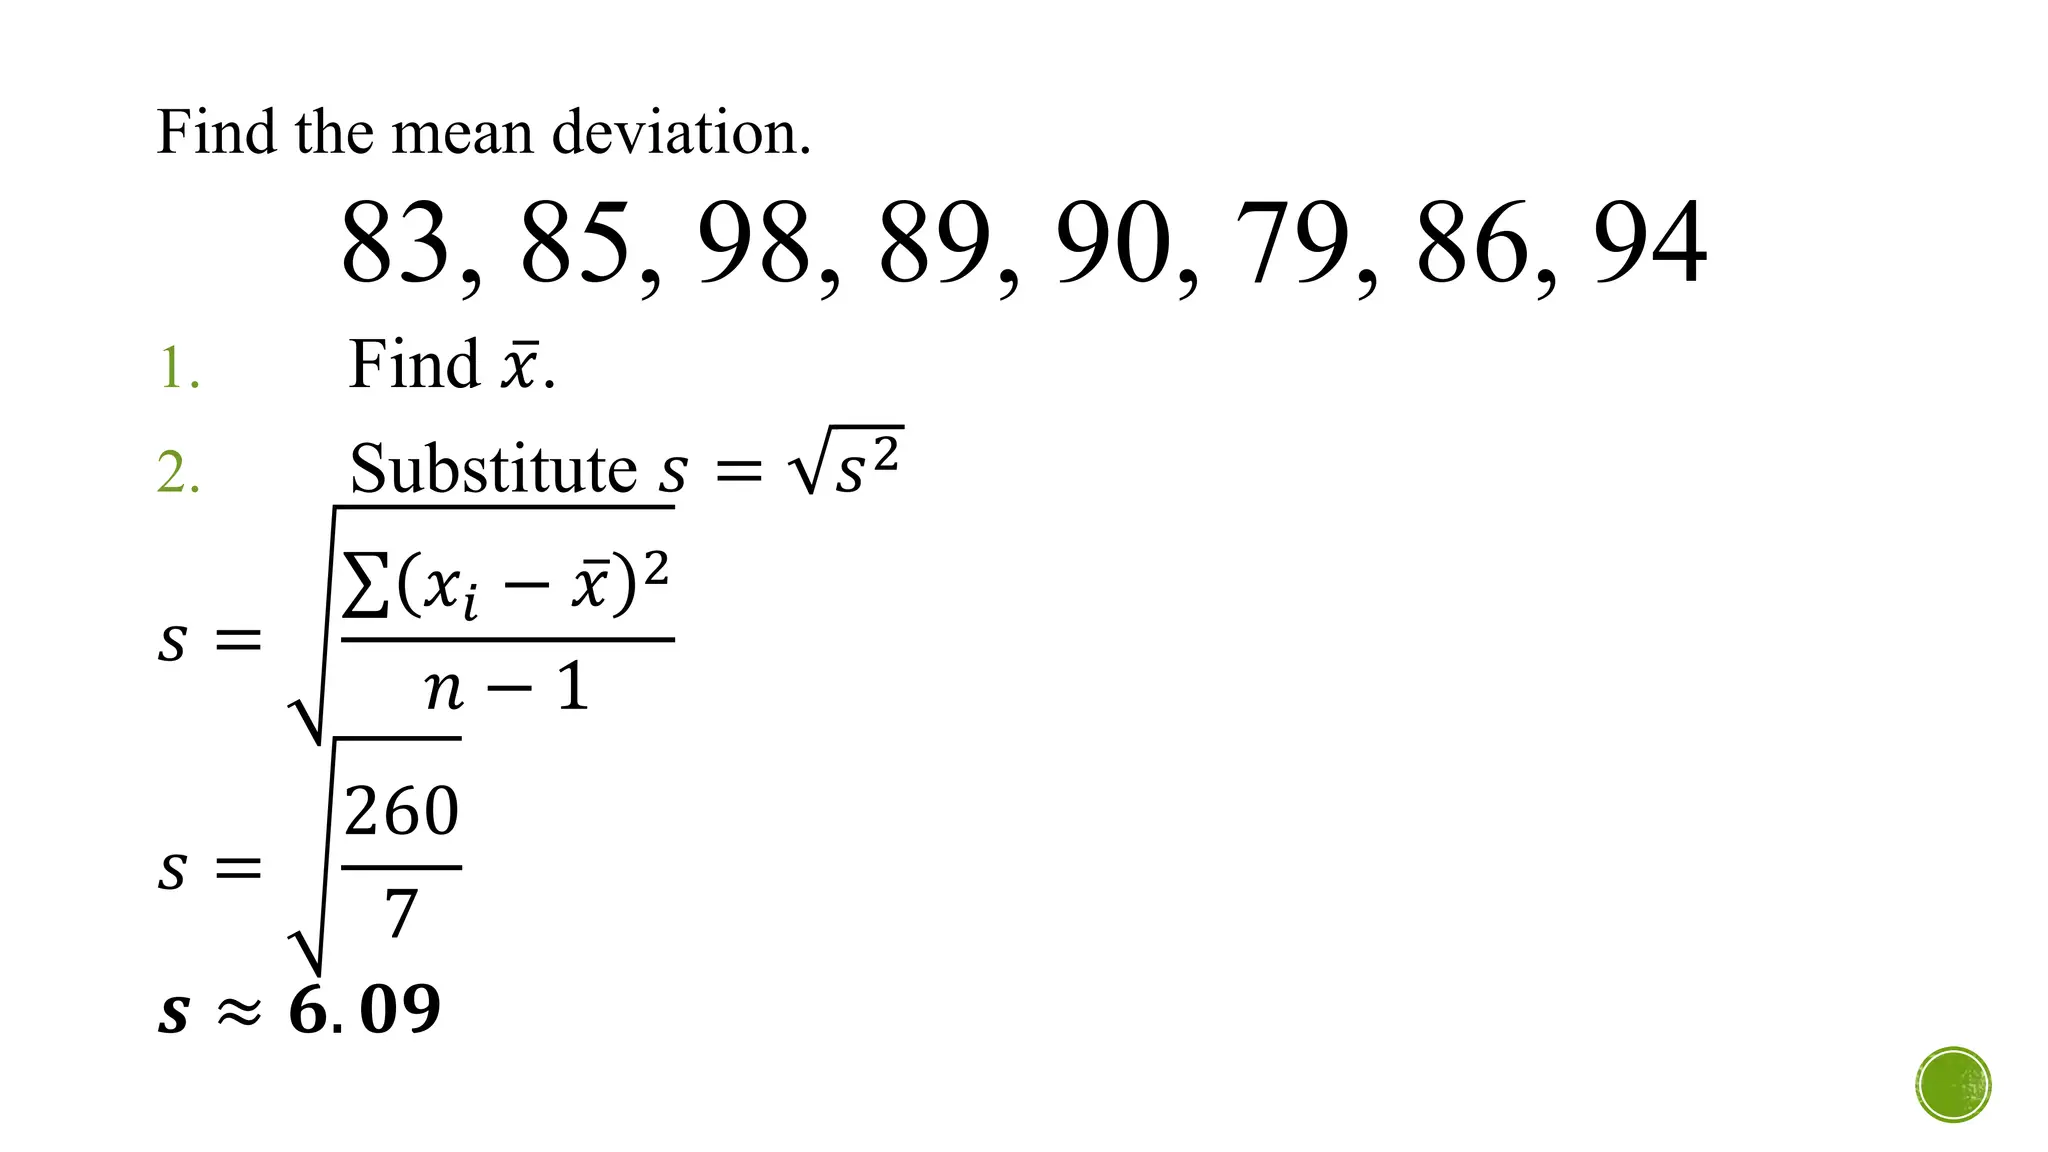
4. Standard Deviation – the square root of variance,
measuring the average deviation from the mean in
the same unit as the data.
𝒔 =
σ 𝒙𝒊−ഥ
𝒙 𝟐
𝒏−𝟏
or 𝒔 = 𝒔𝟐
11.
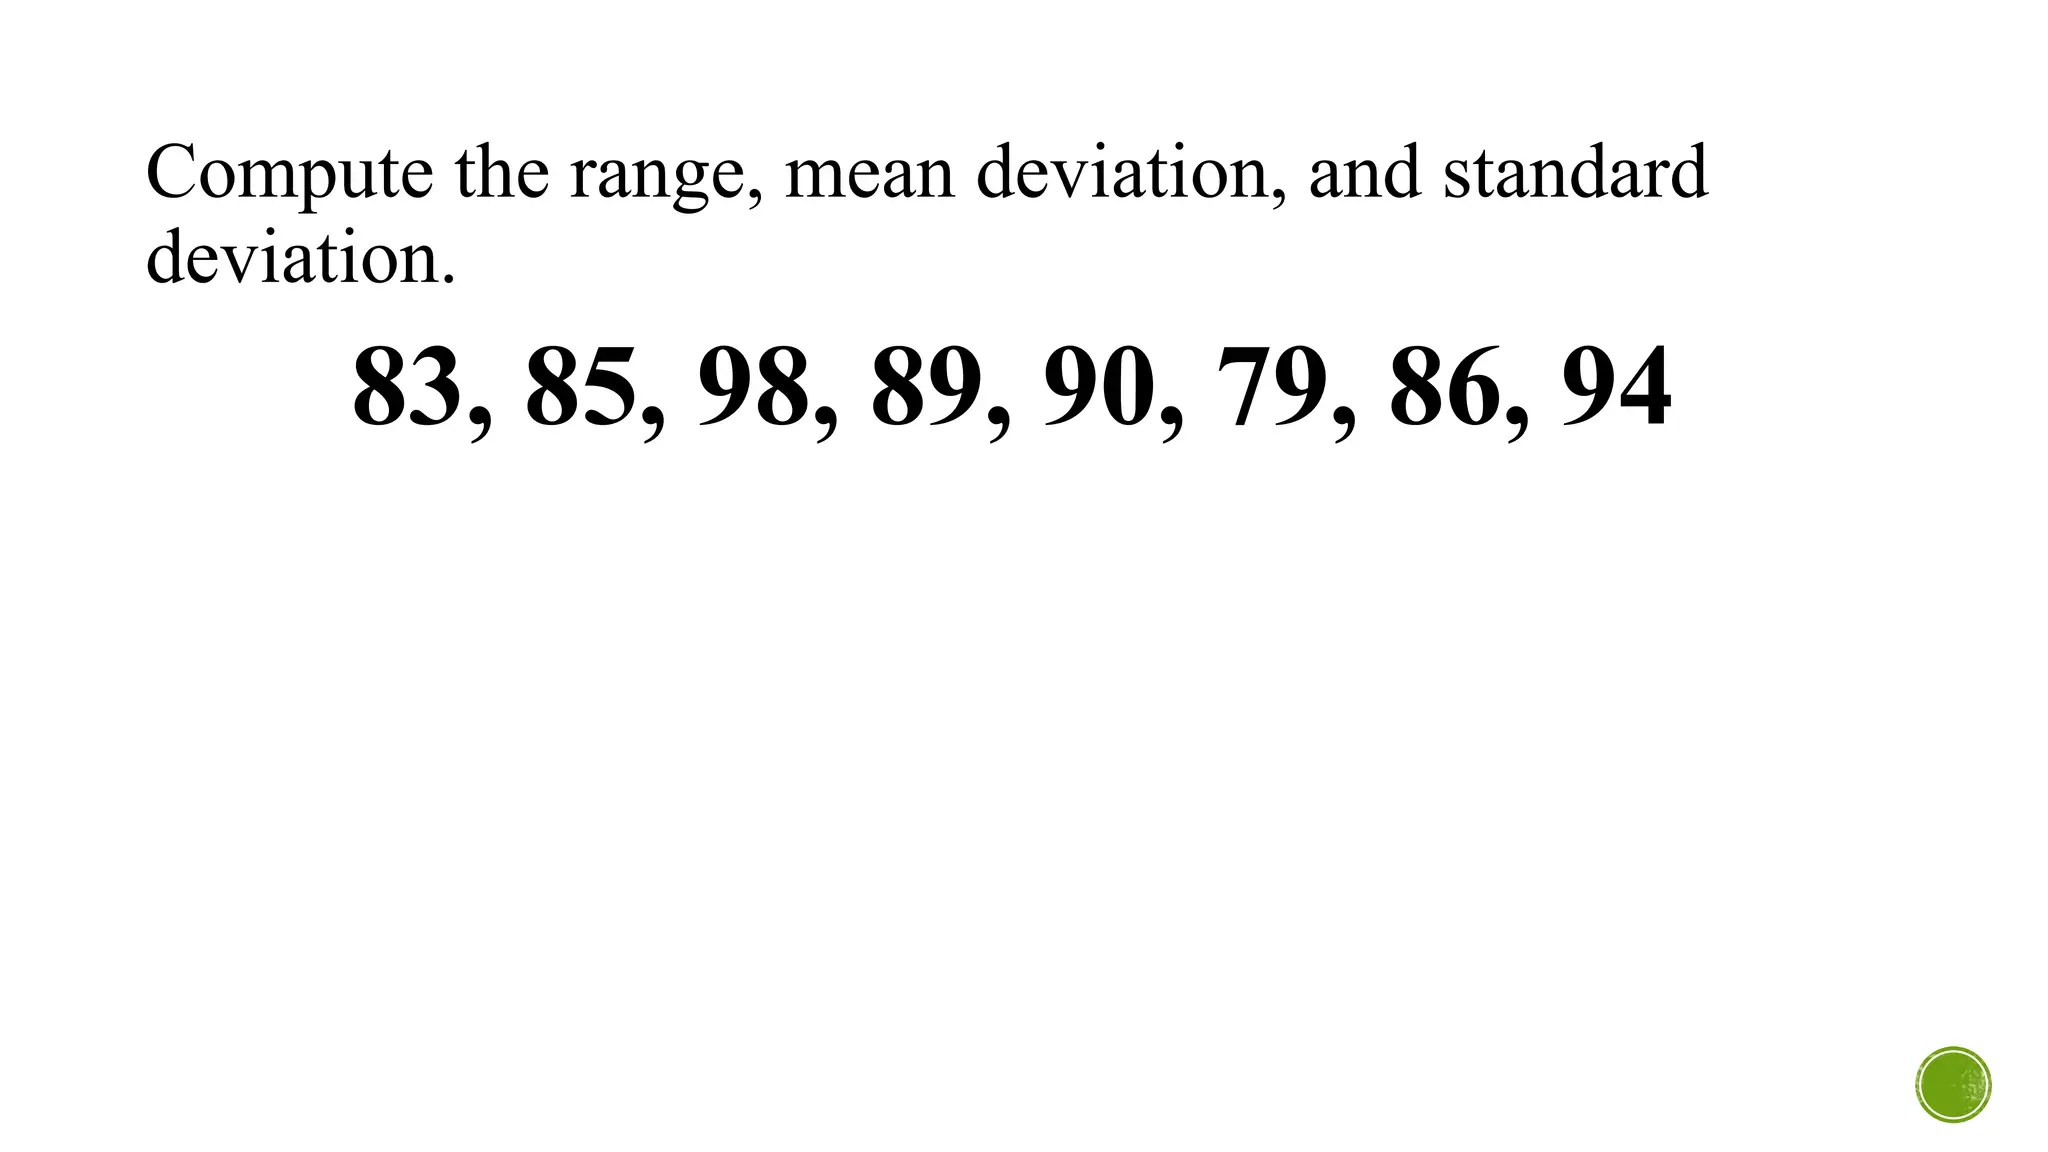
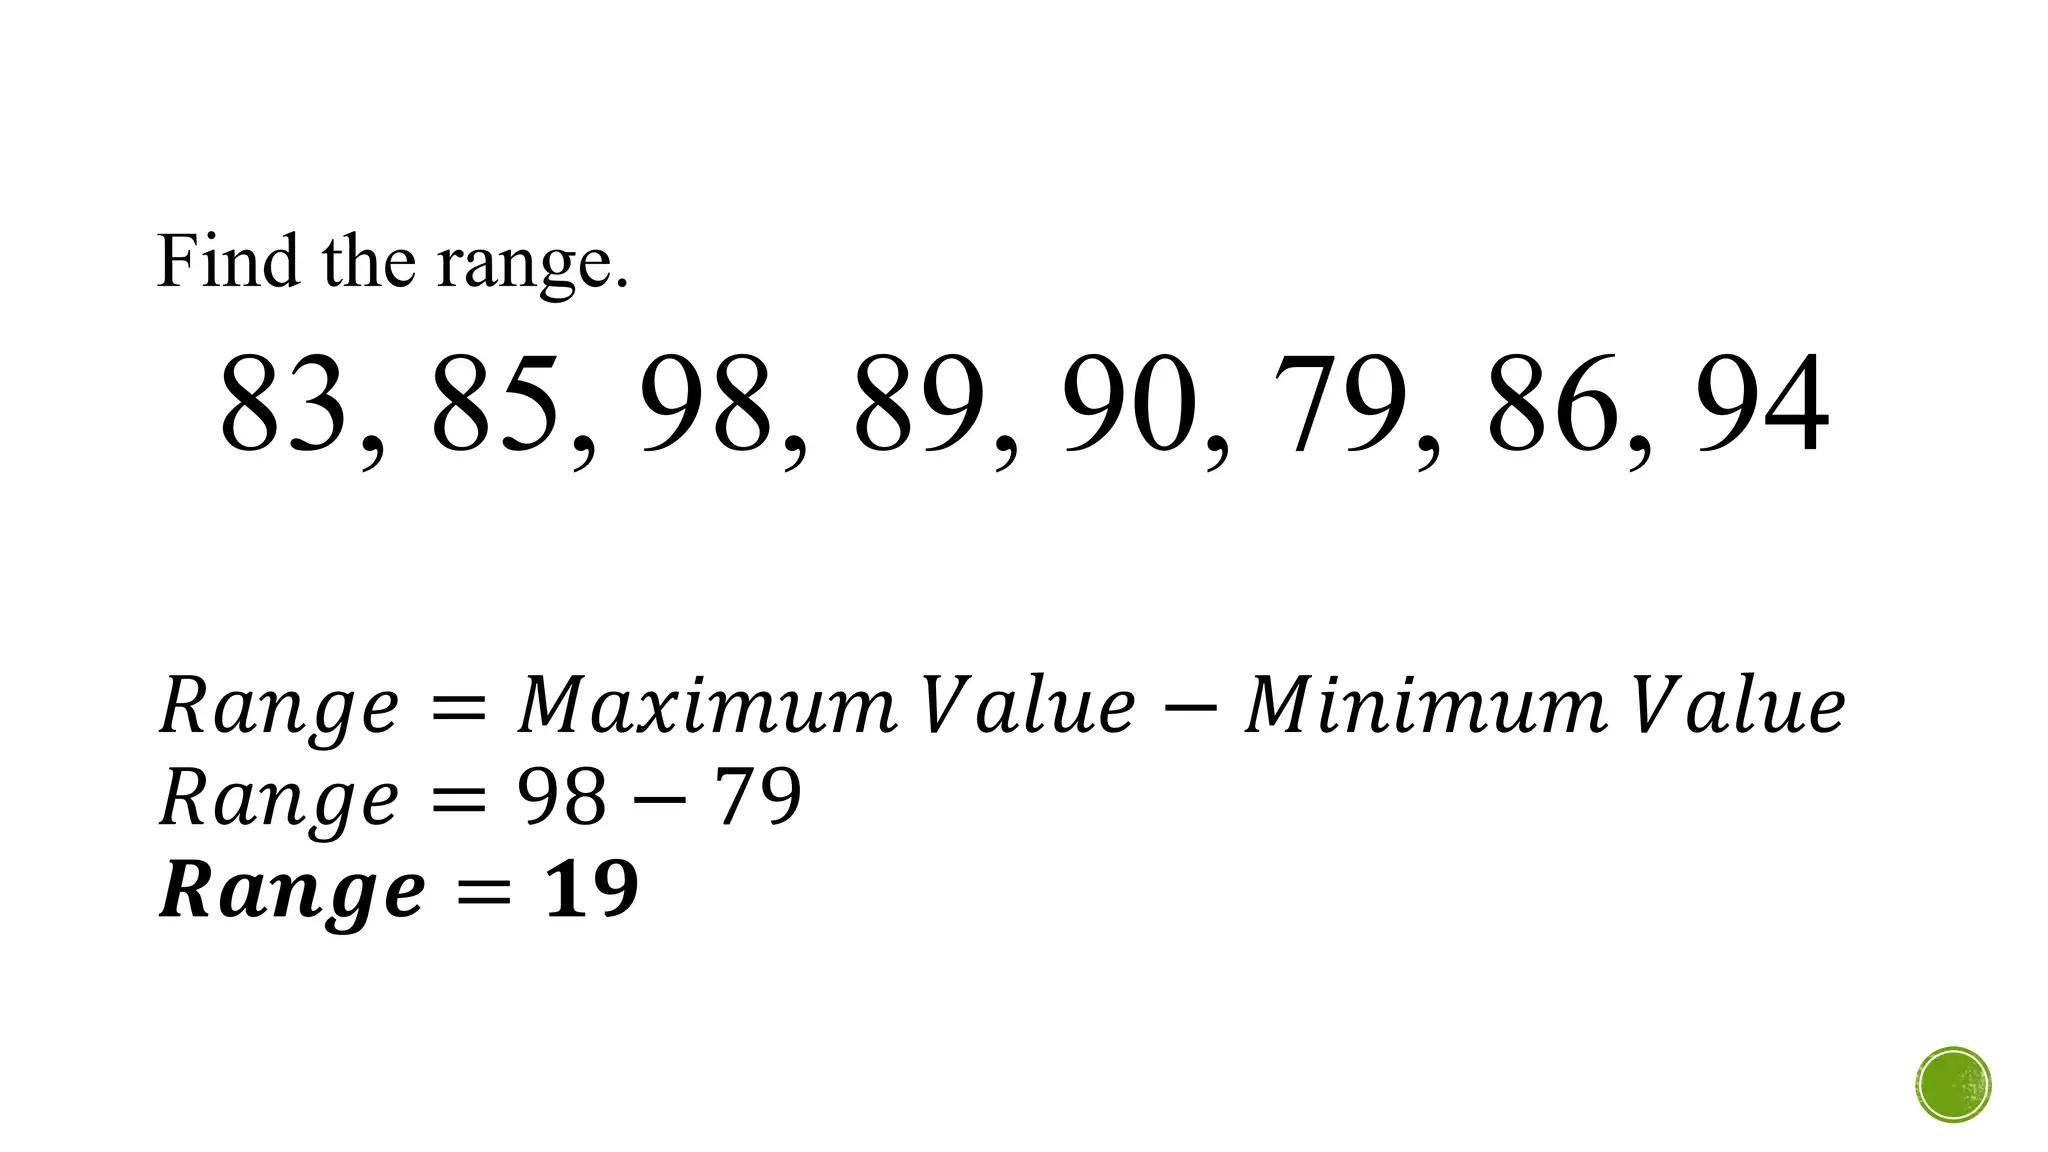
Compute the range,mean deviation, and standard
deviation.
83, 85, 98, 89, 90, 79, 86, 94
MEASURES OF POSITION
▪The measure of position is a method by which the
position that a particular data value has within a given
set of data can be identified.
▪The measures of position include the quartiles,
deciles, and percentiles.
17.
QUARTILES
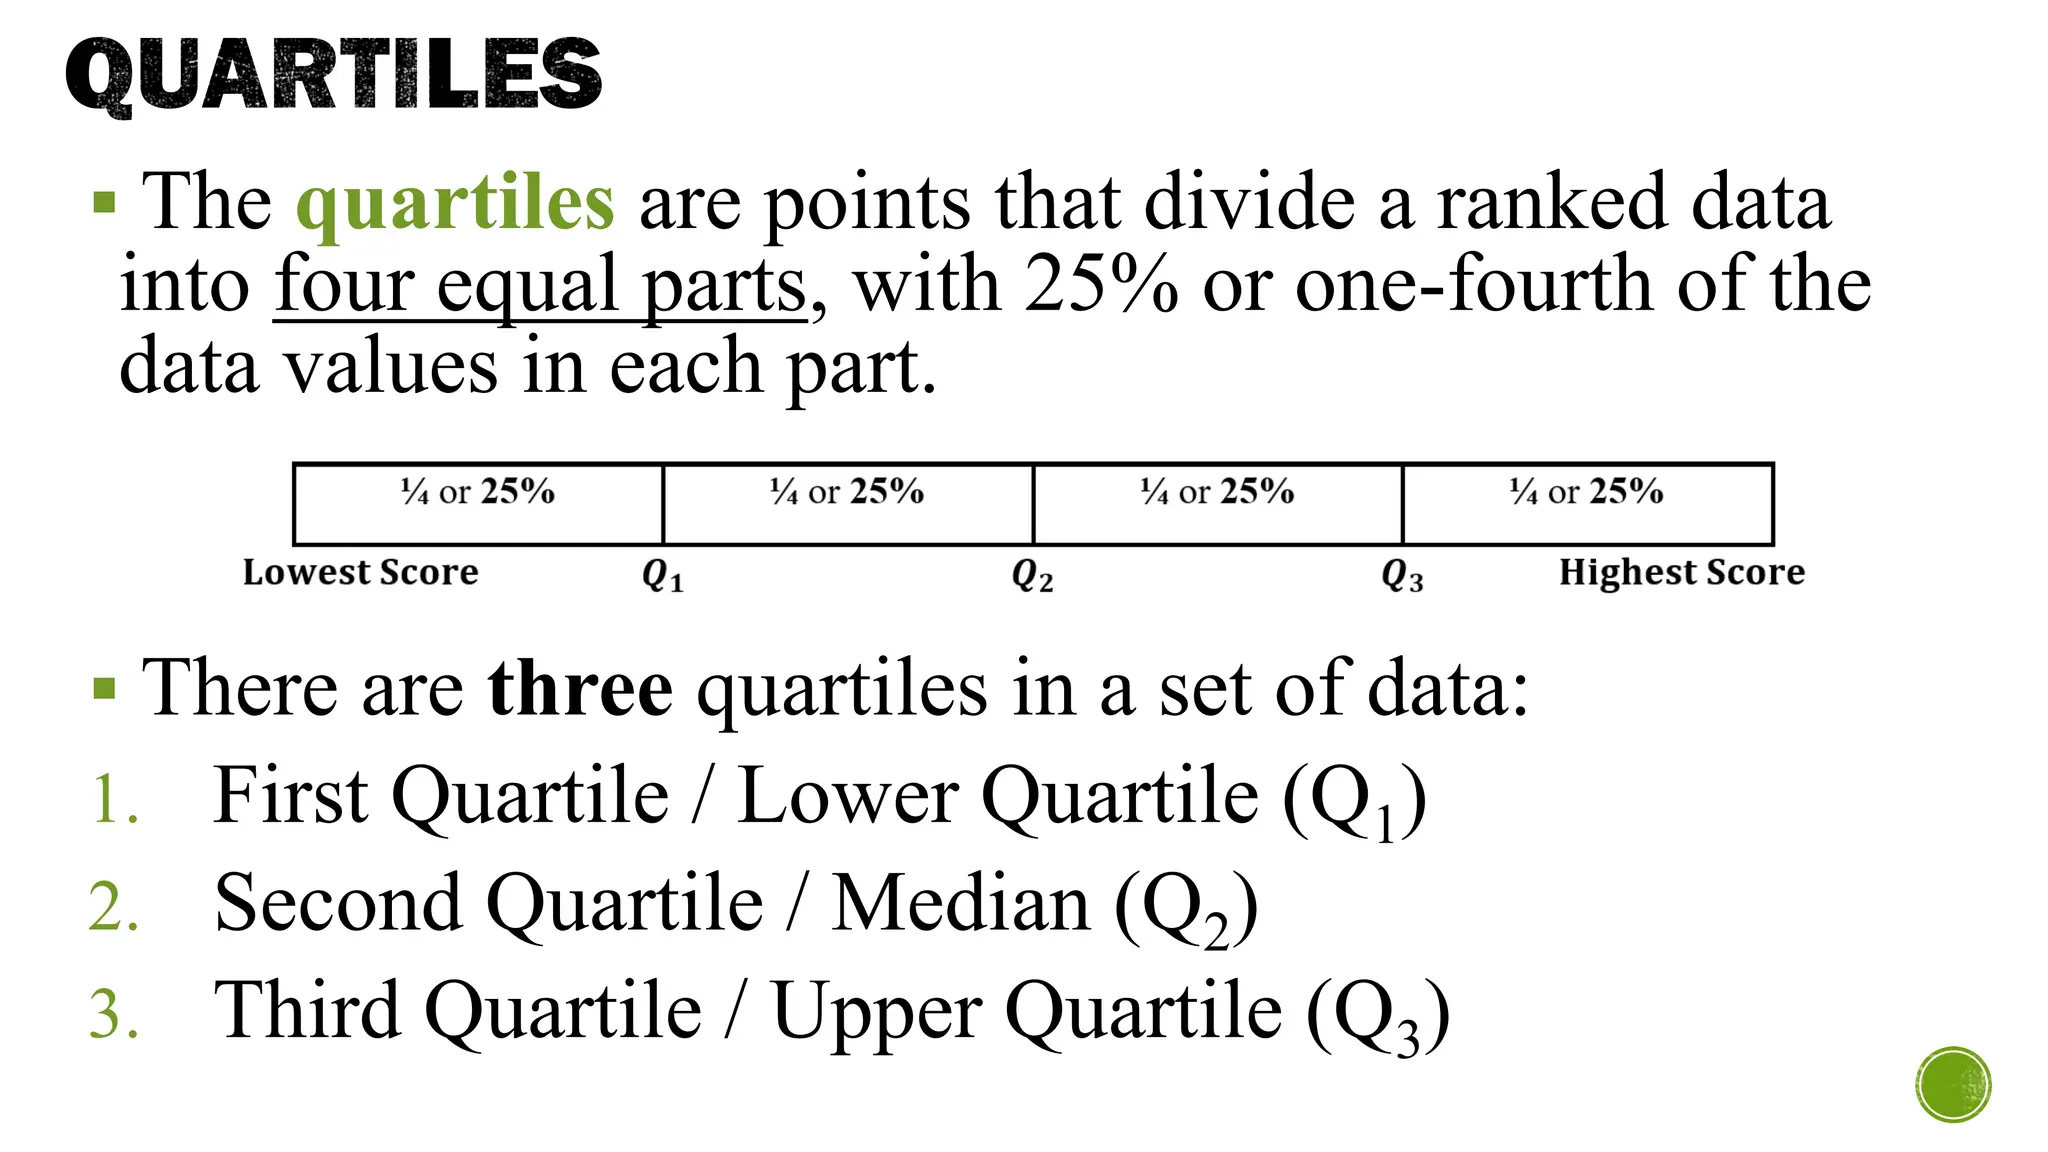
▪ The quartilesare points that divide a ranked data
into four equal parts, with 25% or one-fourth of the
data values in each part.
▪ There are three quartiles in a set of data:
1. First Quartile / Lower Quartile (Q1)
2. Second Quartile / Median (Q2)
3. Third Quartile / Upper Quartile (Q3)
18.
QUARTILES
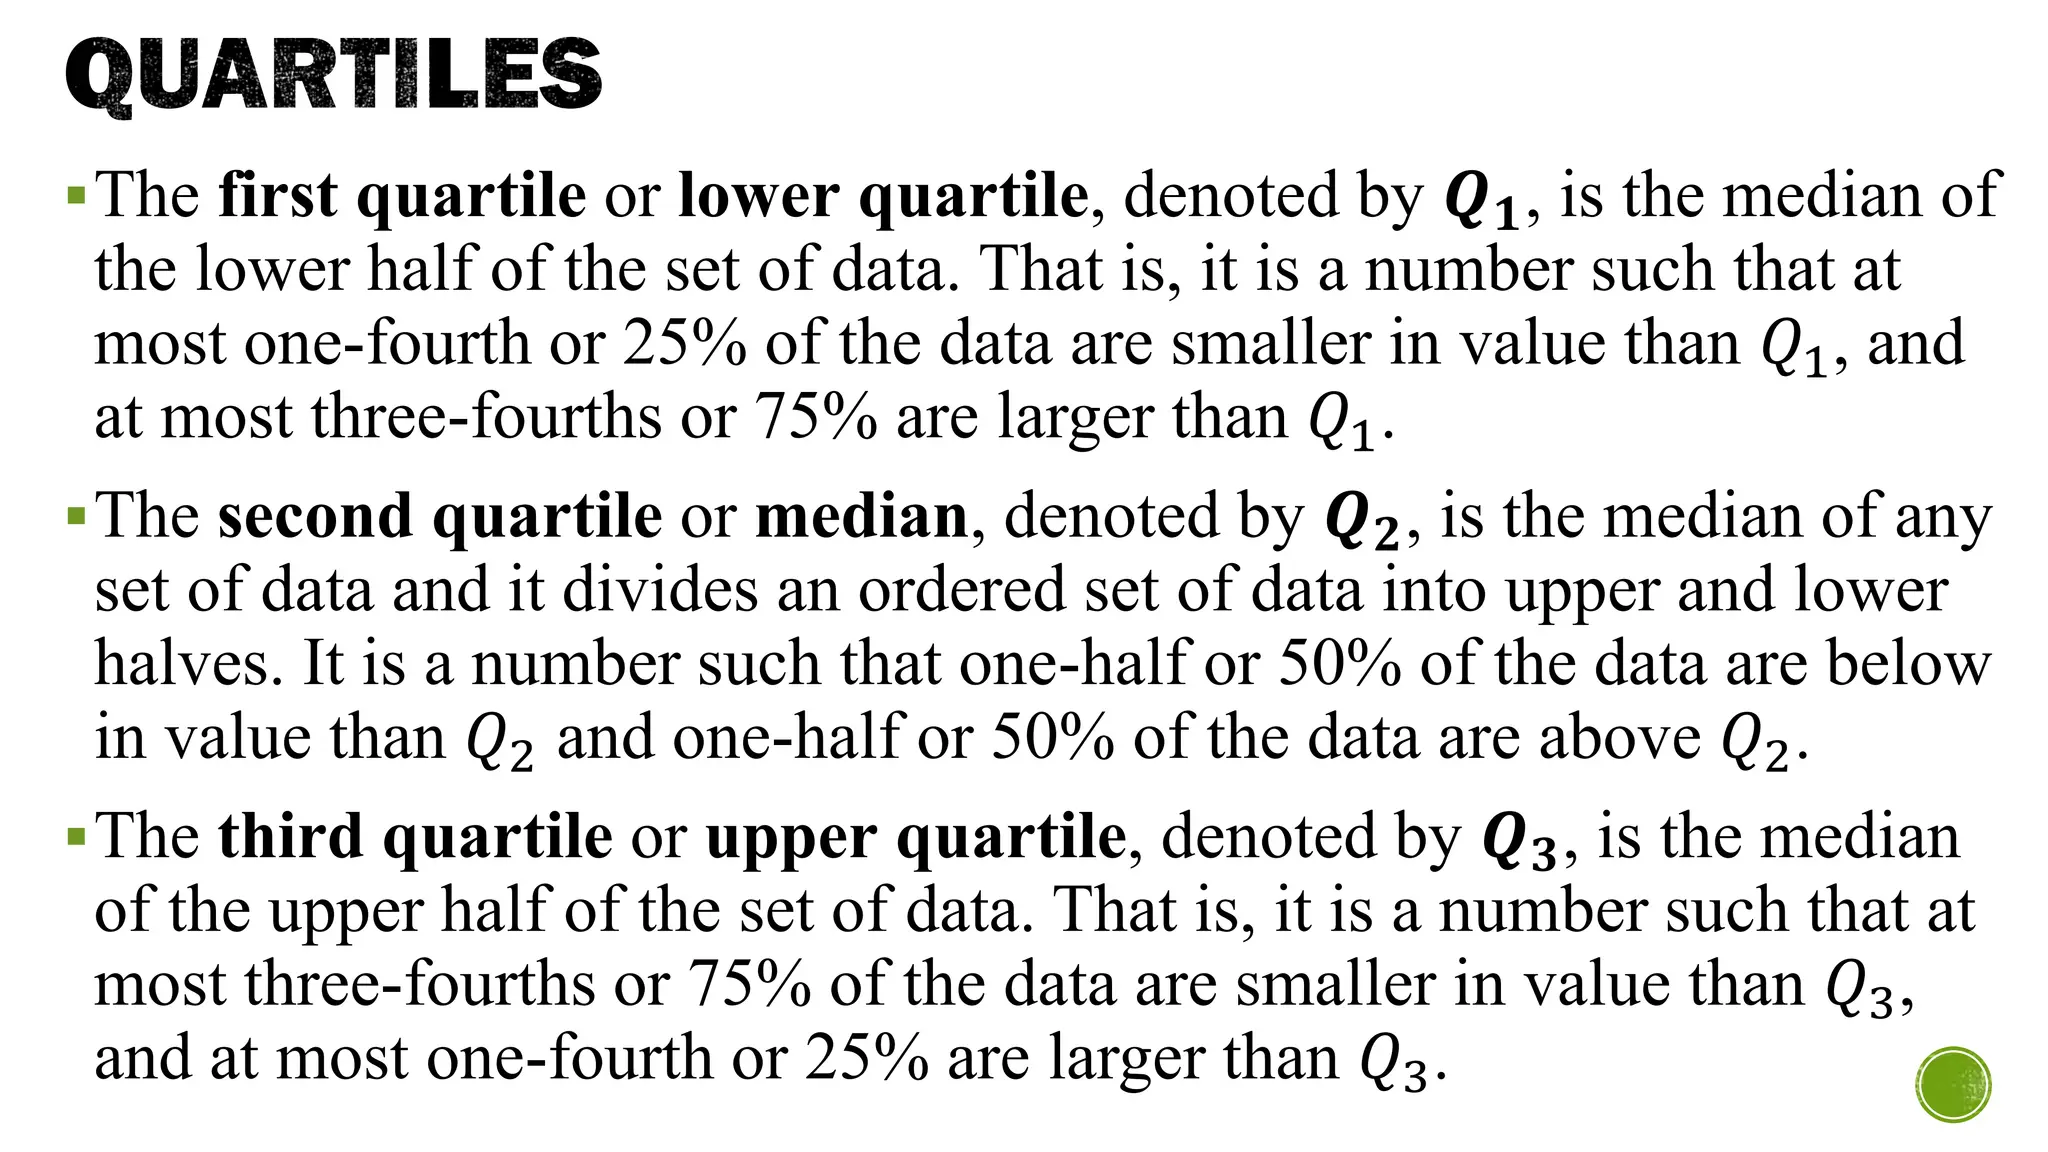
▪The first quartileor lower quartile, denoted by 𝑸𝟏, is the median of
the lower half of the set of data. That is, it is a number such that at
most one-fourth or 25% of the data are smaller in value than 𝑄1, and
at most three-fourths or 75% are larger than 𝑄1.
▪The second quartile or median, denoted by 𝑸𝟐, is the median of any
set of data and it divides an ordered set of data into upper and lower
halves. It is a number such that one-half or 50% of the data are below
in value than 𝑄2 and one-half or 50% of the data are above 𝑄2.
▪The third quartile or upper quartile, denoted by 𝑸𝟑, is the median
of the upper half of the set of data. That is, it is a number such that at
most three-fourths or 75% of the data are smaller in value than 𝑄3,
and at most one-fourth or 25% are larger than 𝑄3.
19.
QUARTILES
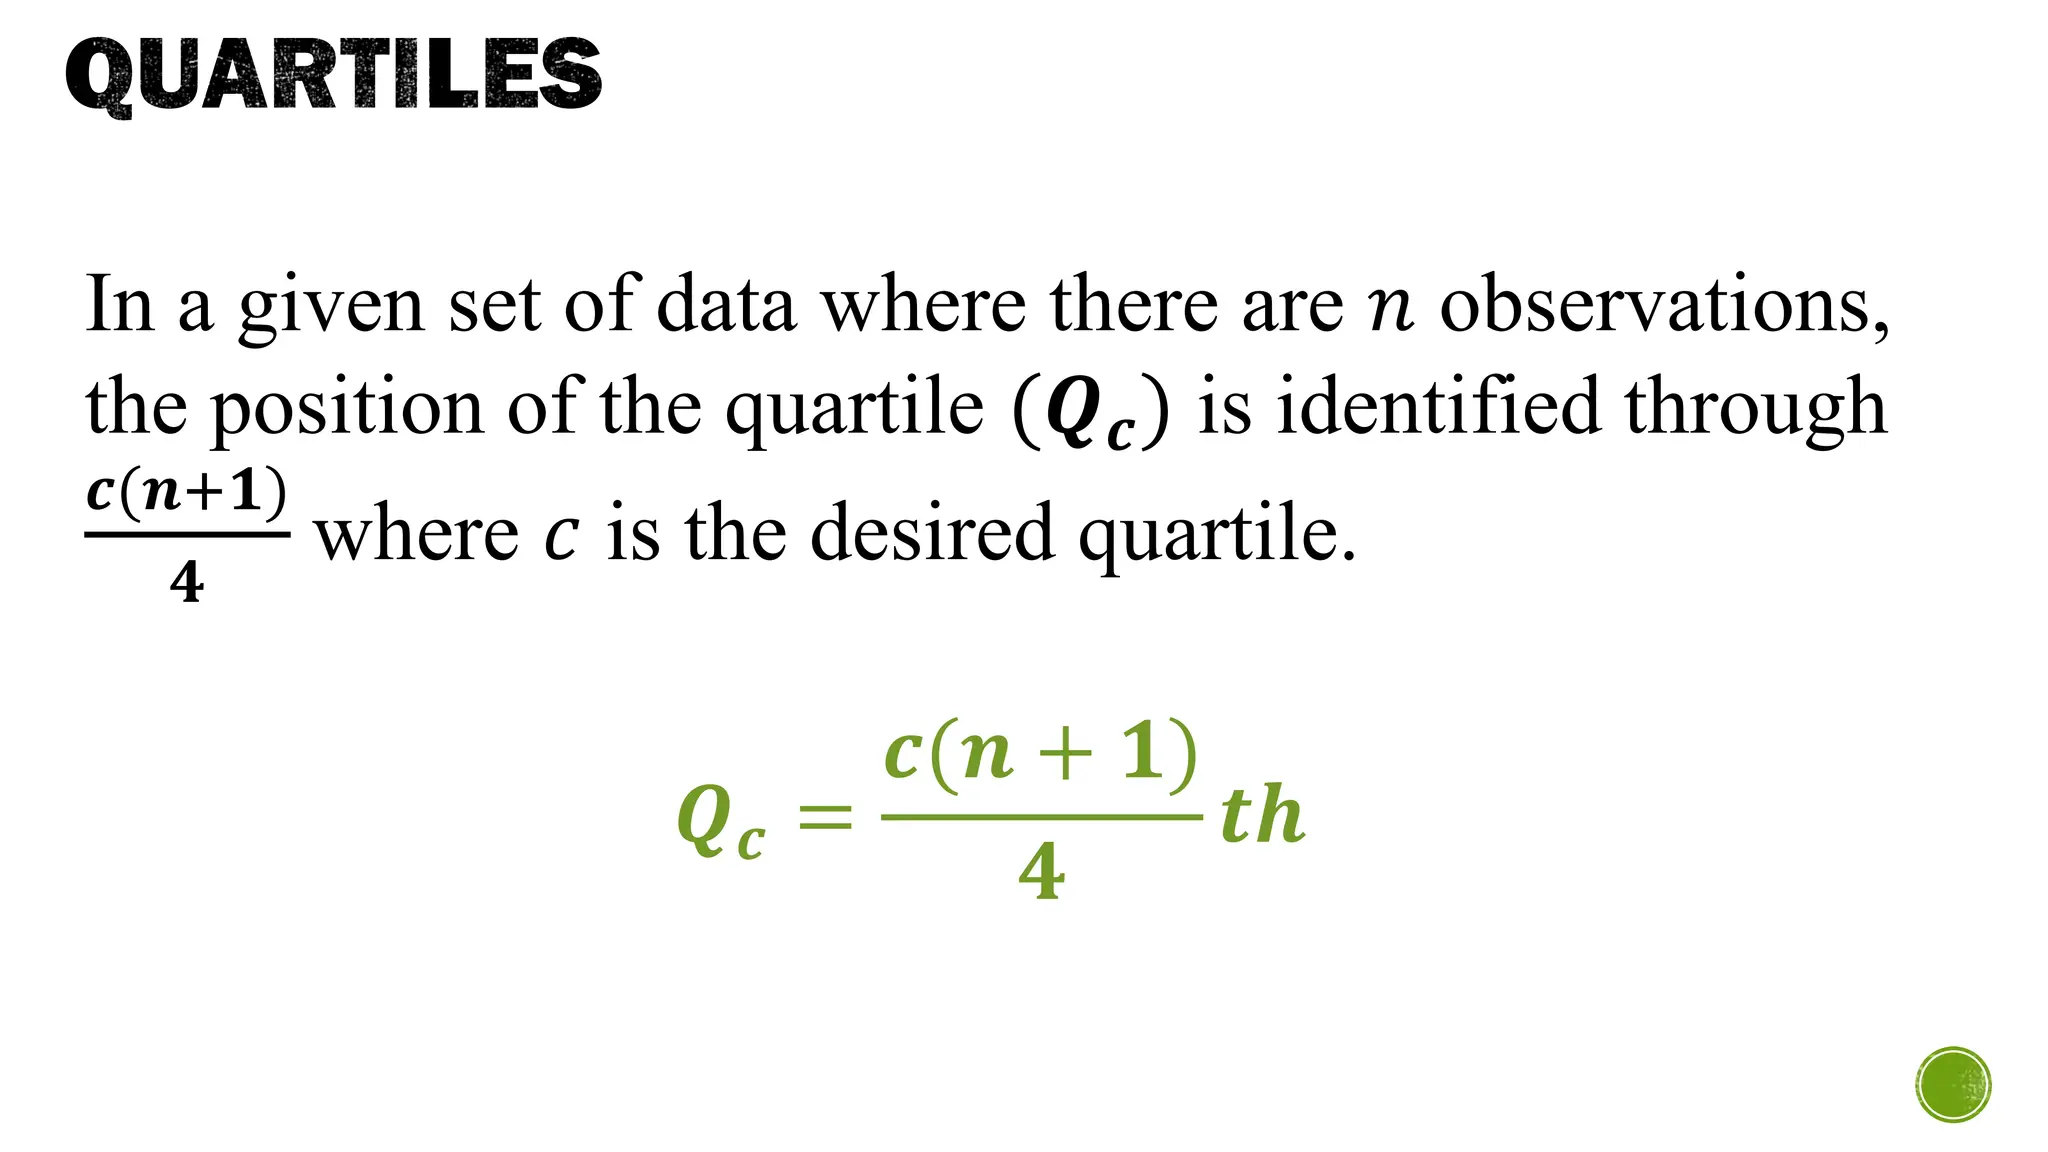
In a givenset of data where there are 𝑛 observations,
the position of the quartile (𝑸𝒄) is identified through
𝒄(𝒏+𝟏)
𝟒
where 𝑐 is the desired quartile.
𝑸𝒄 =
𝒄(𝒏 + 𝟏)
𝟒
𝒕𝒉
20.
QUARTILES
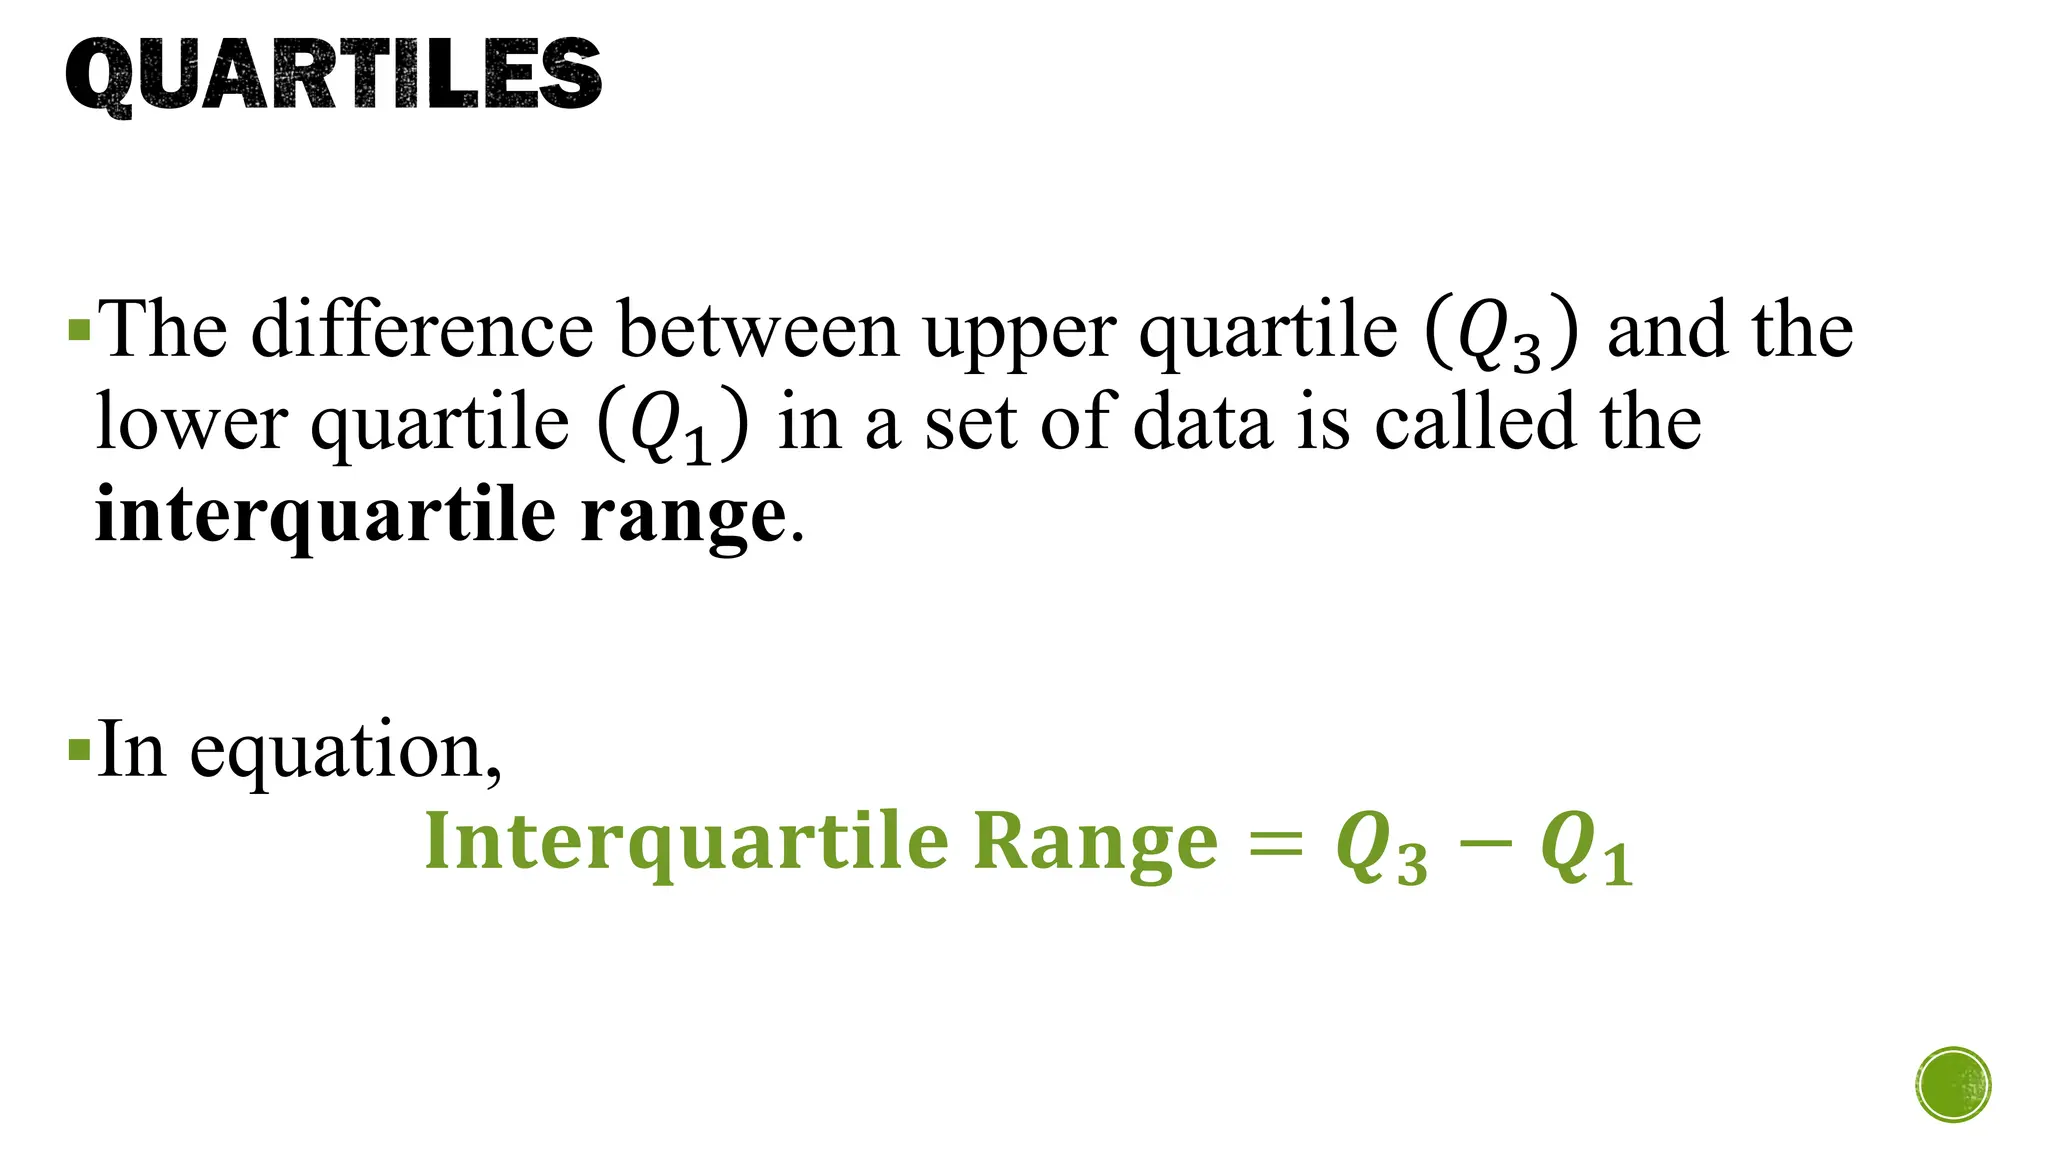
▪The difference betweenupper quartile 𝑄3 and the
lower quartile 𝑄1 in a set of data is called the
interquartile range.
▪In equation,
𝐈𝐧𝐭𝐞𝐫𝐪𝐮𝐚𝐫𝐭𝐢𝐥𝐞 𝐑𝐚𝐧𝐠𝐞 = 𝑸𝟑 − 𝑸𝟏
21.
QUARTILES
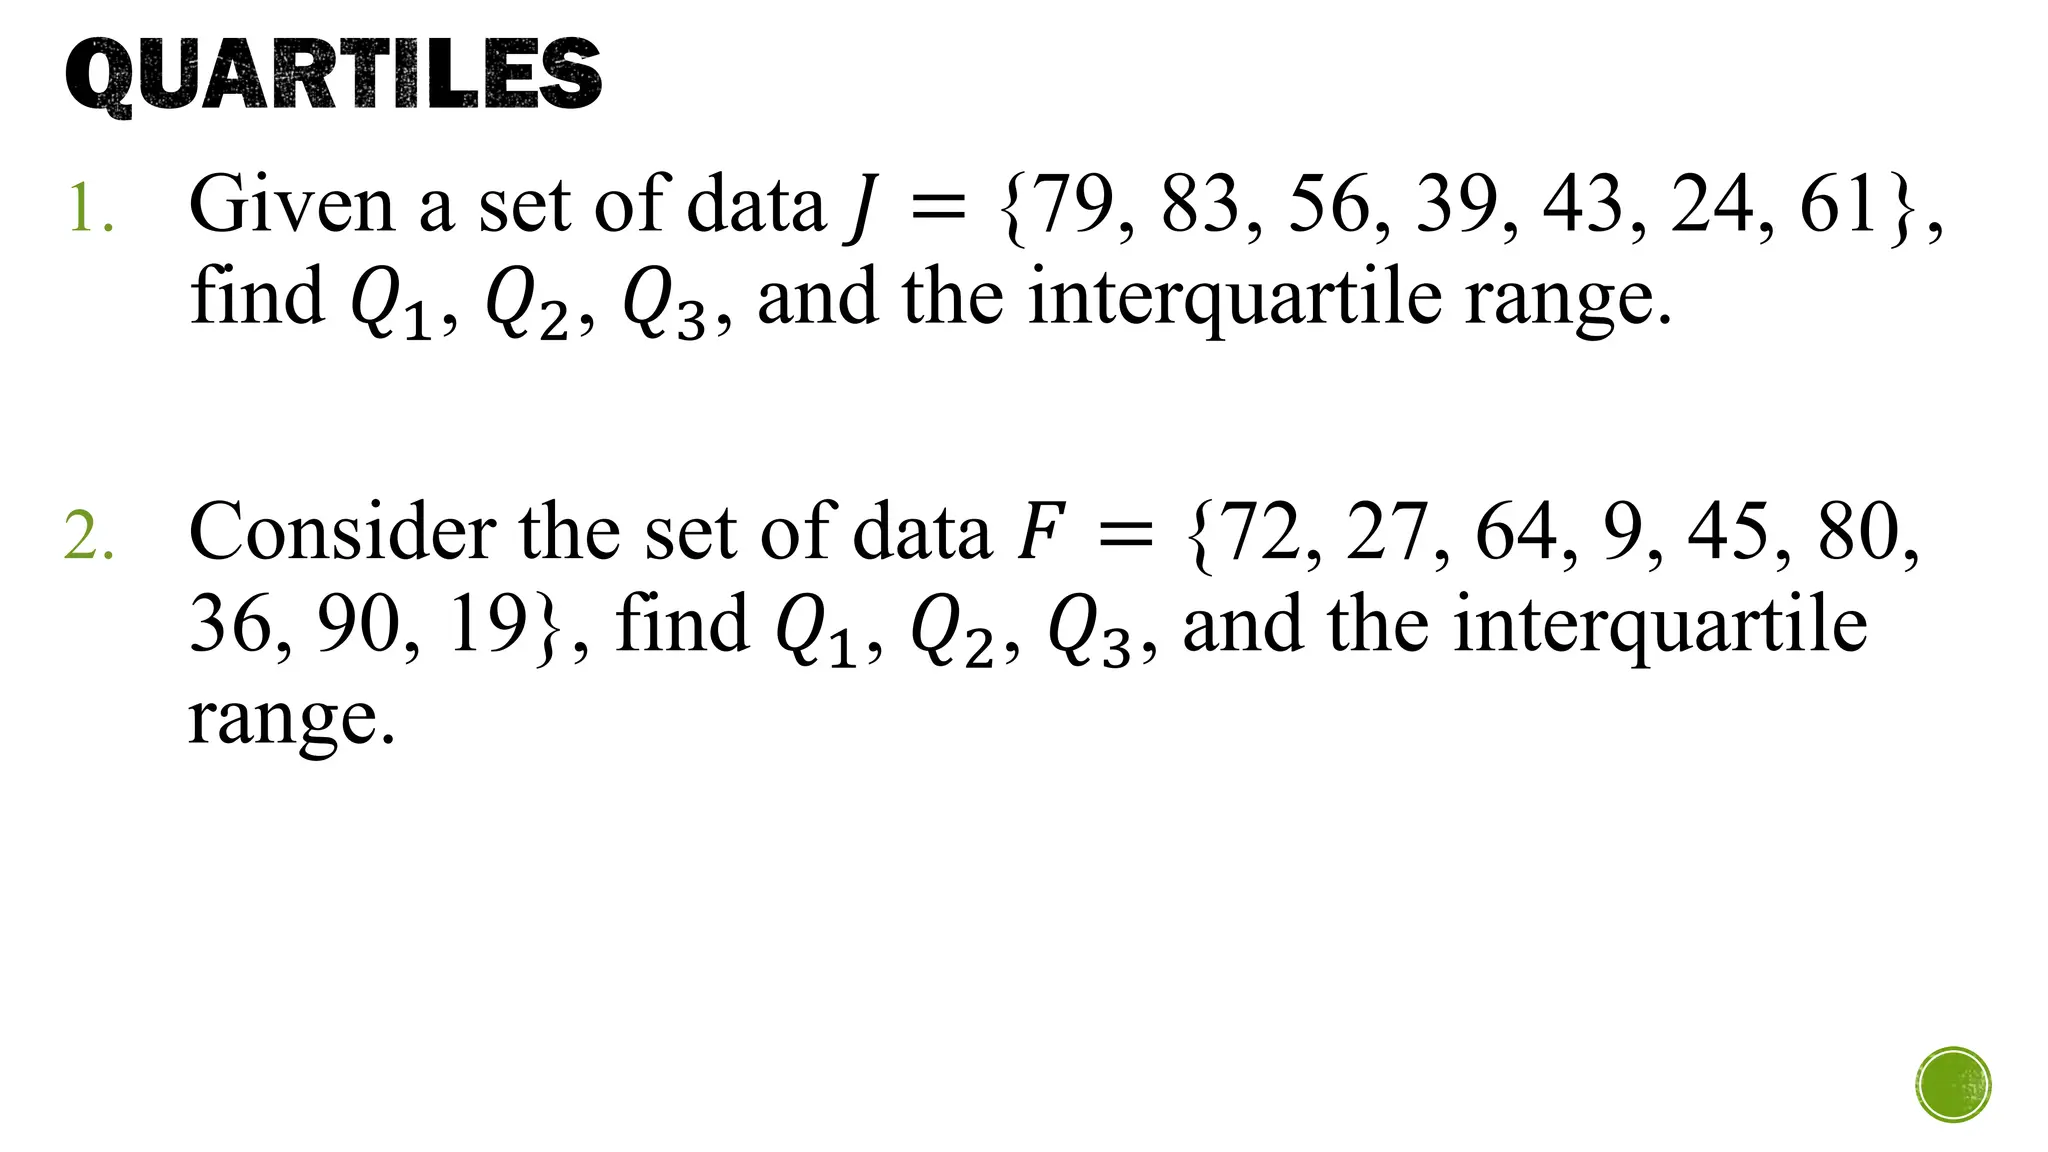
1. Given aset of data 𝐽 = {79, 83, 56, 39, 43, 24, 61},
find 𝑄1, 𝑄2, 𝑄3, and the interquartile range.
2. Consider the set of data 𝐹 = {72, 27, 64, 9, 45, 80,
36, 90, 19}, find 𝑄1, 𝑄2, 𝑄3, and the interquartile
range.
22.
QUARTILES
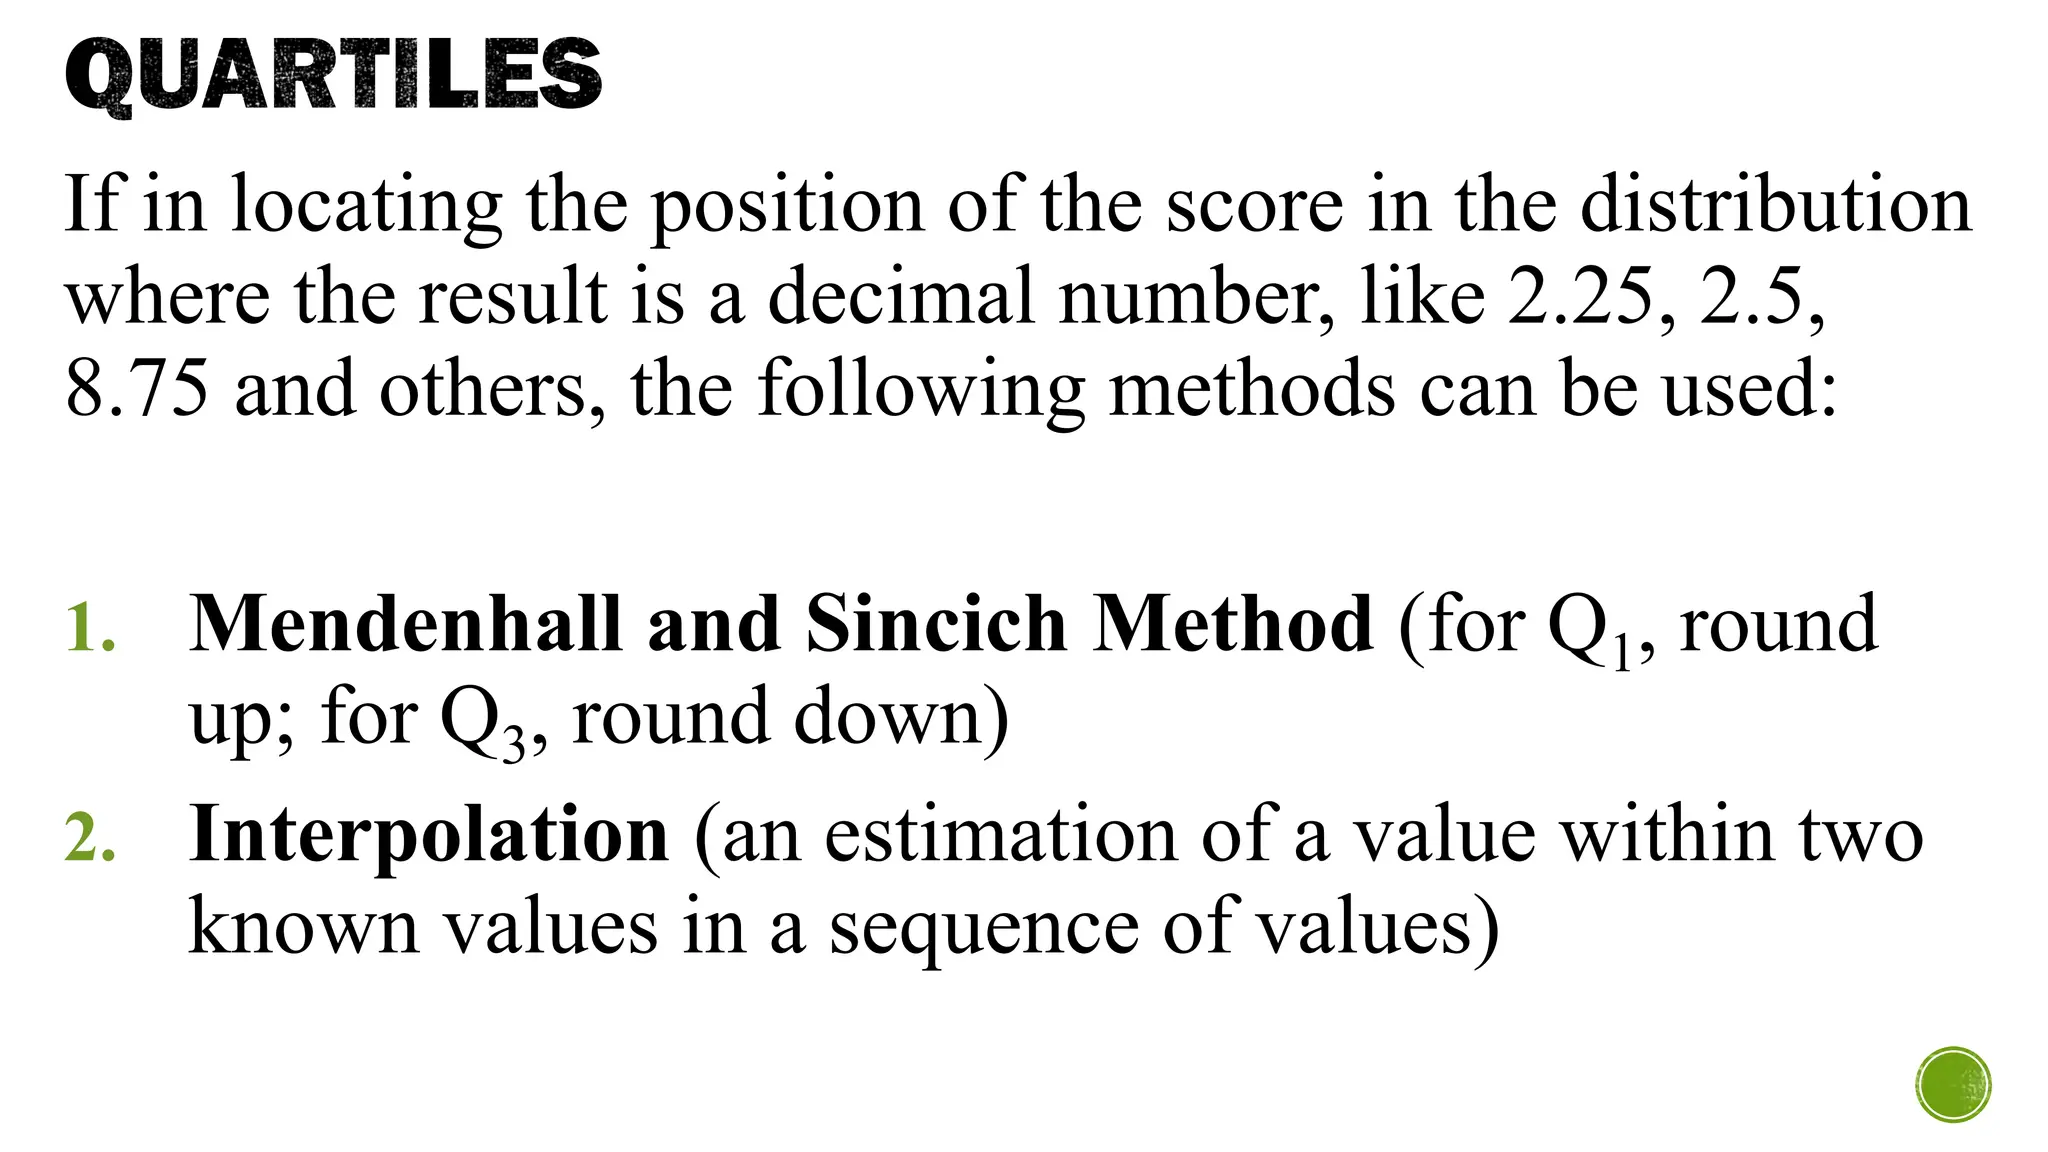
If in locatingthe position of the score in the distribution
where the result is a decimal number, like 2.25, 2.5,
8.75 and others, the following methods can be used:
1. Mendenhall and Sincich Method (for Q1, round
up; for Q3, round down)
2. Interpolation (an estimation of a value within two
known values in a sequence of values)
23.
QUARTILES
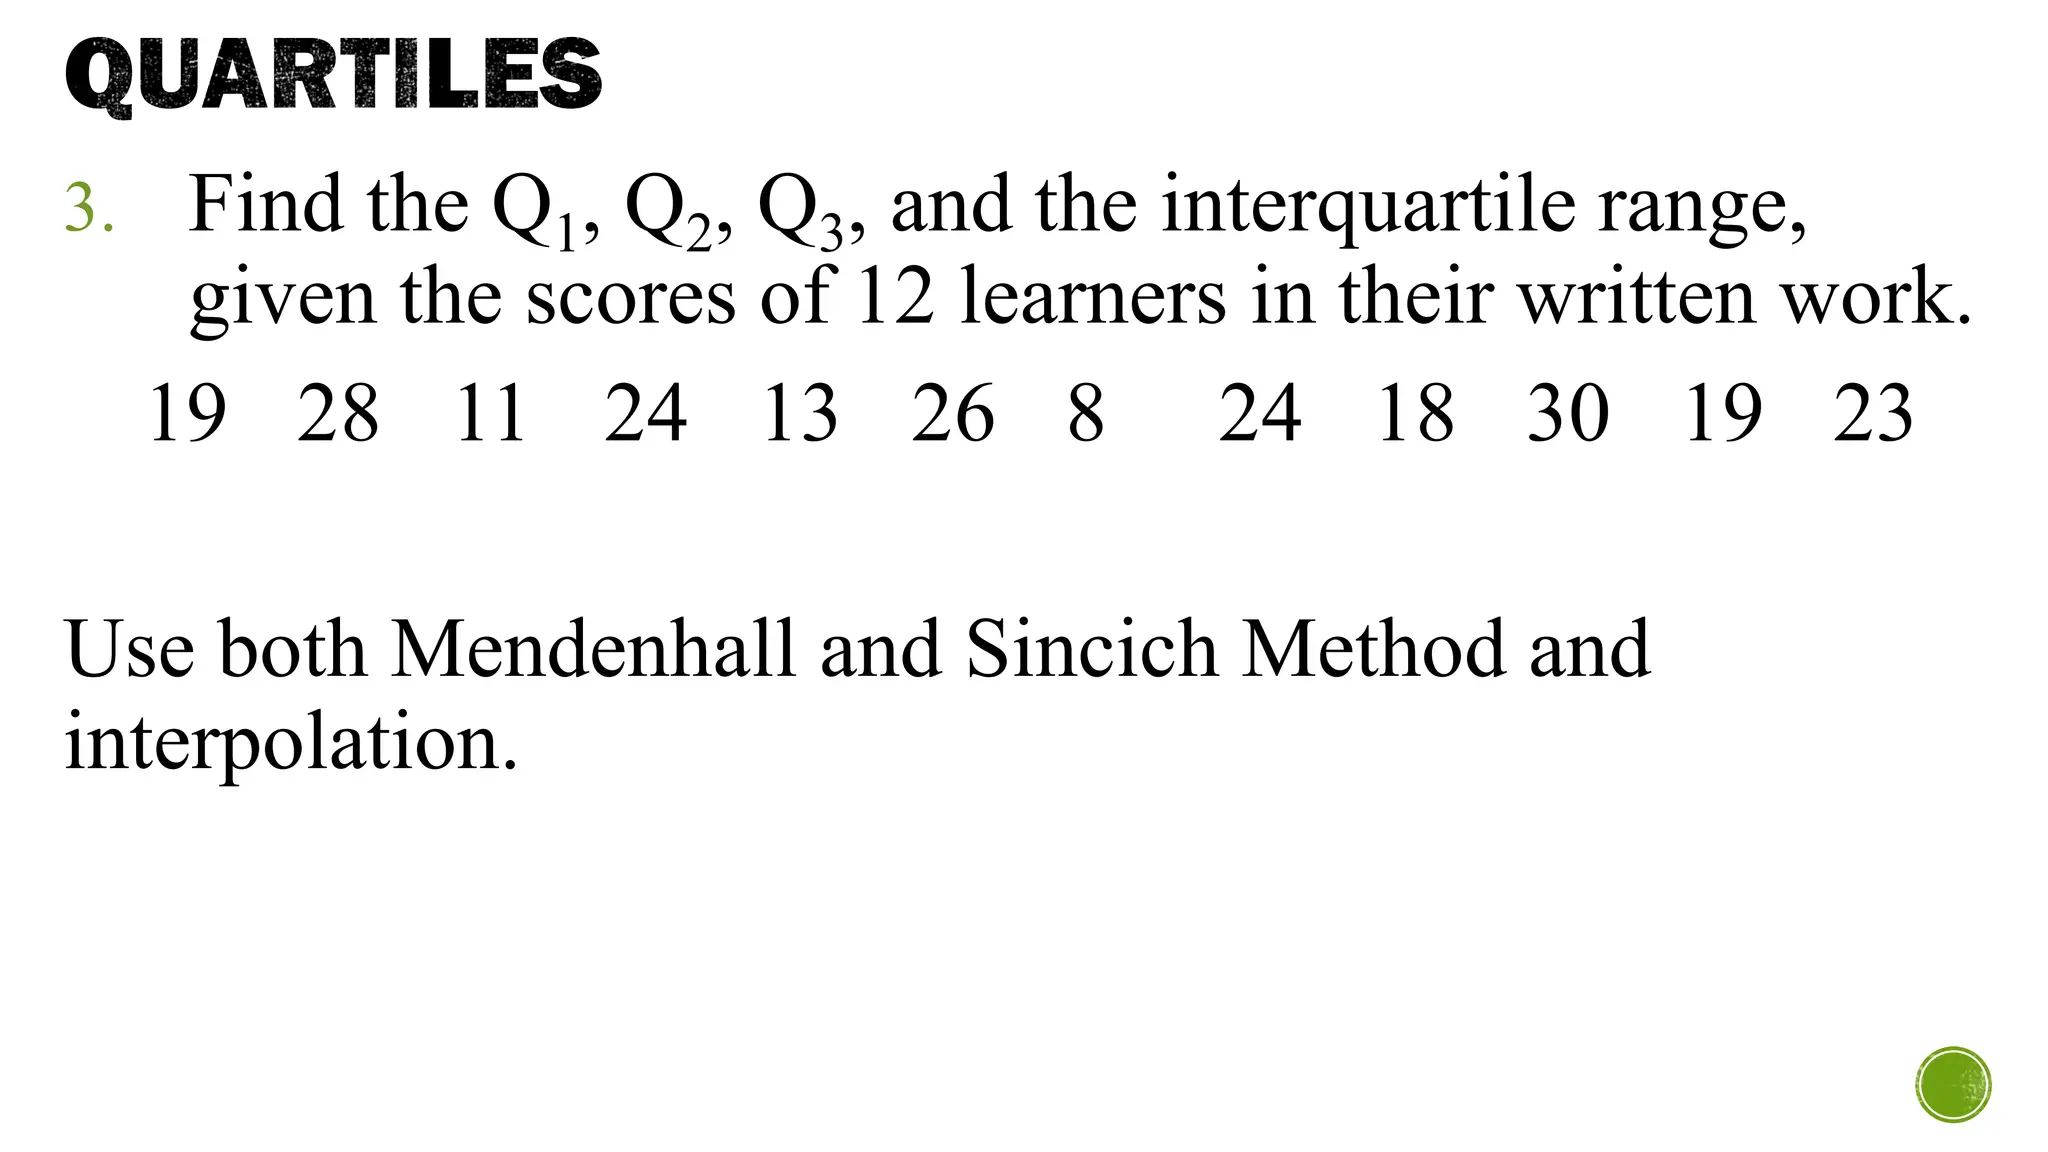
3. Find theQ1, Q2, Q3, and the interquartile range,
given the scores of 12 learners in their written work.
19 28 11 24 13 26 8 24 18 30 19 23
Use both Mendenhall and Sincich Method and
interpolation.
24.
DECILES
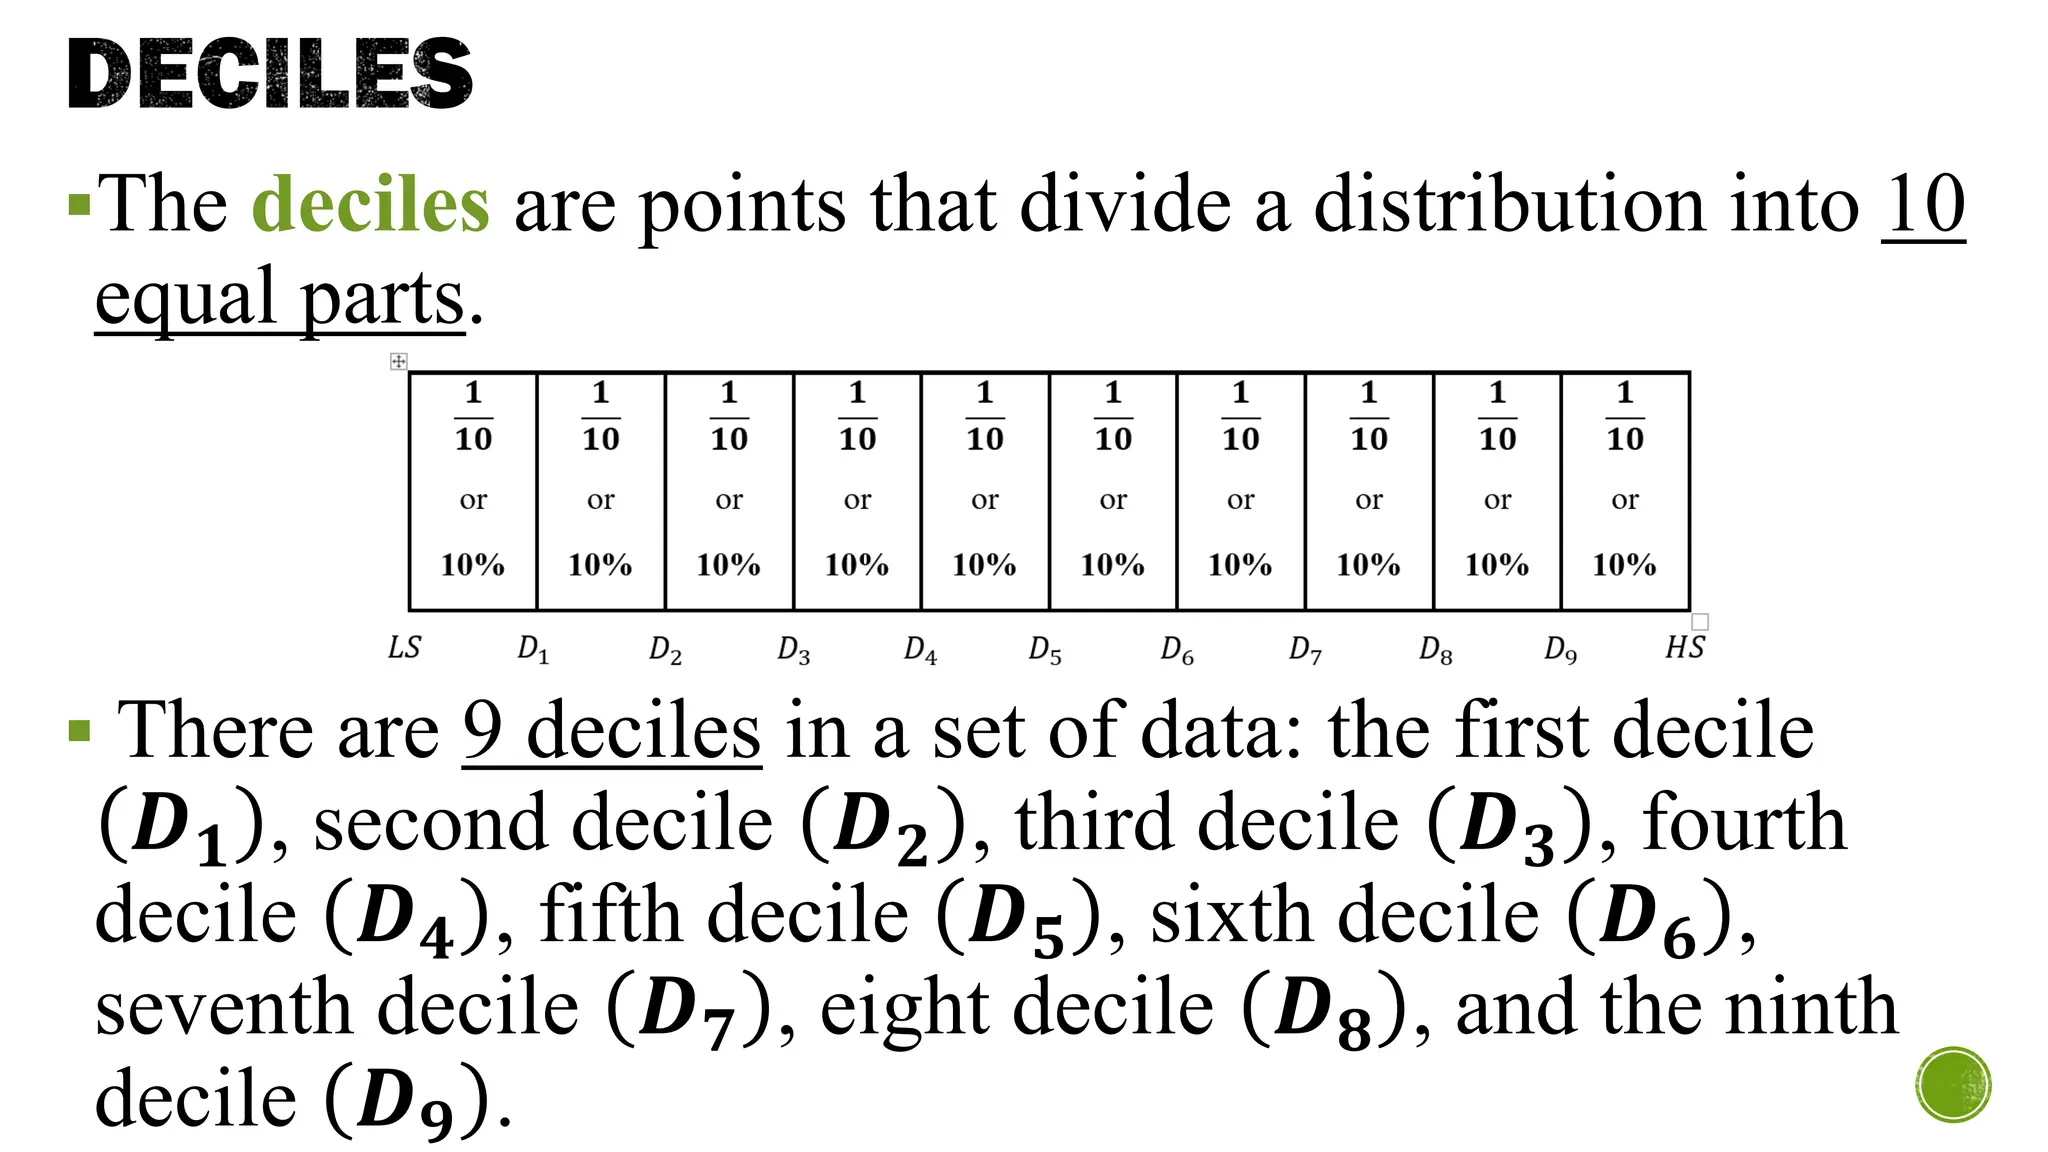
▪The deciles arepoints that divide a distribution into 10
equal parts.
▪ There are 9 deciles in a set of data: the first decile
𝑫𝟏 , second decile 𝑫𝟐 , third decile 𝑫𝟑 , fourth
decile 𝑫𝟒 , fifth decile 𝑫𝟓 , sixth decile 𝑫𝟔 ,
seventh decile 𝑫𝟕 , eight decile 𝑫𝟖 , and the ninth
decile 𝑫𝟗 .
25.
DECILES
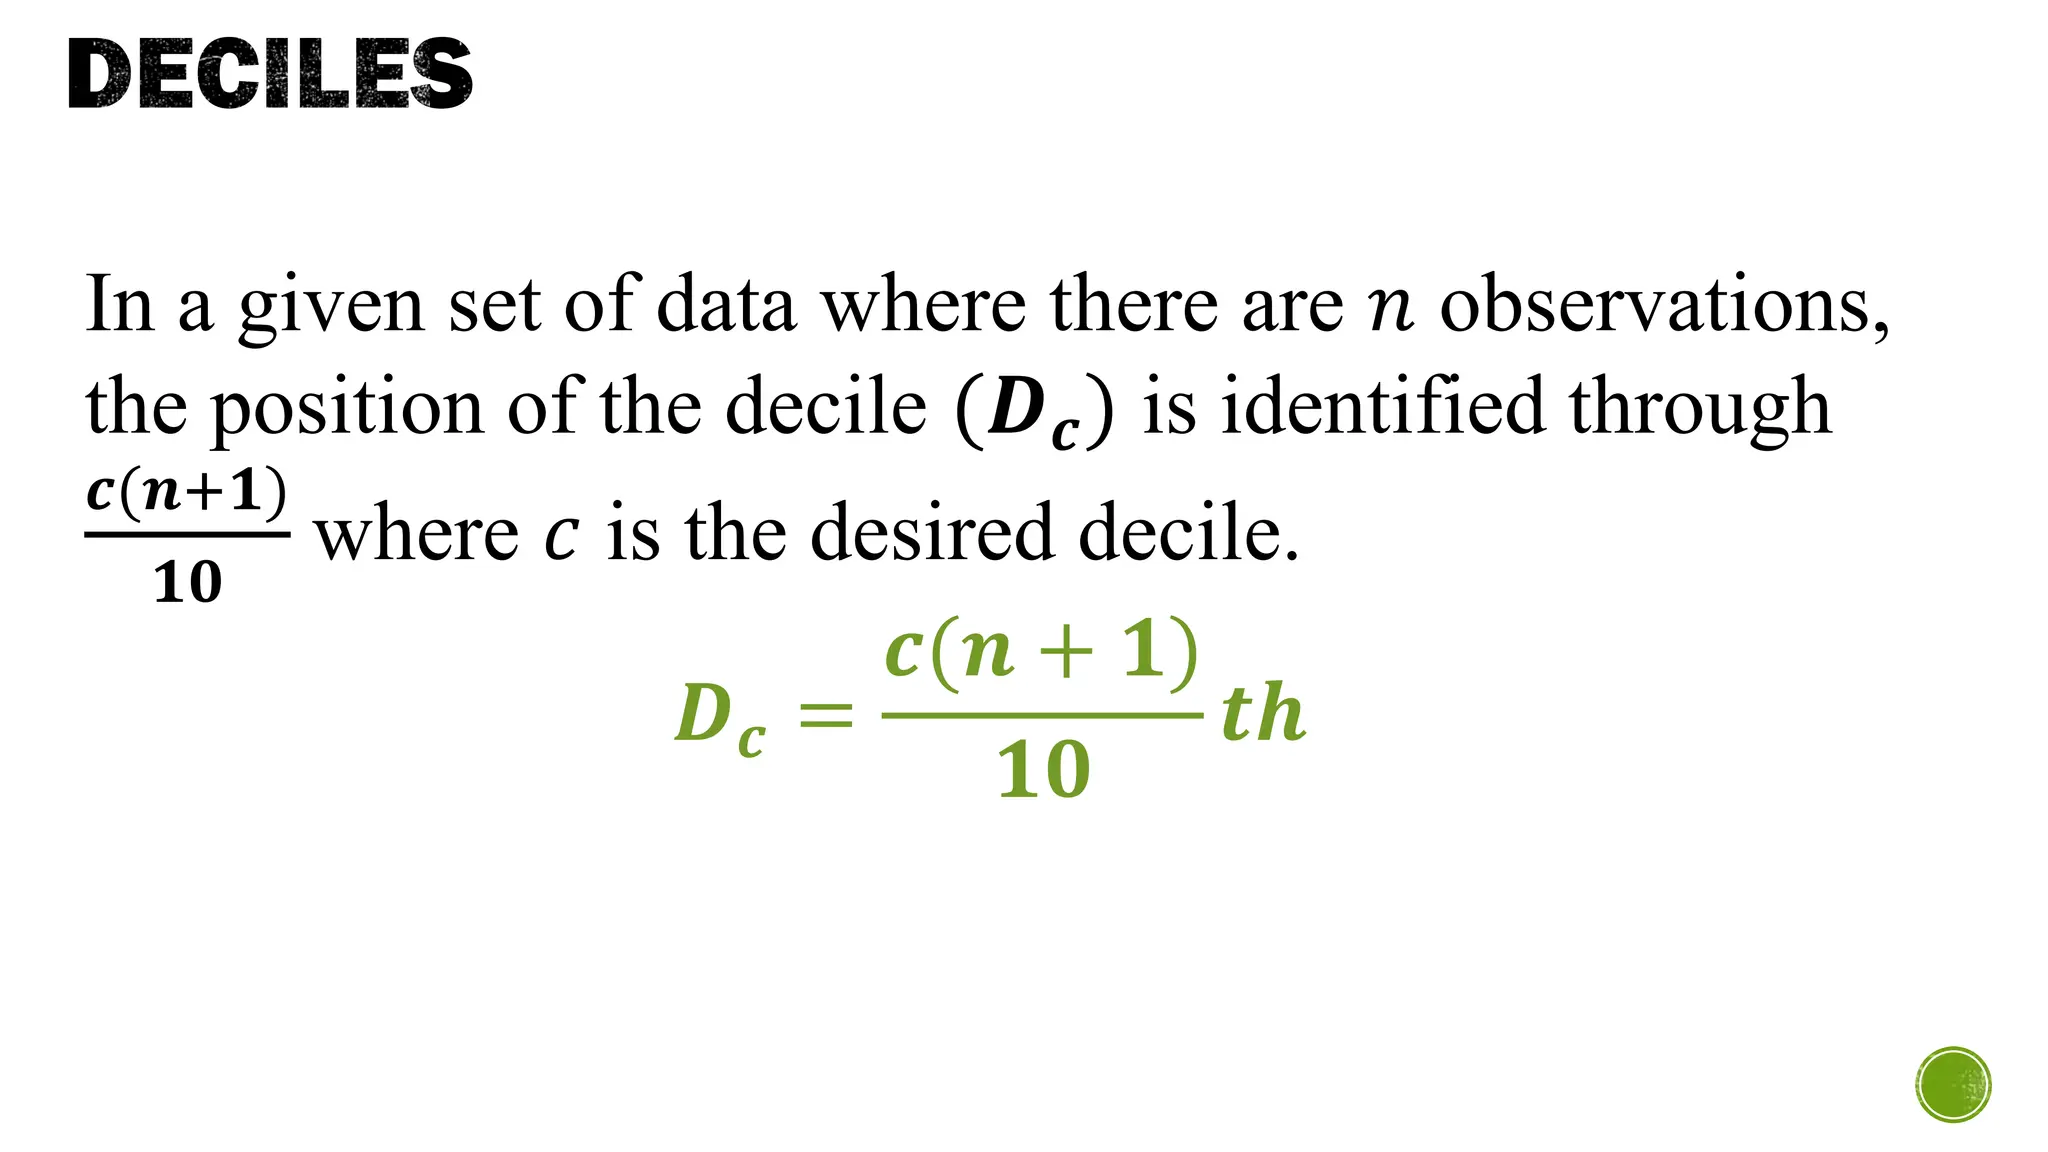
In a givenset of data where there are 𝑛 observations,
the position of the decile (𝑫𝒄) is identified through
𝒄(𝒏+𝟏)
𝟏𝟎
where 𝑐 is the desired decile.
𝑫𝒄 =
𝒄(𝒏 + 𝟏)
𝟏𝟎
𝒕𝒉
26.
DECILES
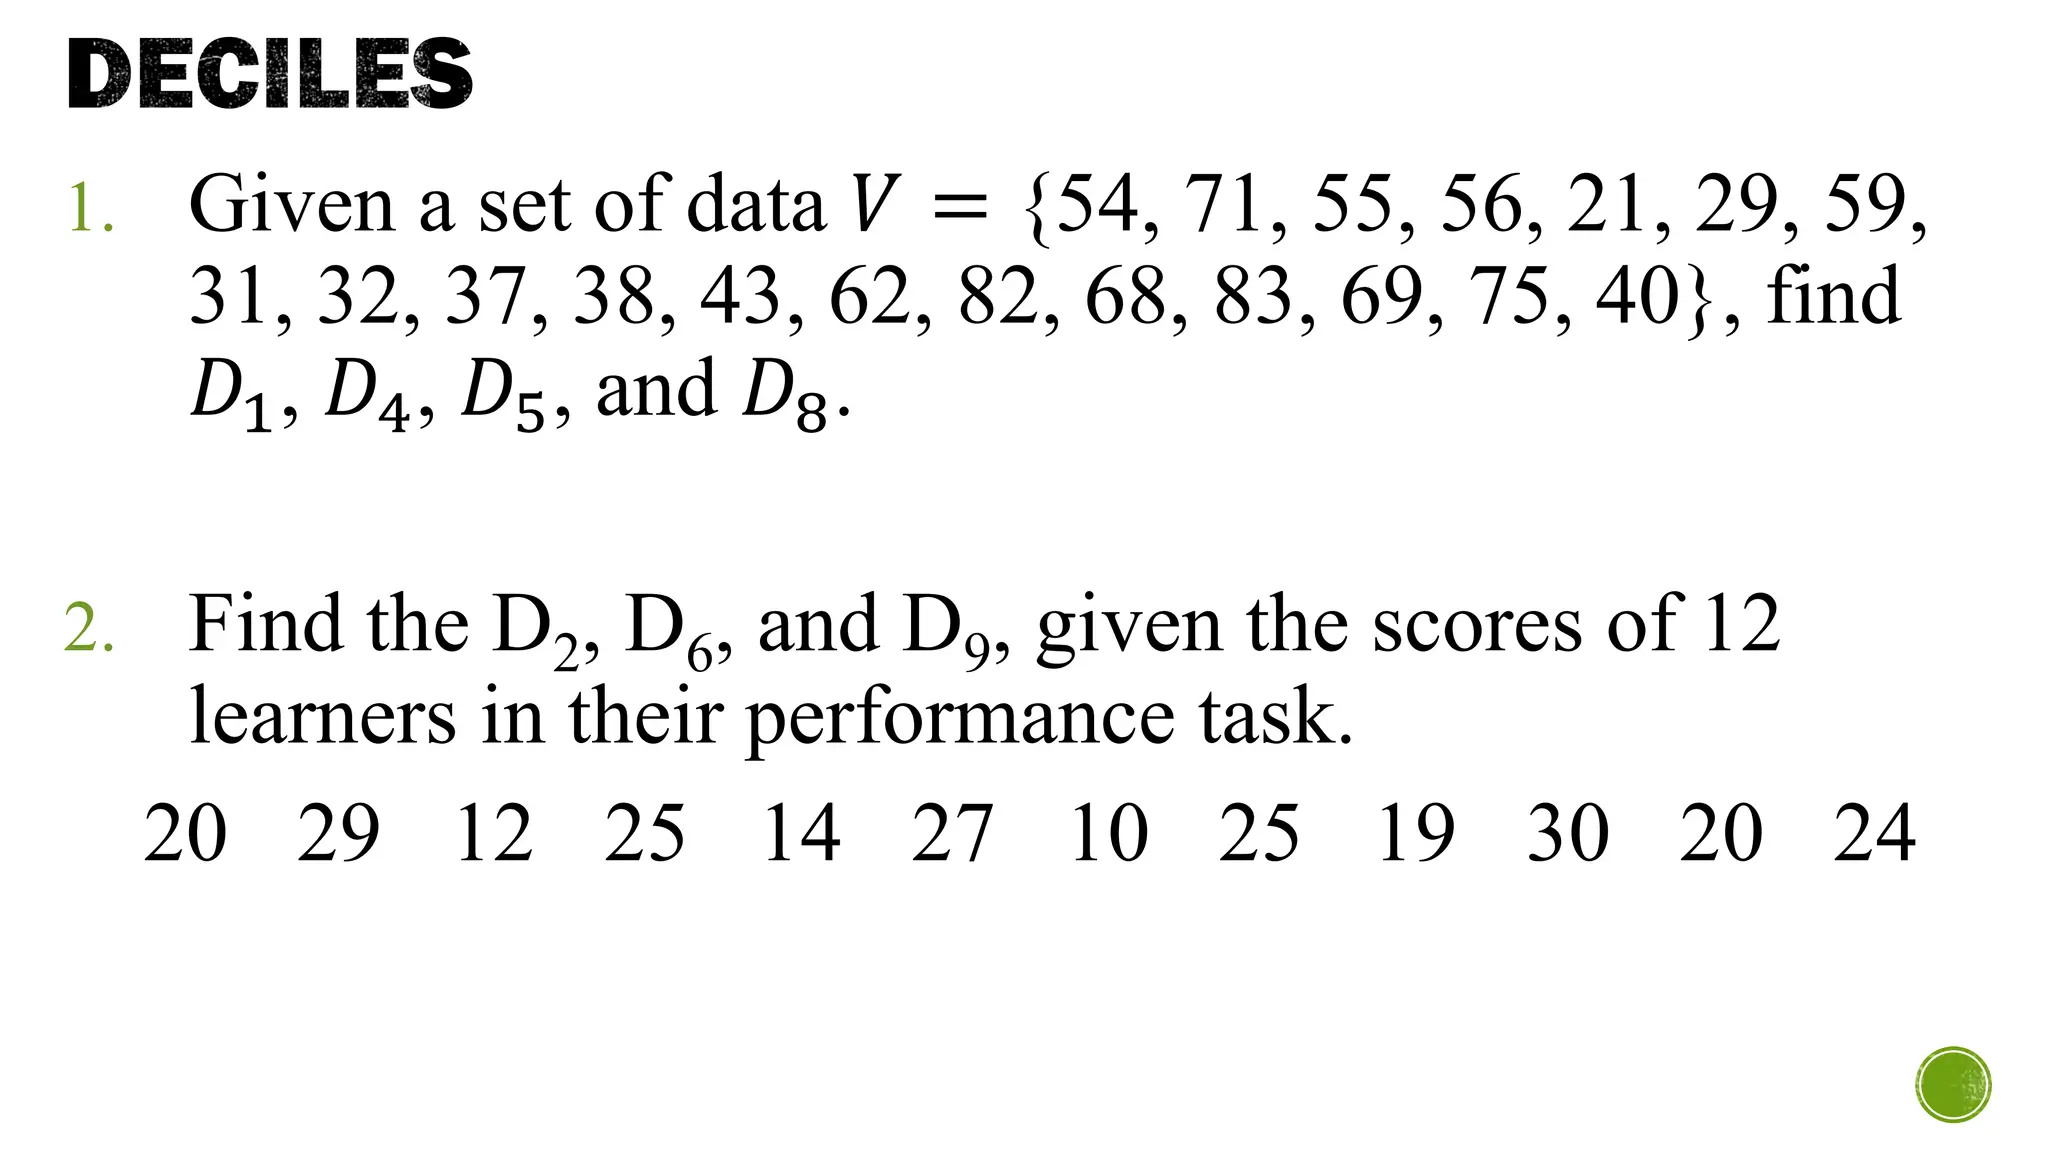
1. Given aset of data 𝑉 = {54, 71, 55, 56, 21, 29, 59,
31, 32, 37, 38, 43, 62, 82, 68, 83, 69, 75, 40}, find
𝐷1, 𝐷4, 𝐷5, and 𝐷8.
2. Find the D2, D6, and D9, given the scores of 12
learners in their performance task.
20 29 12 25 14 27 10 25 19 30 20 24
27.
PERCENTILES
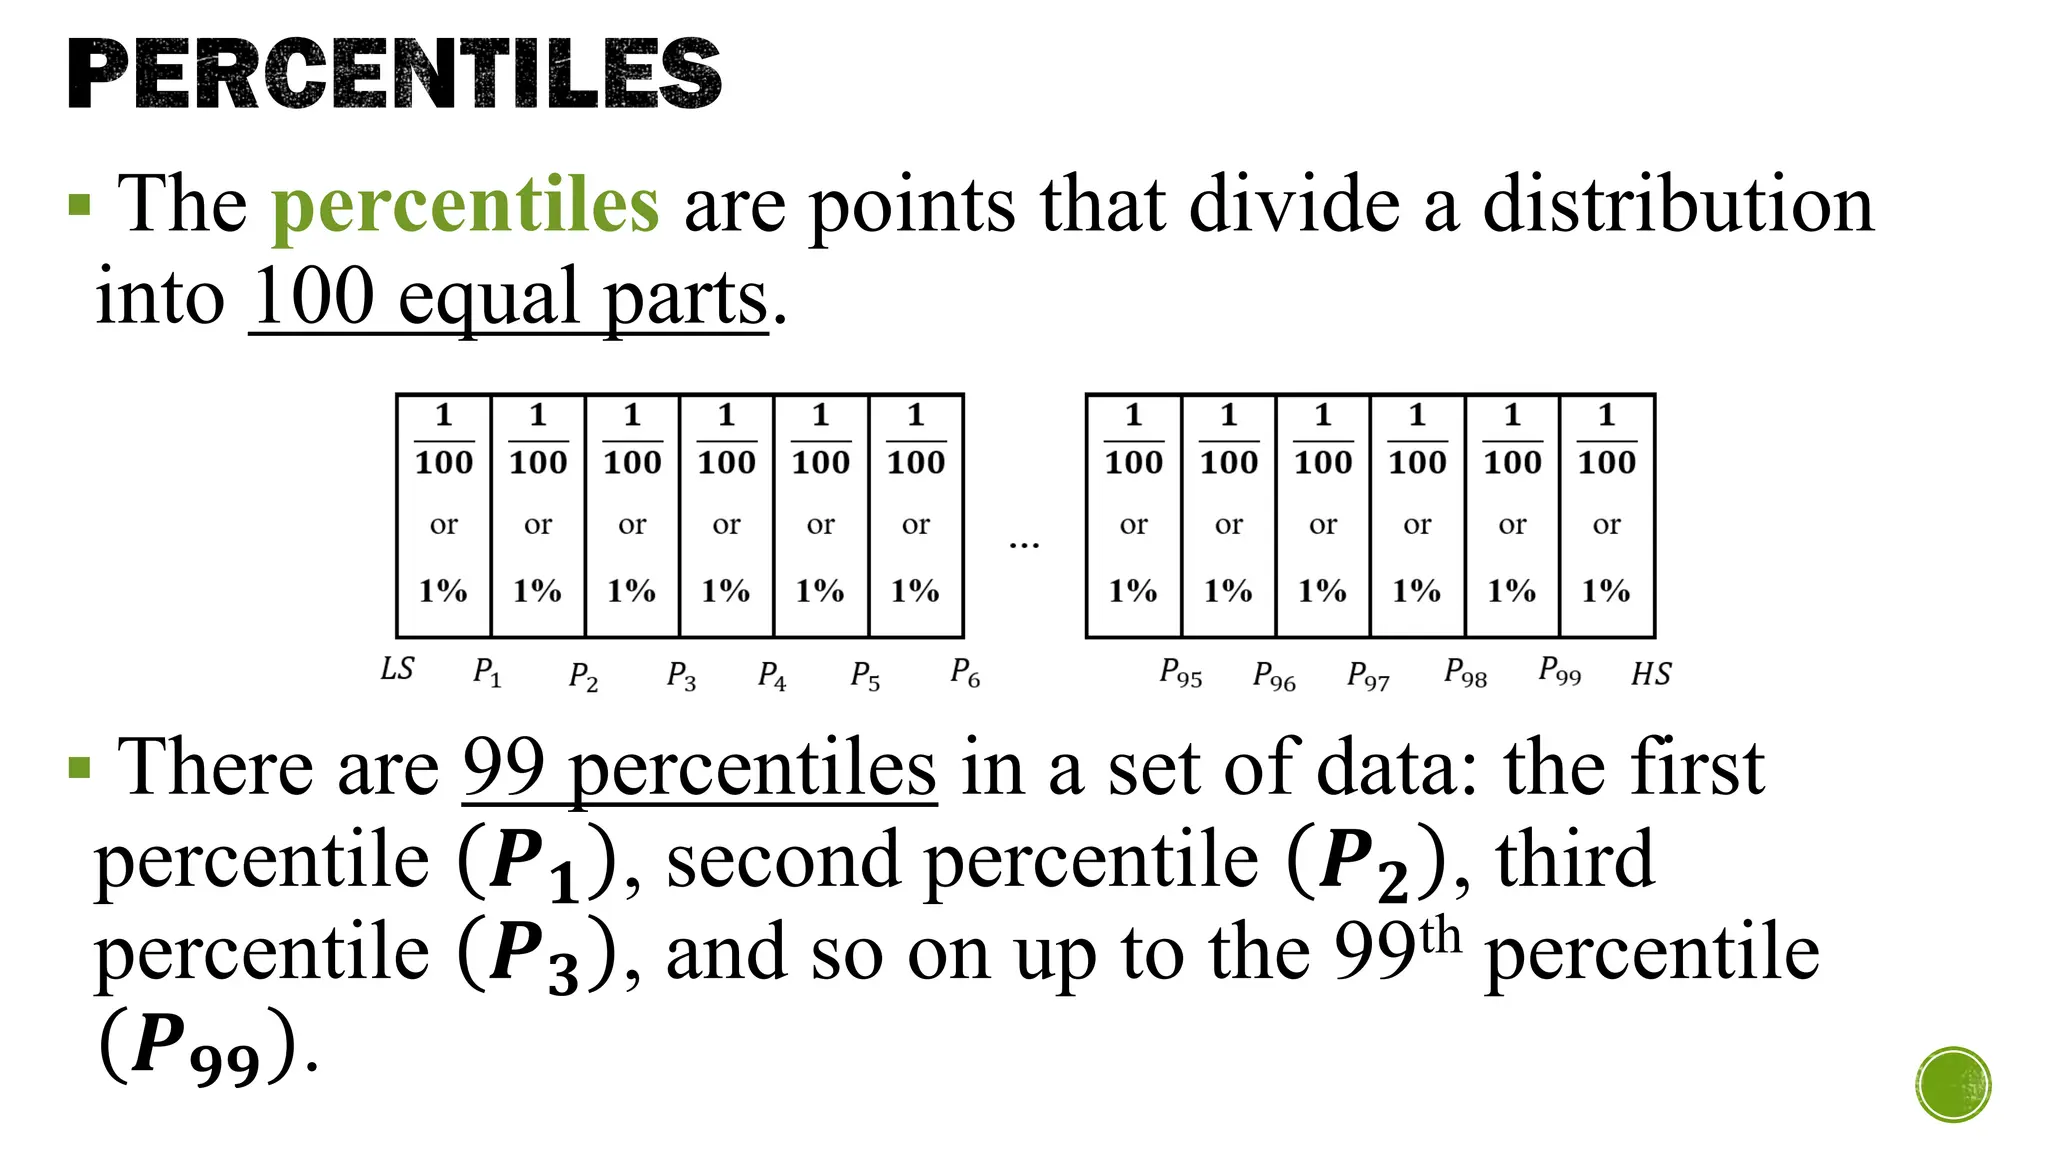
▪ The percentilesare points that divide a distribution
into 100 equal parts.
▪ There are 99 percentiles in a set of data: the first
percentile 𝑷𝟏 , second percentile 𝑷𝟐 , third
percentile 𝑷𝟑 , and so on up to the 99th percentile
𝑷𝟗𝟗 .
28.
PERCENTILES
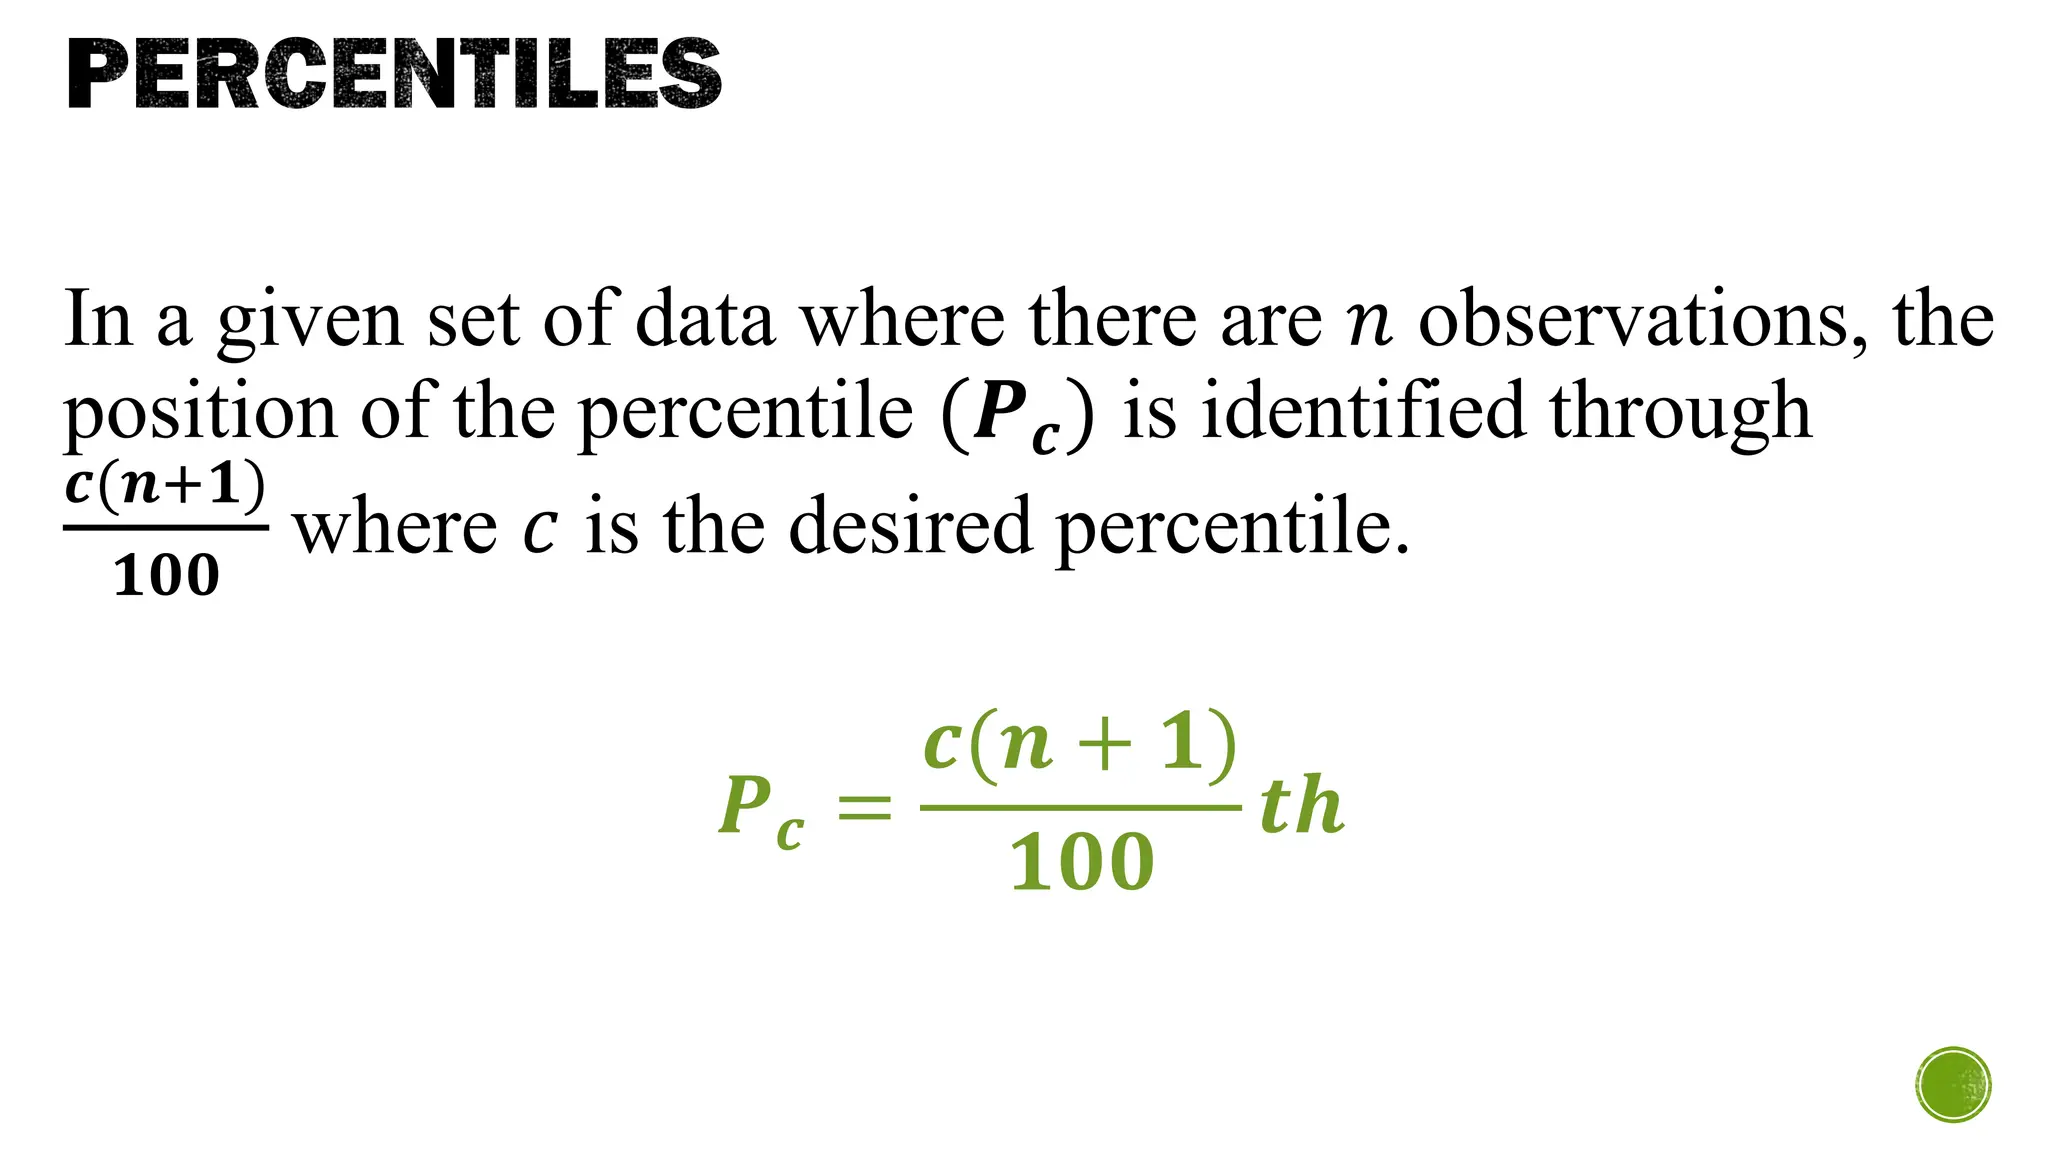
In a givenset of data where there are 𝑛 observations, the
position of the percentile (𝑷𝒄) is identified through
𝒄(𝒏+𝟏)
𝟏𝟎𝟎
where 𝑐 is the desired percentile.
𝑷𝒄 =
𝒄(𝒏 + 𝟏)
𝟏𝟎𝟎
𝒕𝒉
29.
PERCENTILES
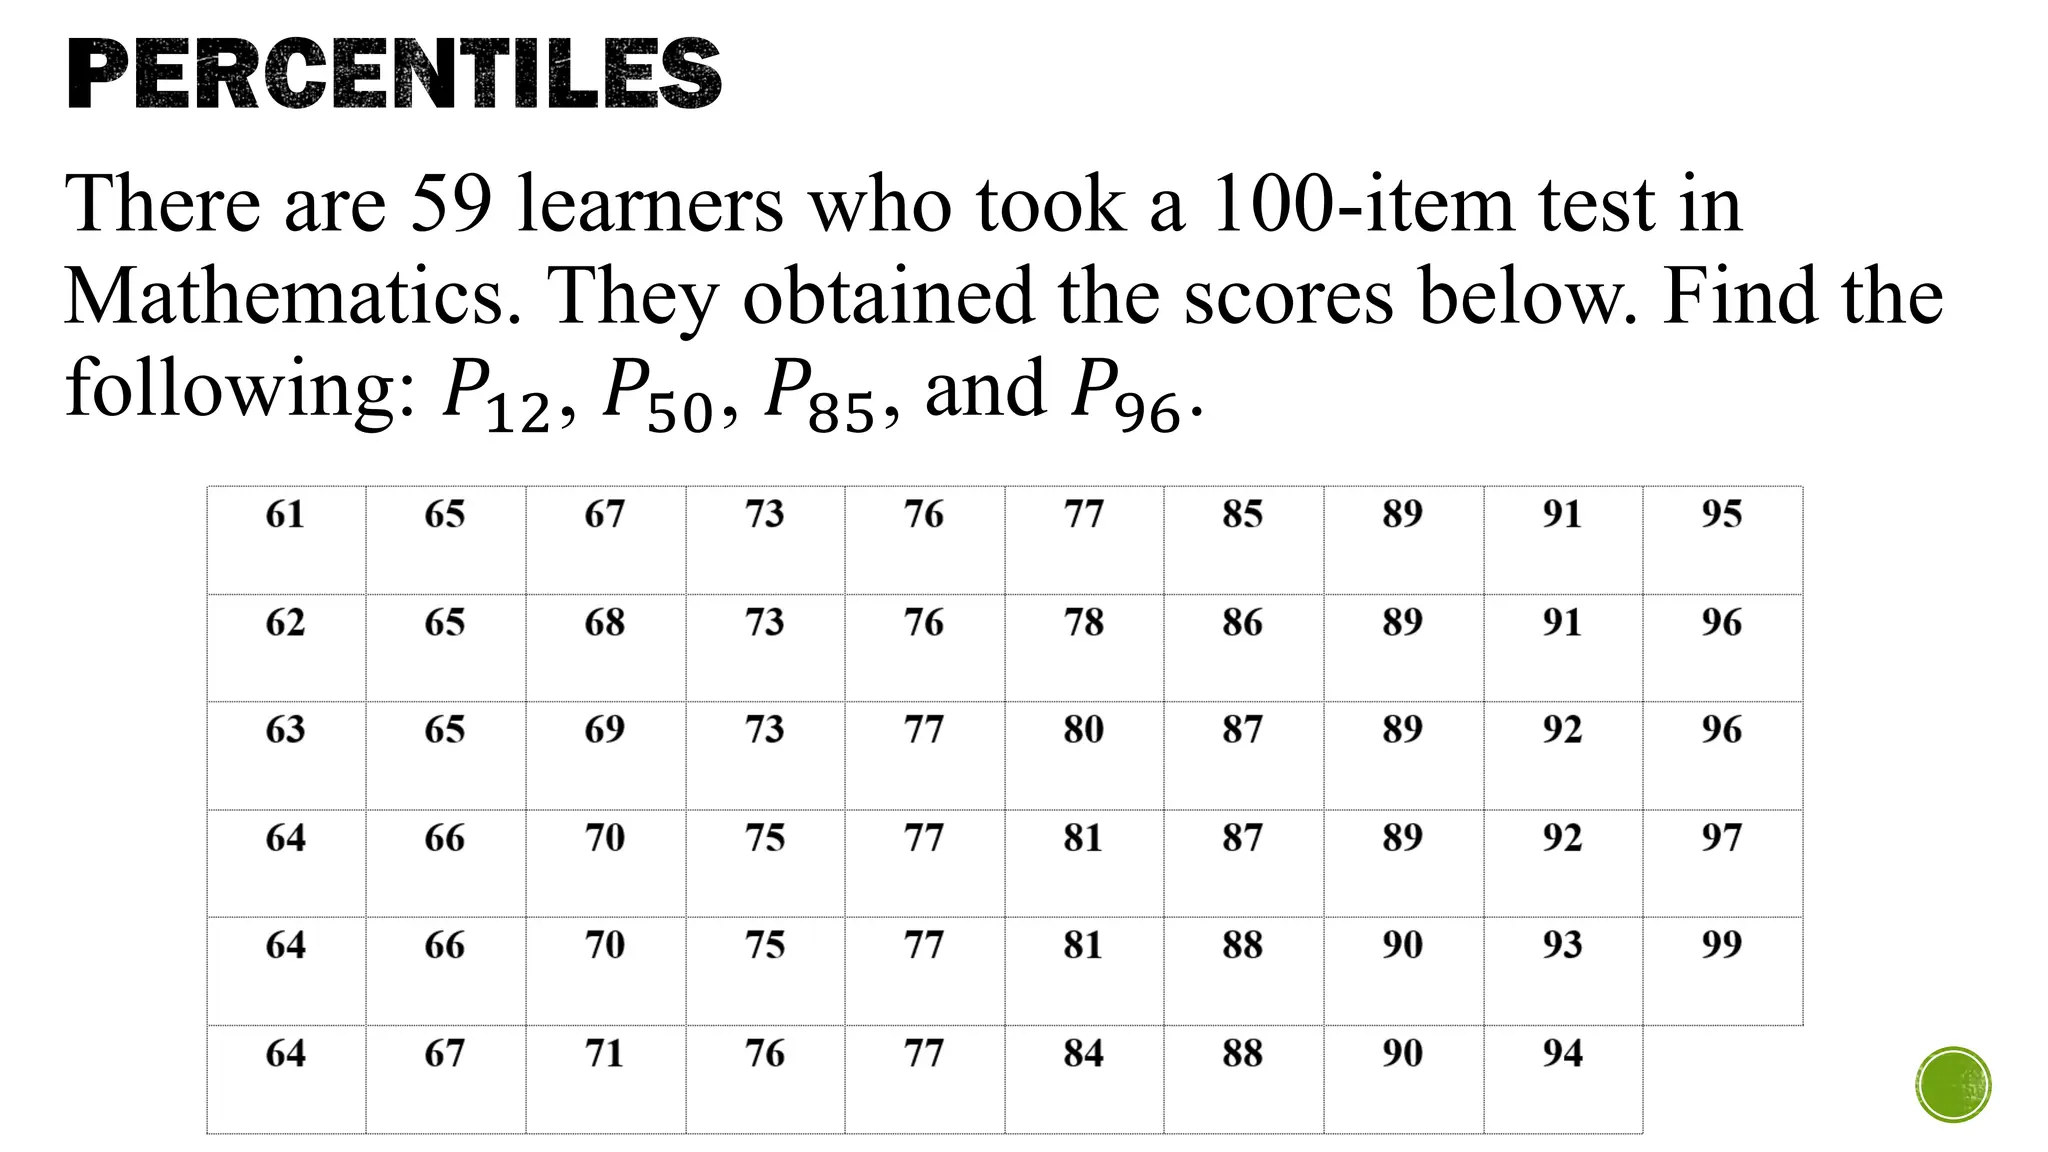
There are 59learners who took a 100-item test in
Mathematics. They obtained the scores below. Find the
following: 𝑃12, 𝑃50, 𝑃85, and 𝑃96.
30.
MEASURES OF POSITION
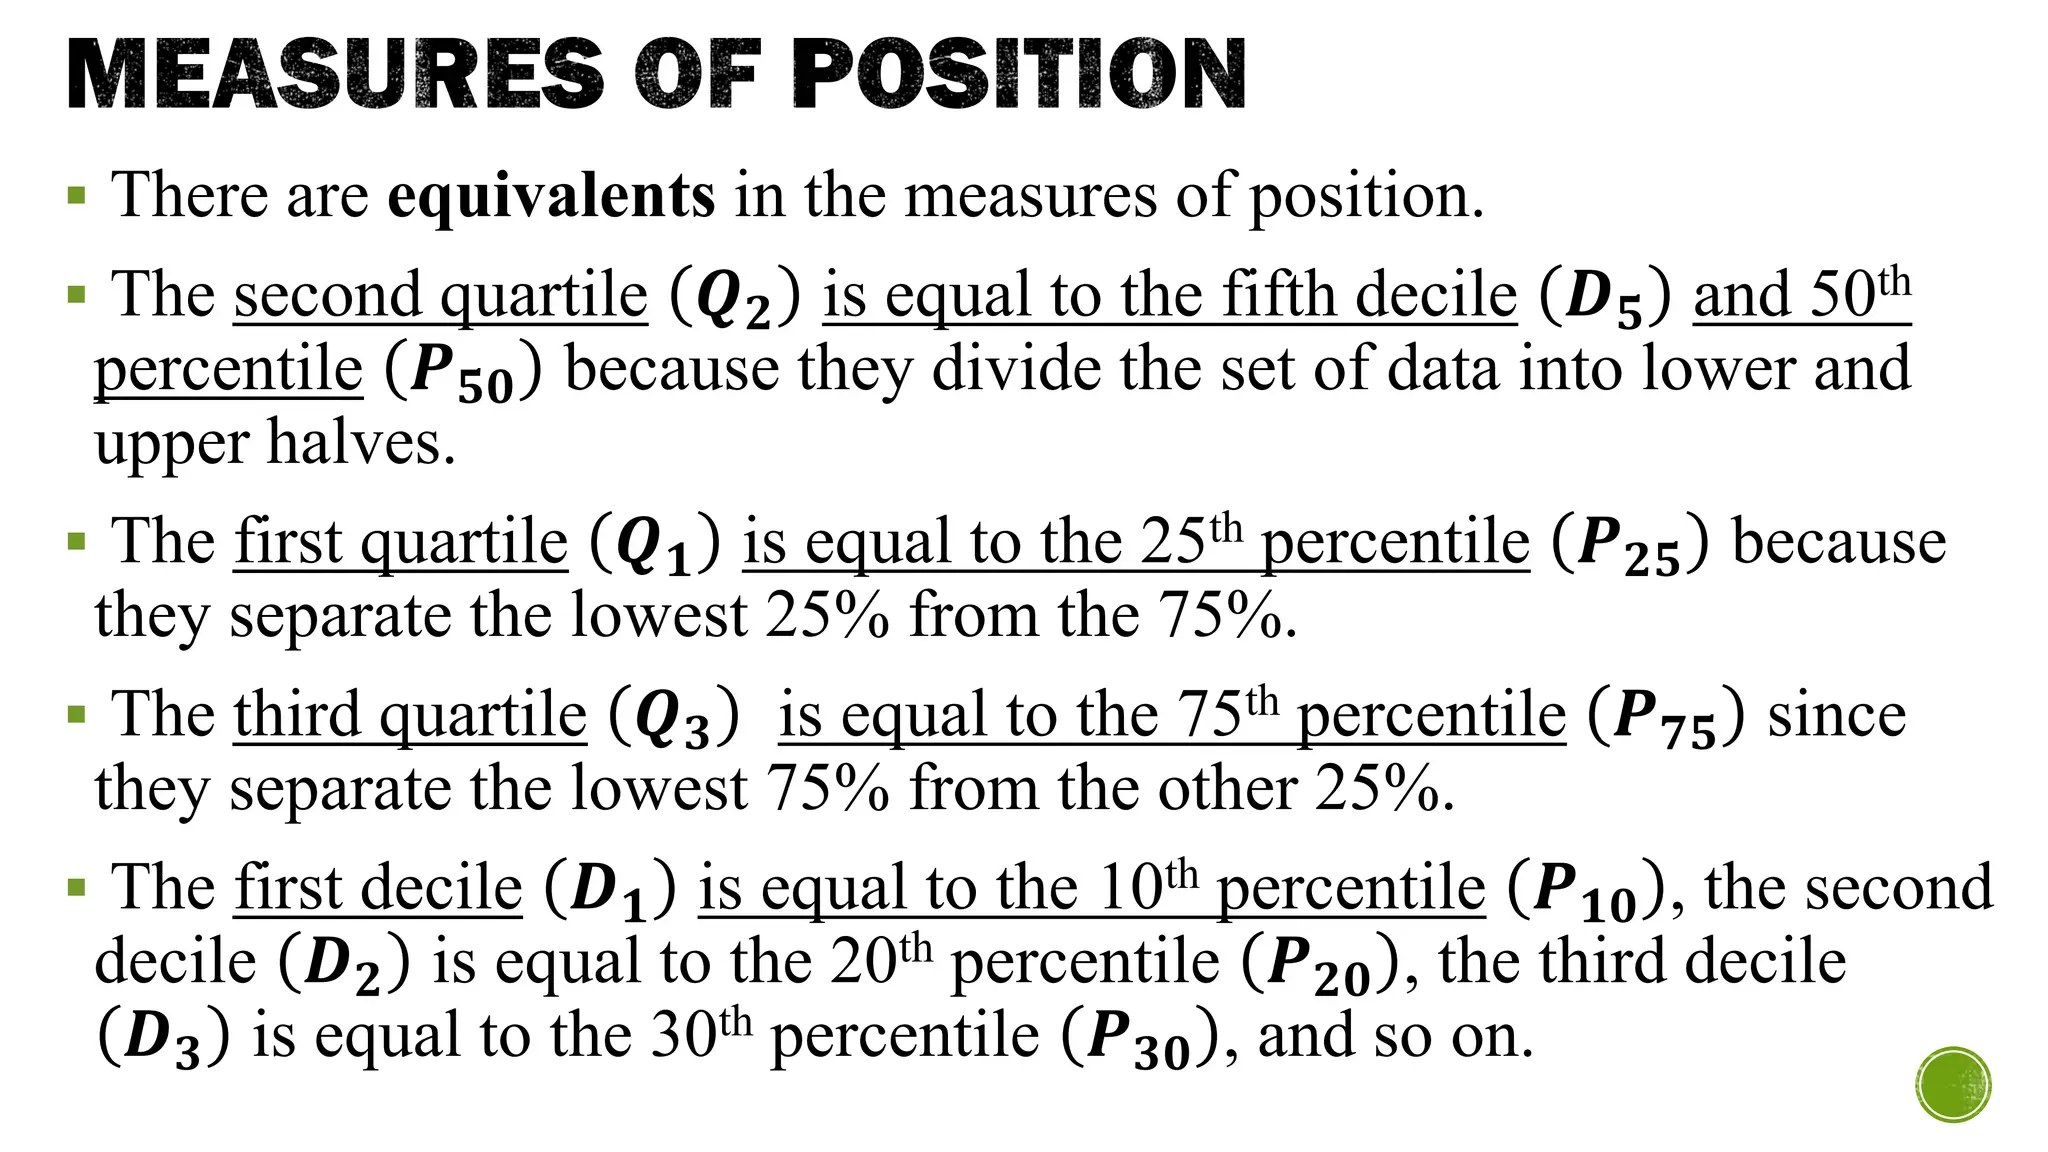
▪There are equivalents in the measures of position.
▪ The second quartile 𝑸𝟐 is equal to the fifth decile 𝑫𝟓 and 50th
percentile 𝑷𝟓𝟎 because they divide the set of data into lower and
upper halves.
▪ The first quartile 𝑸𝟏 is equal to the 25th percentile 𝑷𝟐𝟓 because
they separate the lowest 25% from the 75%.
▪ The third quartile 𝑸𝟑 is equal to the 75th percentile 𝑷𝟕𝟓 since
they separate the lowest 75% from the other 25%.
▪ The first decile 𝑫𝟏 is equal to the 10th percentile 𝑷𝟏𝟎 , the second
decile 𝑫𝟐 is equal to the 20th percentile 𝑷𝟐𝟎 , the third decile
𝑫𝟑 is equal to the 30th percentile 𝑷𝟑𝟎 , and so on.
31.
MEASURES OF POSITION
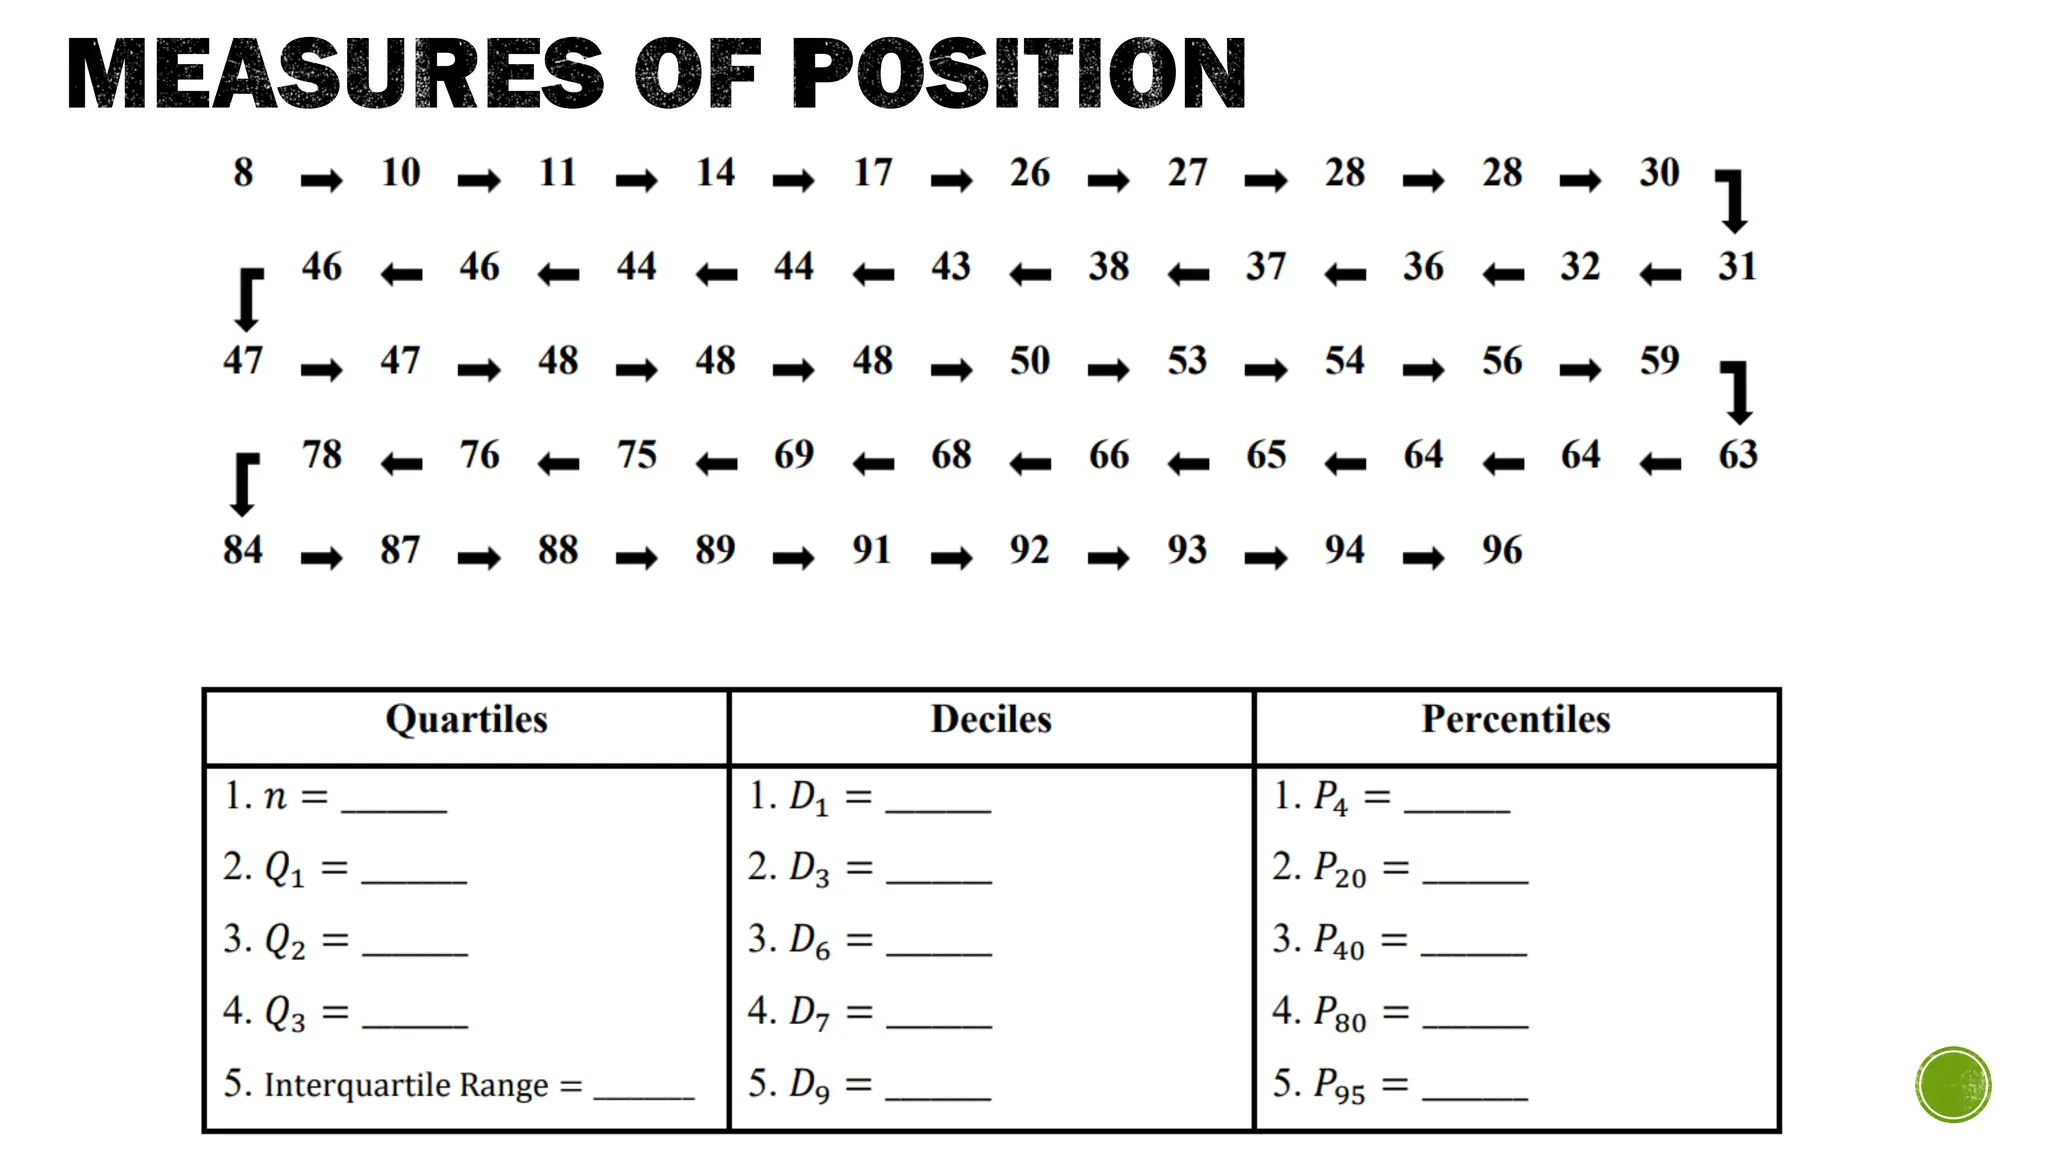
Identifythe value of the specified measure of position.
The given set of data to be used is already arranged in
increasing order of values.
The arrows indicate the arrangement of the values from
the lowest value to the highest one.