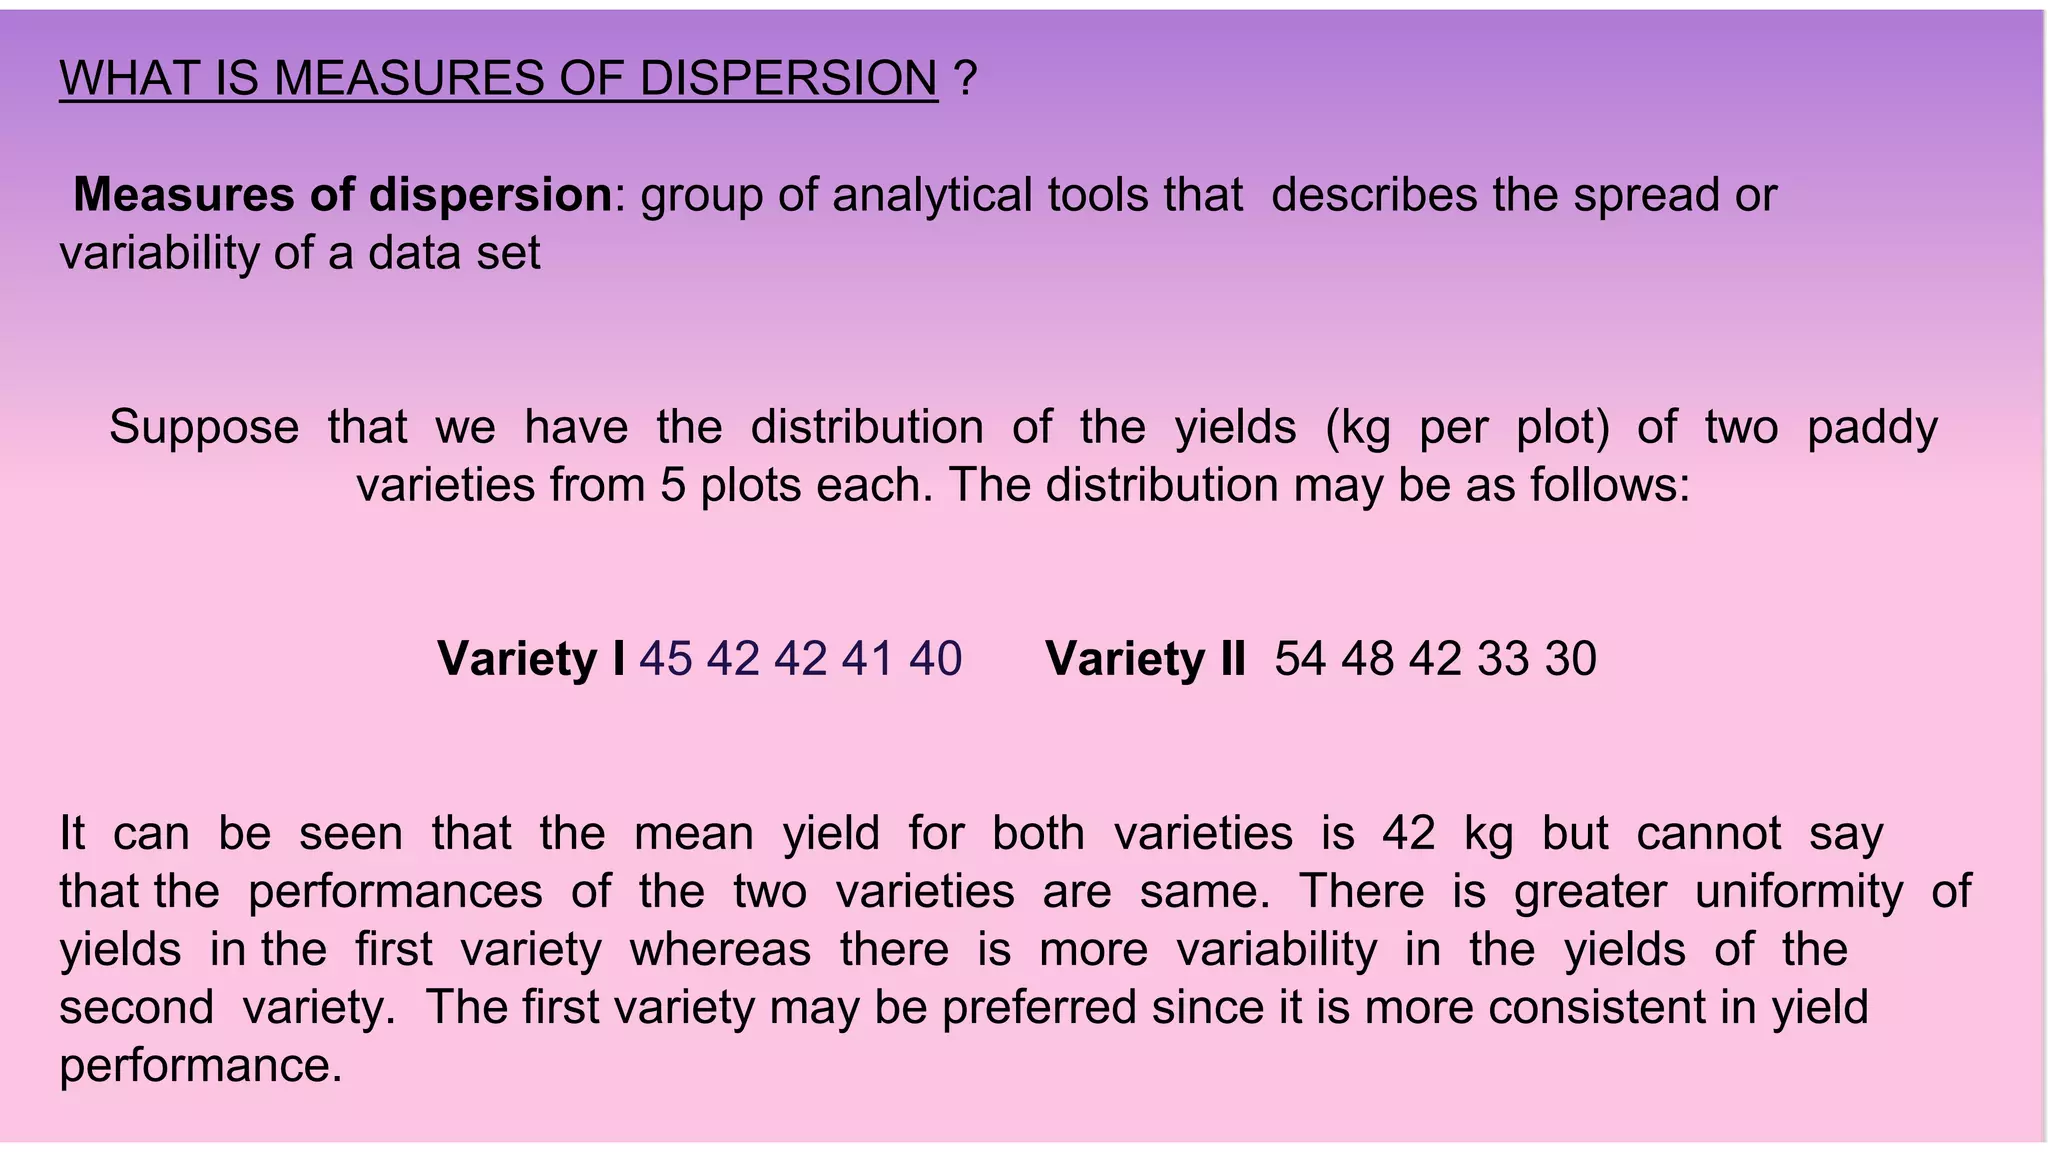
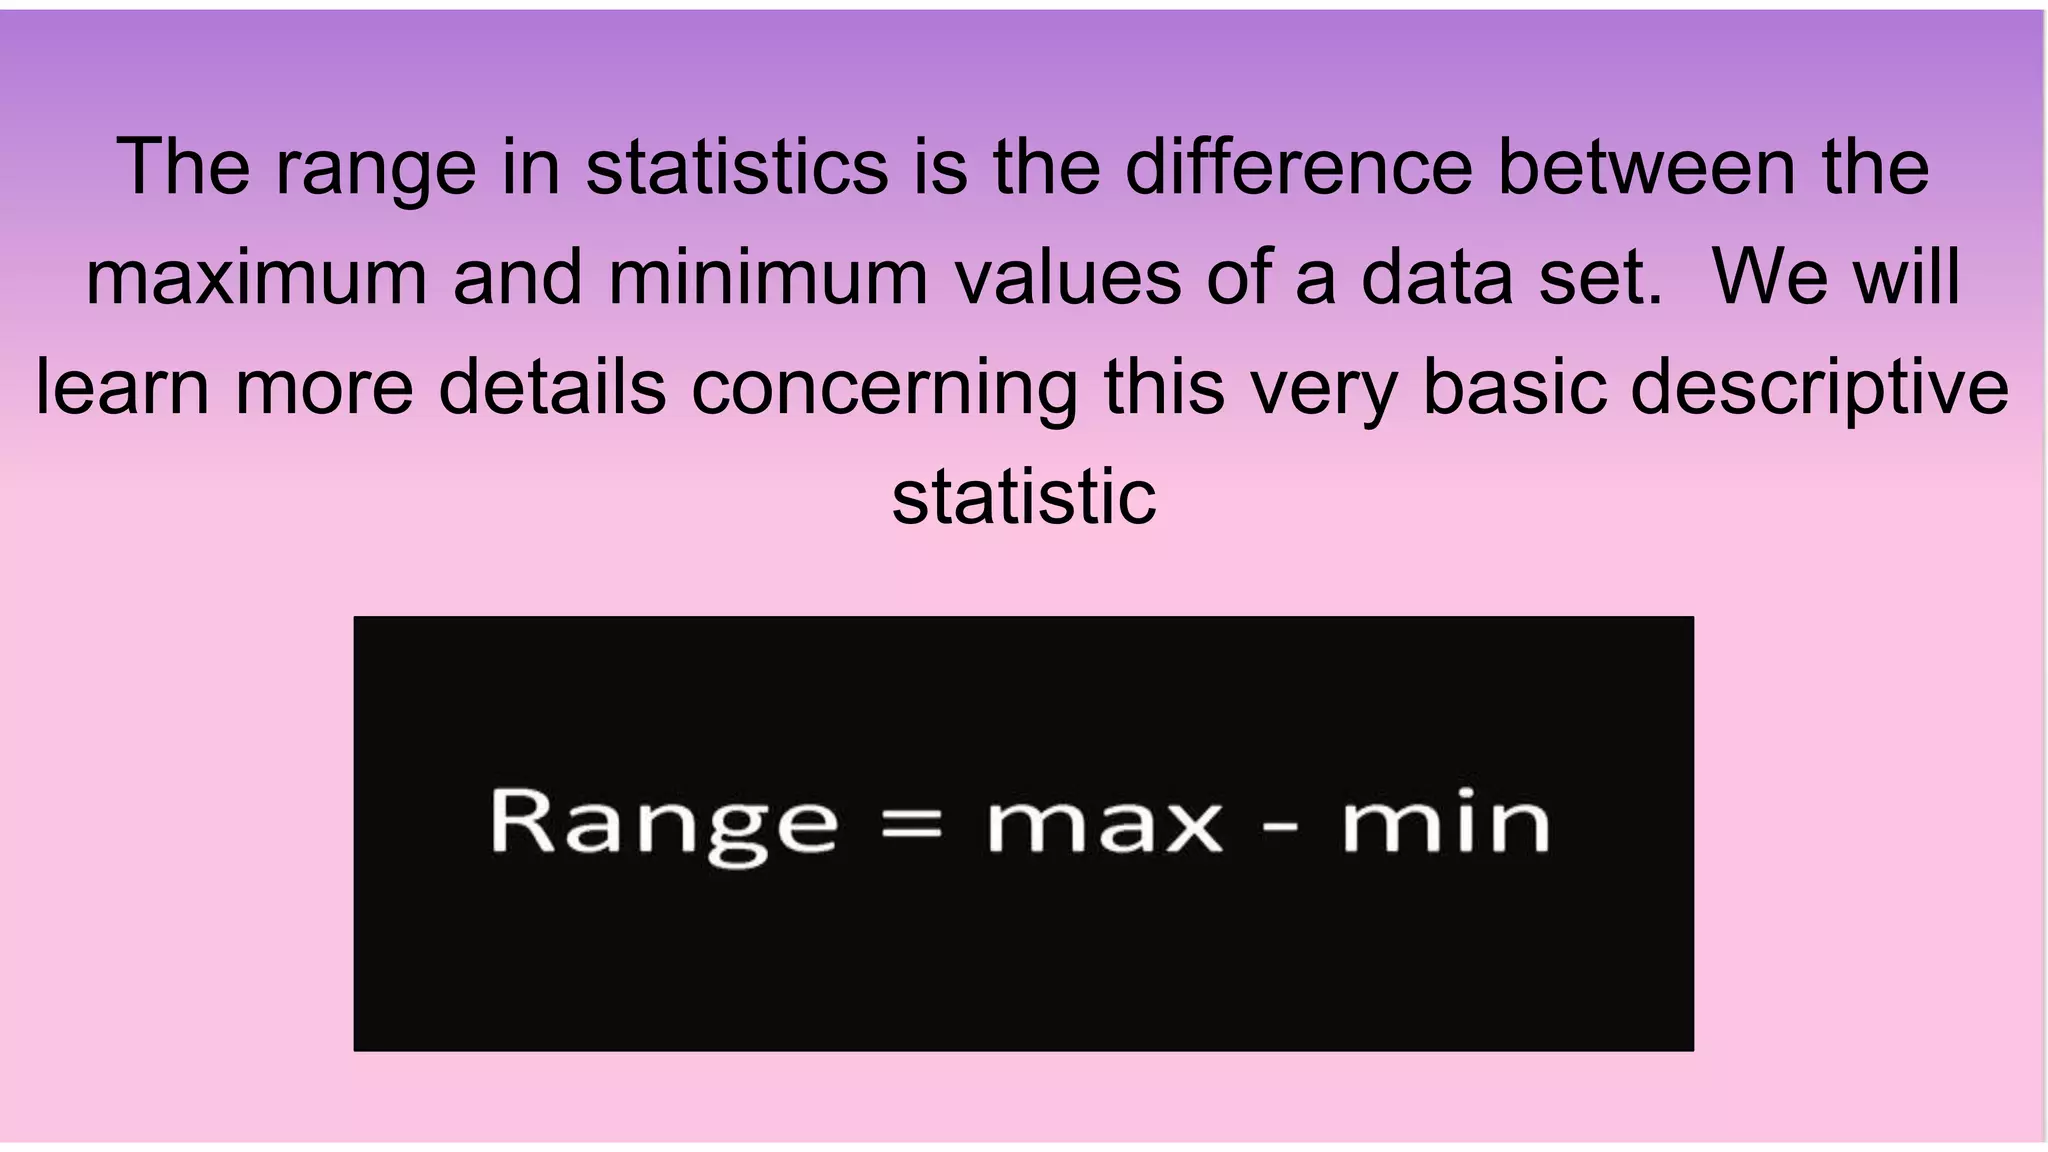
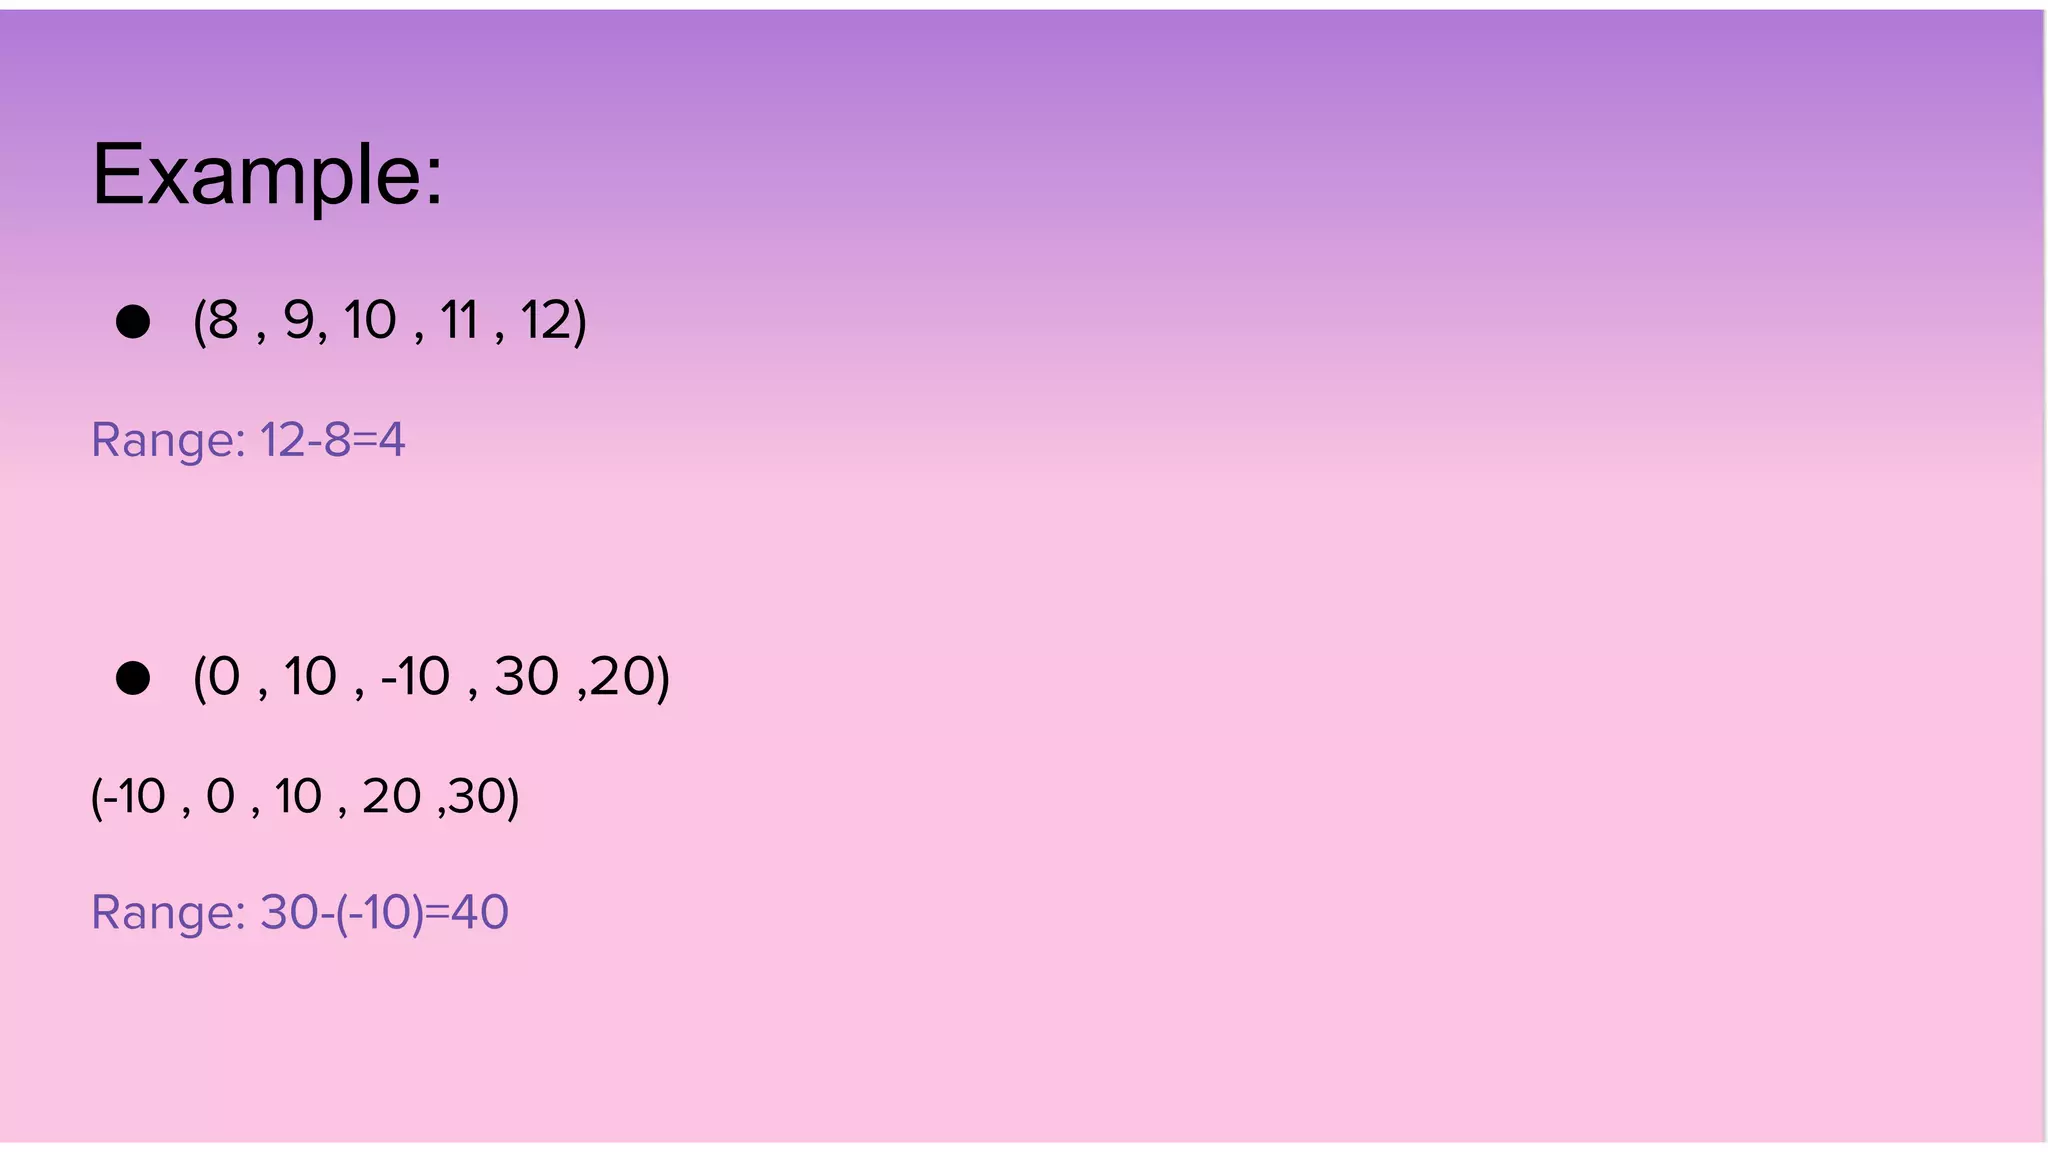
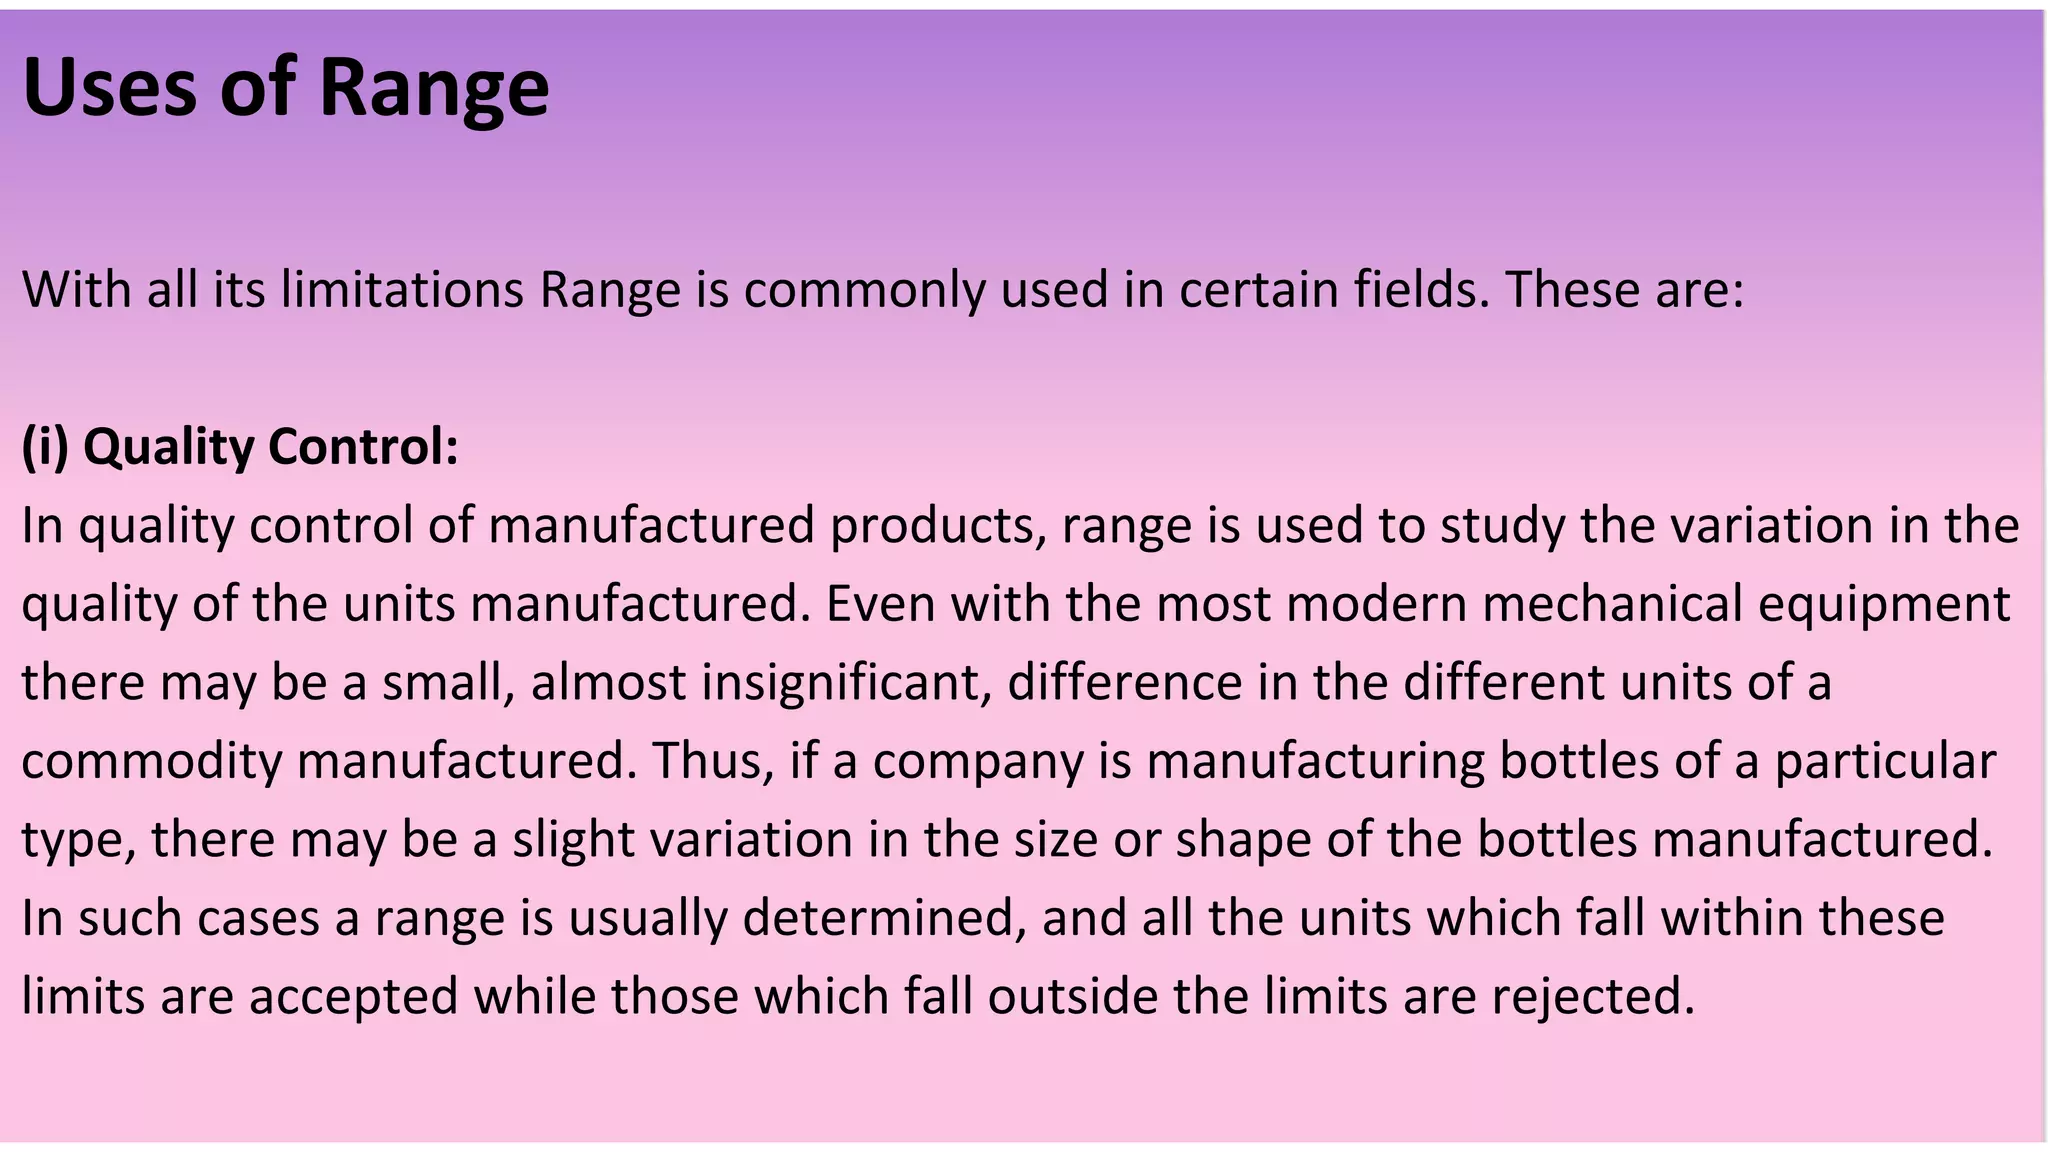
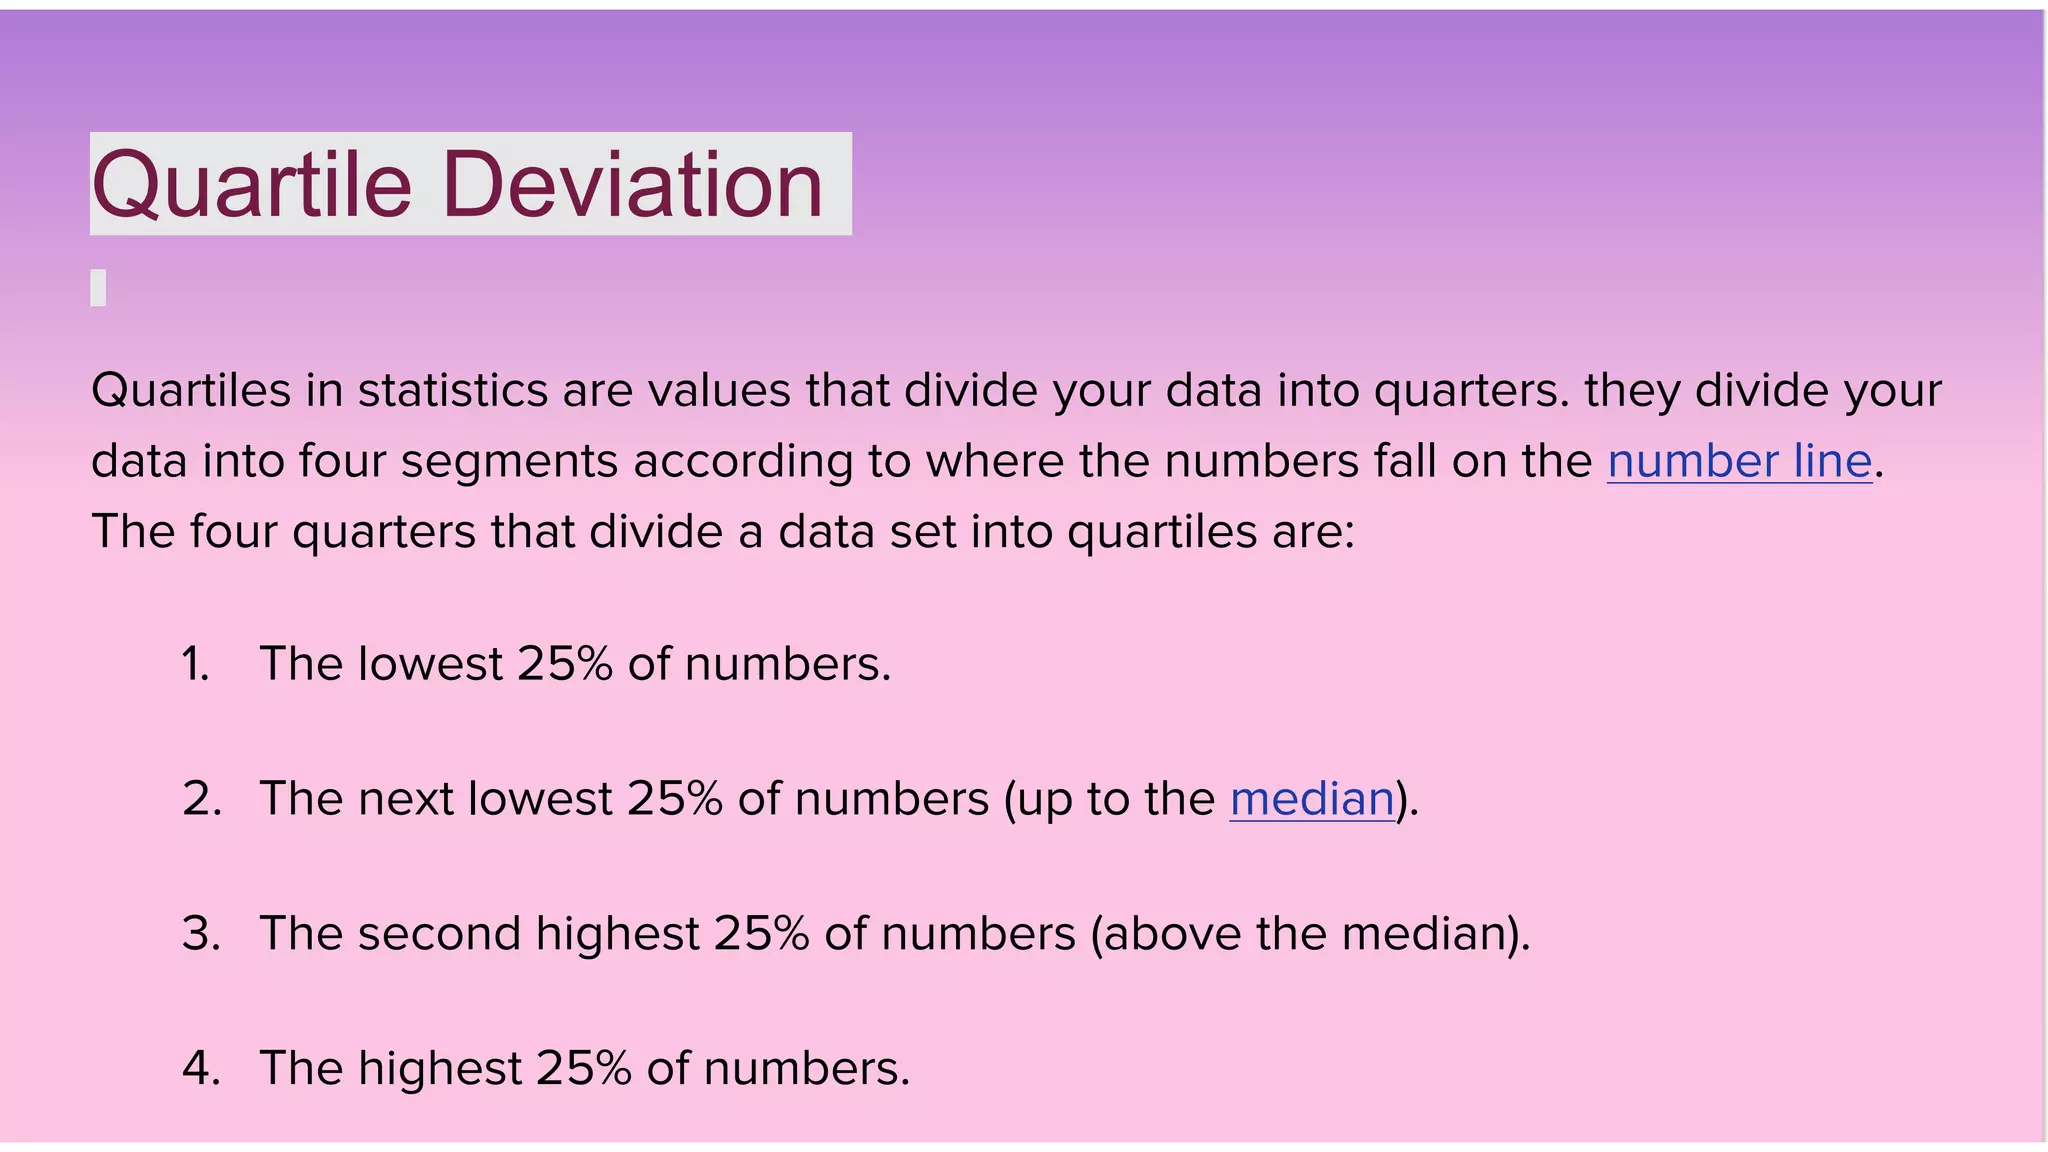
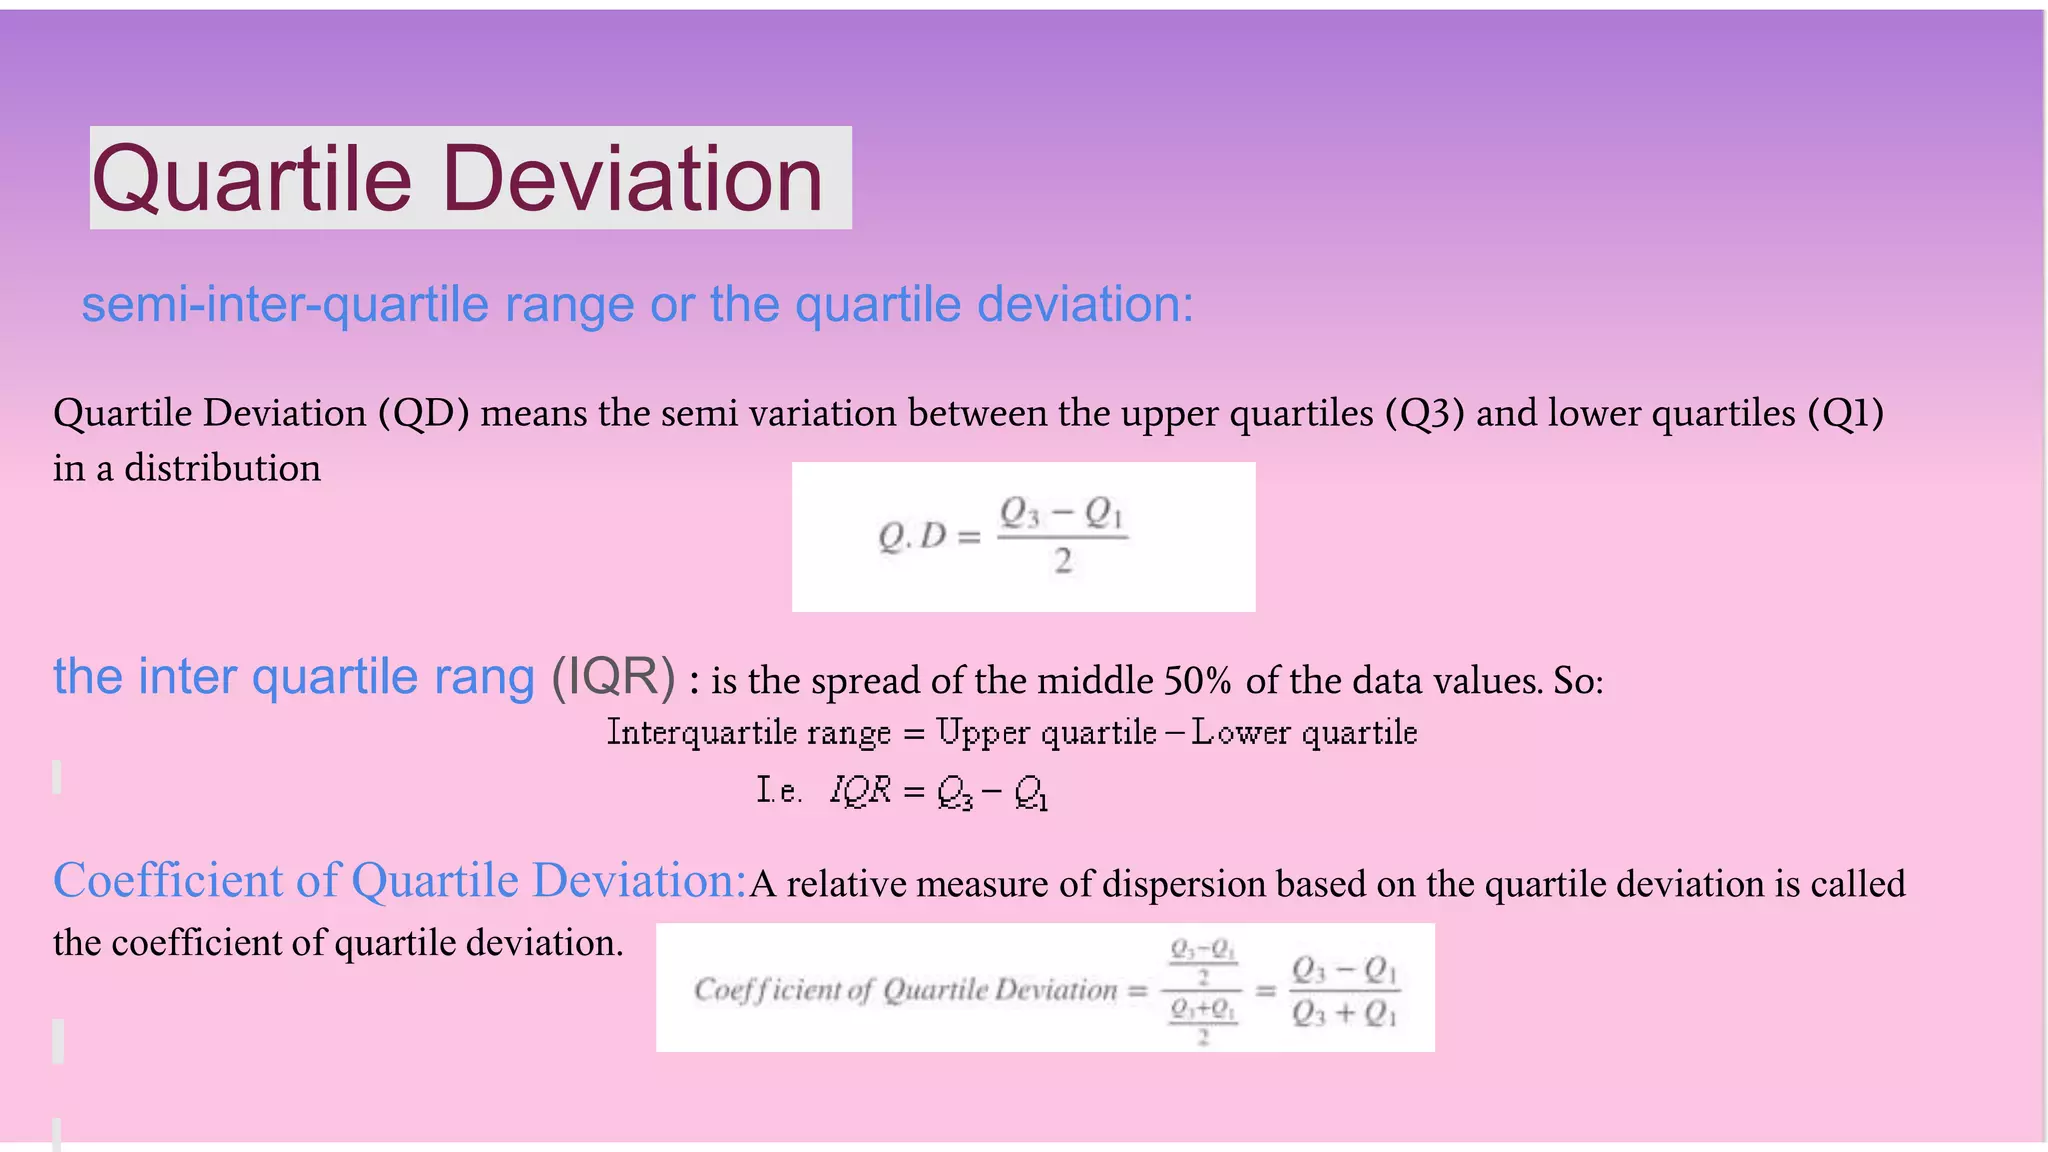
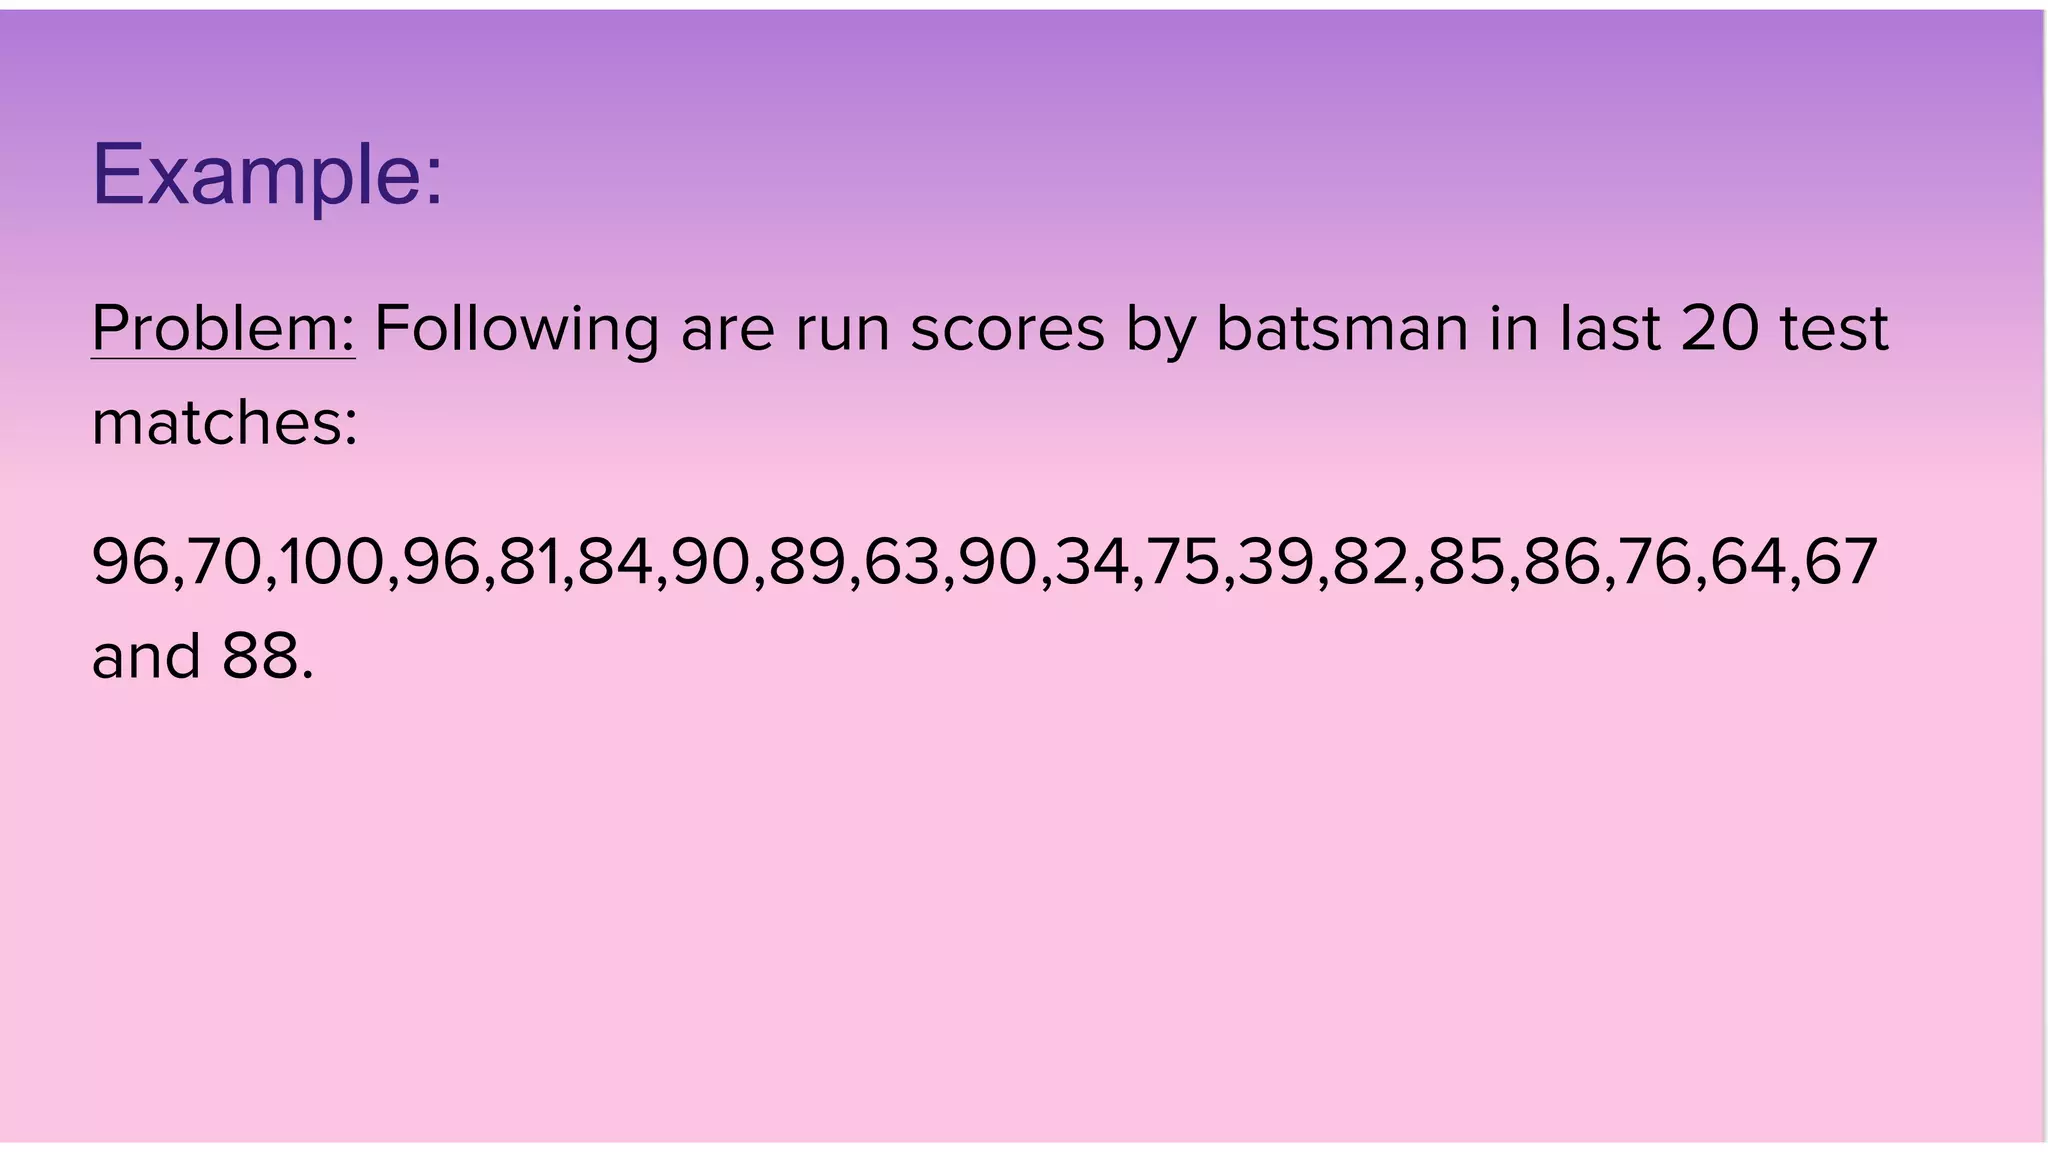
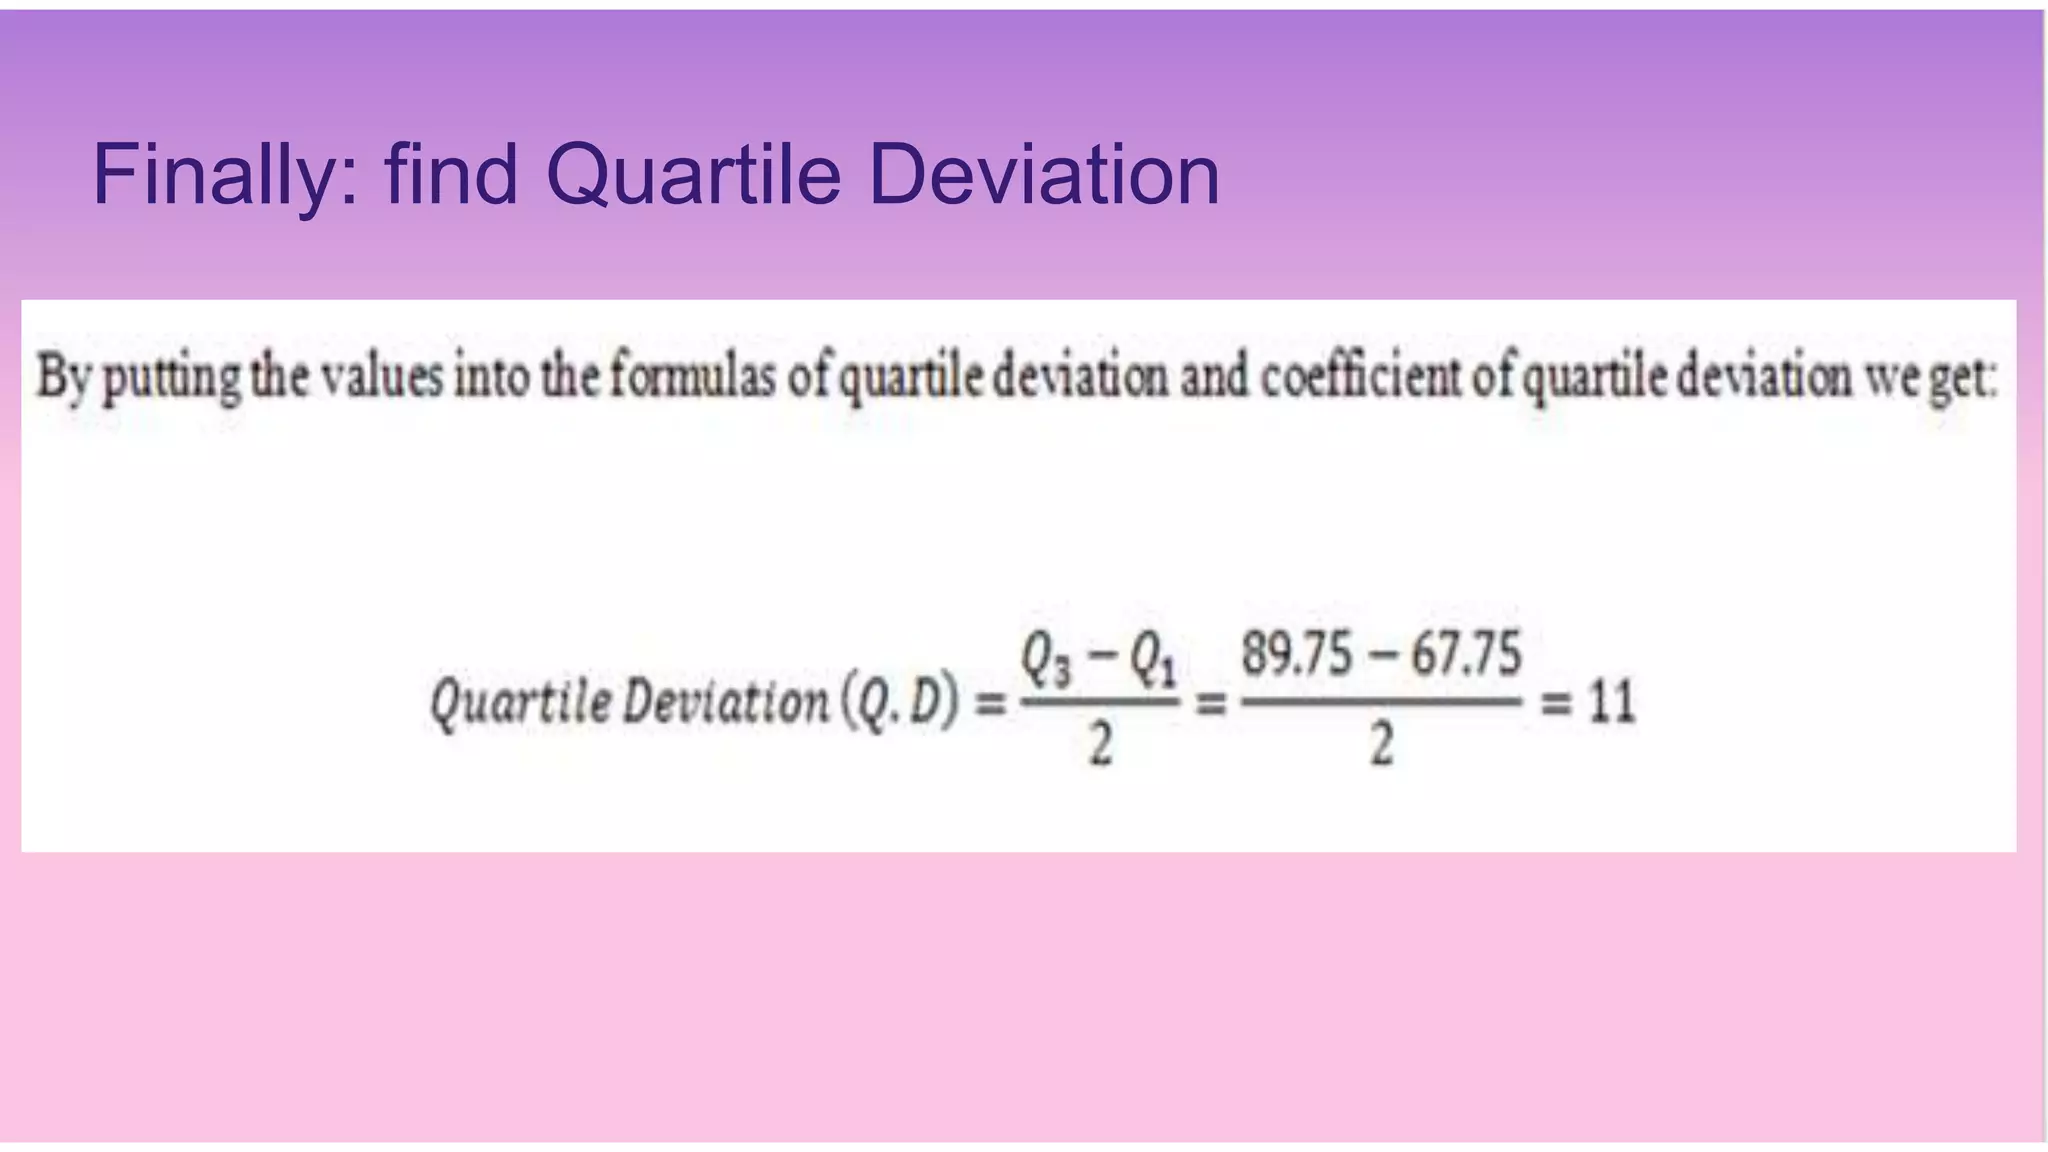
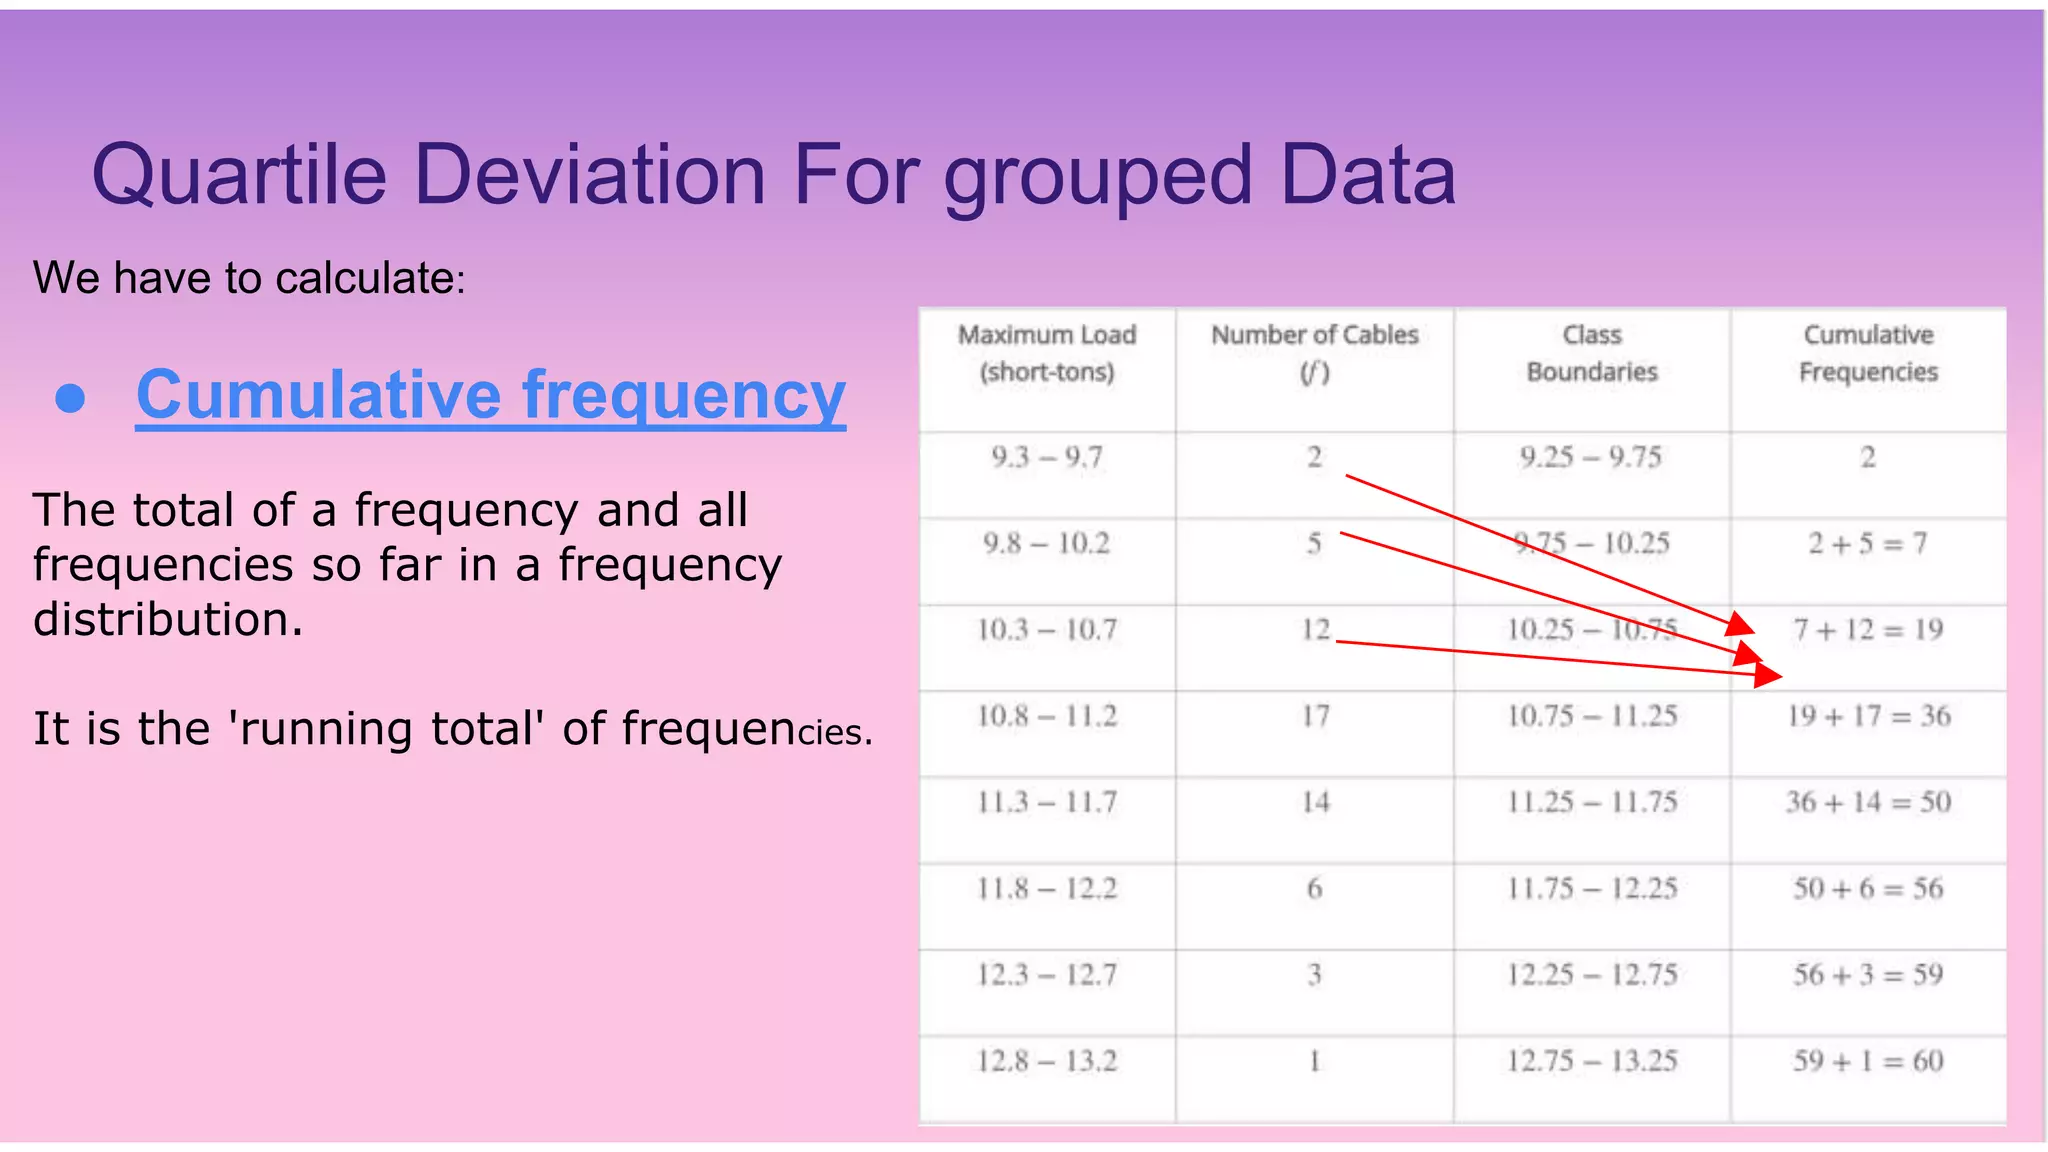
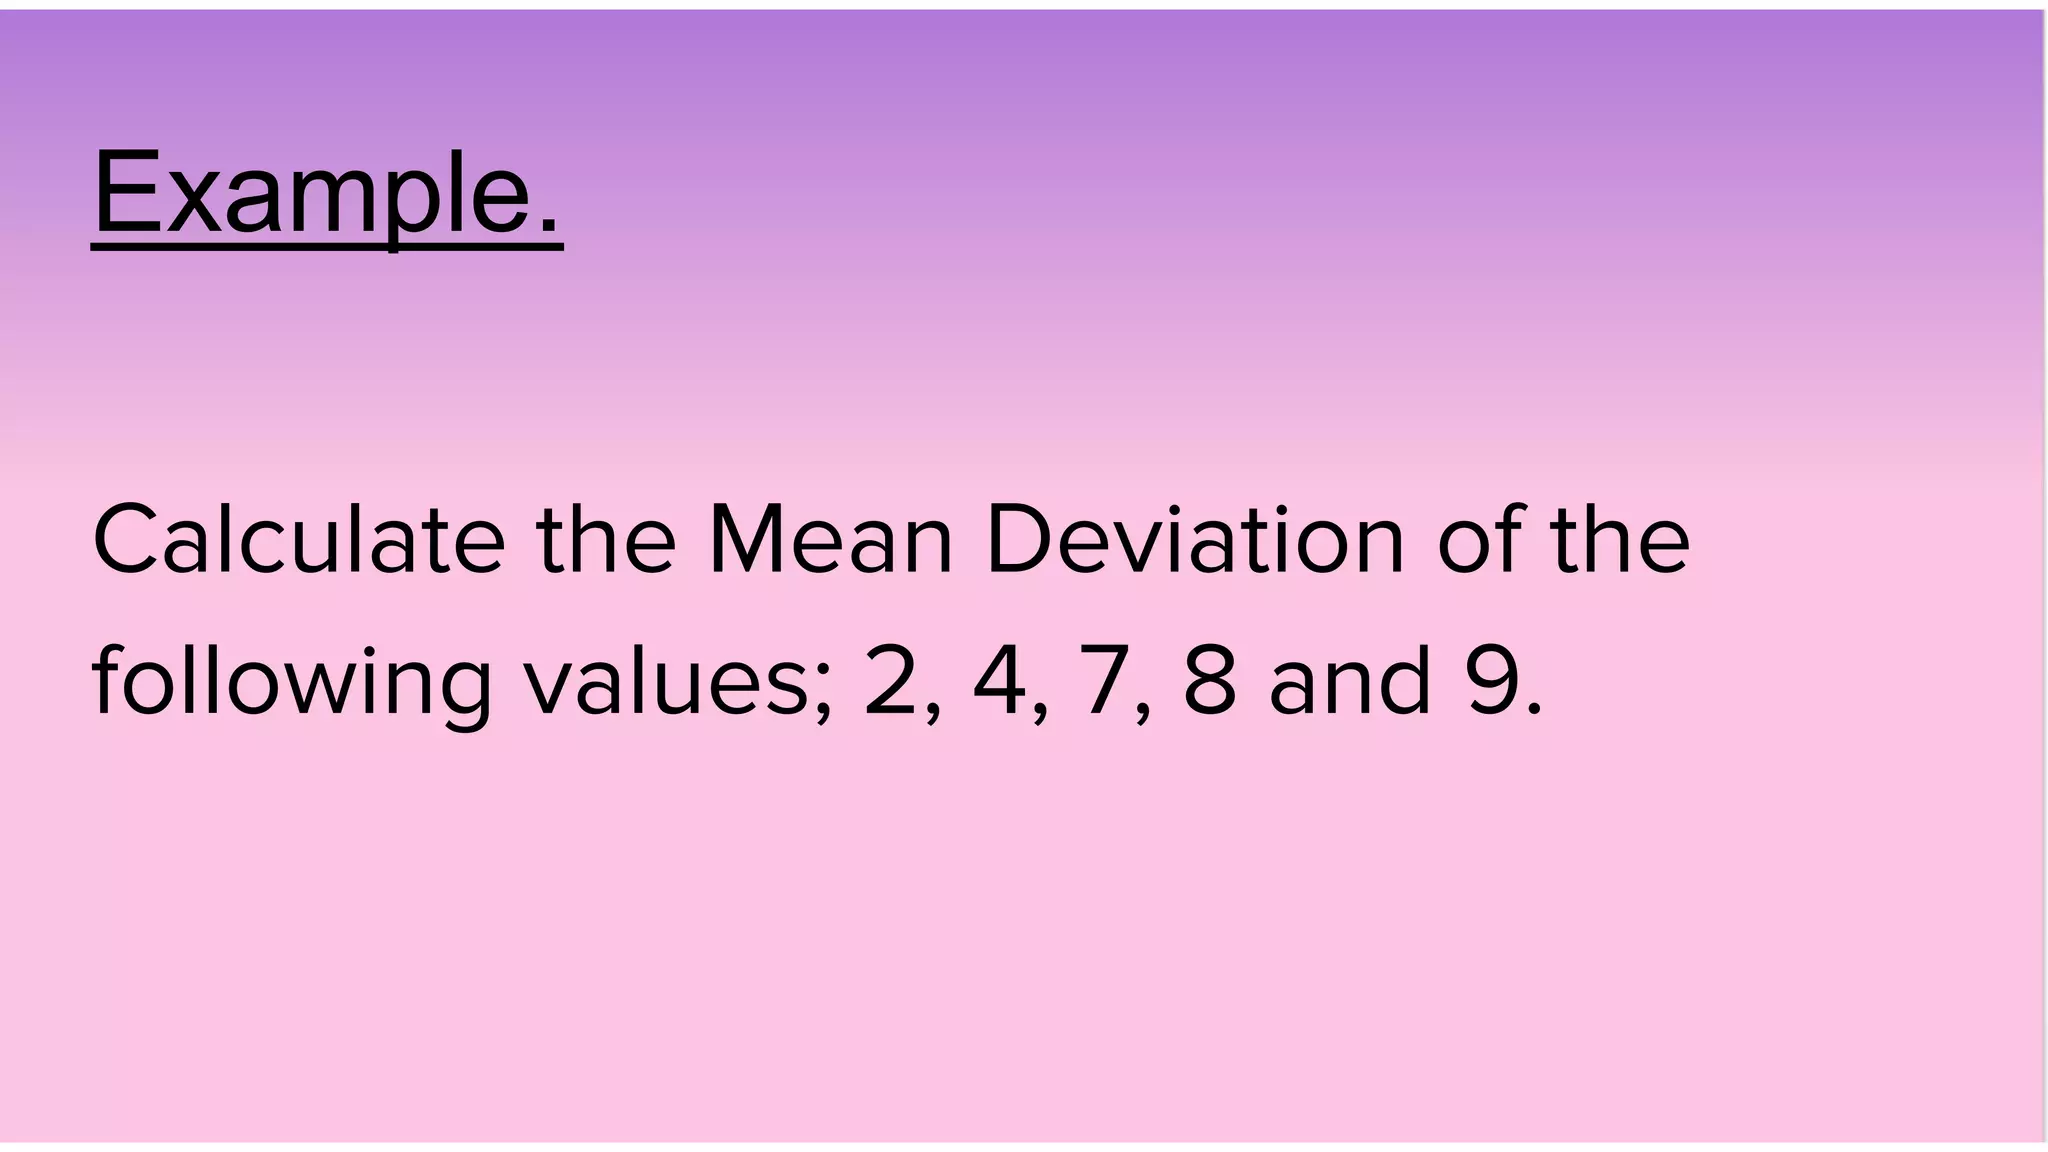
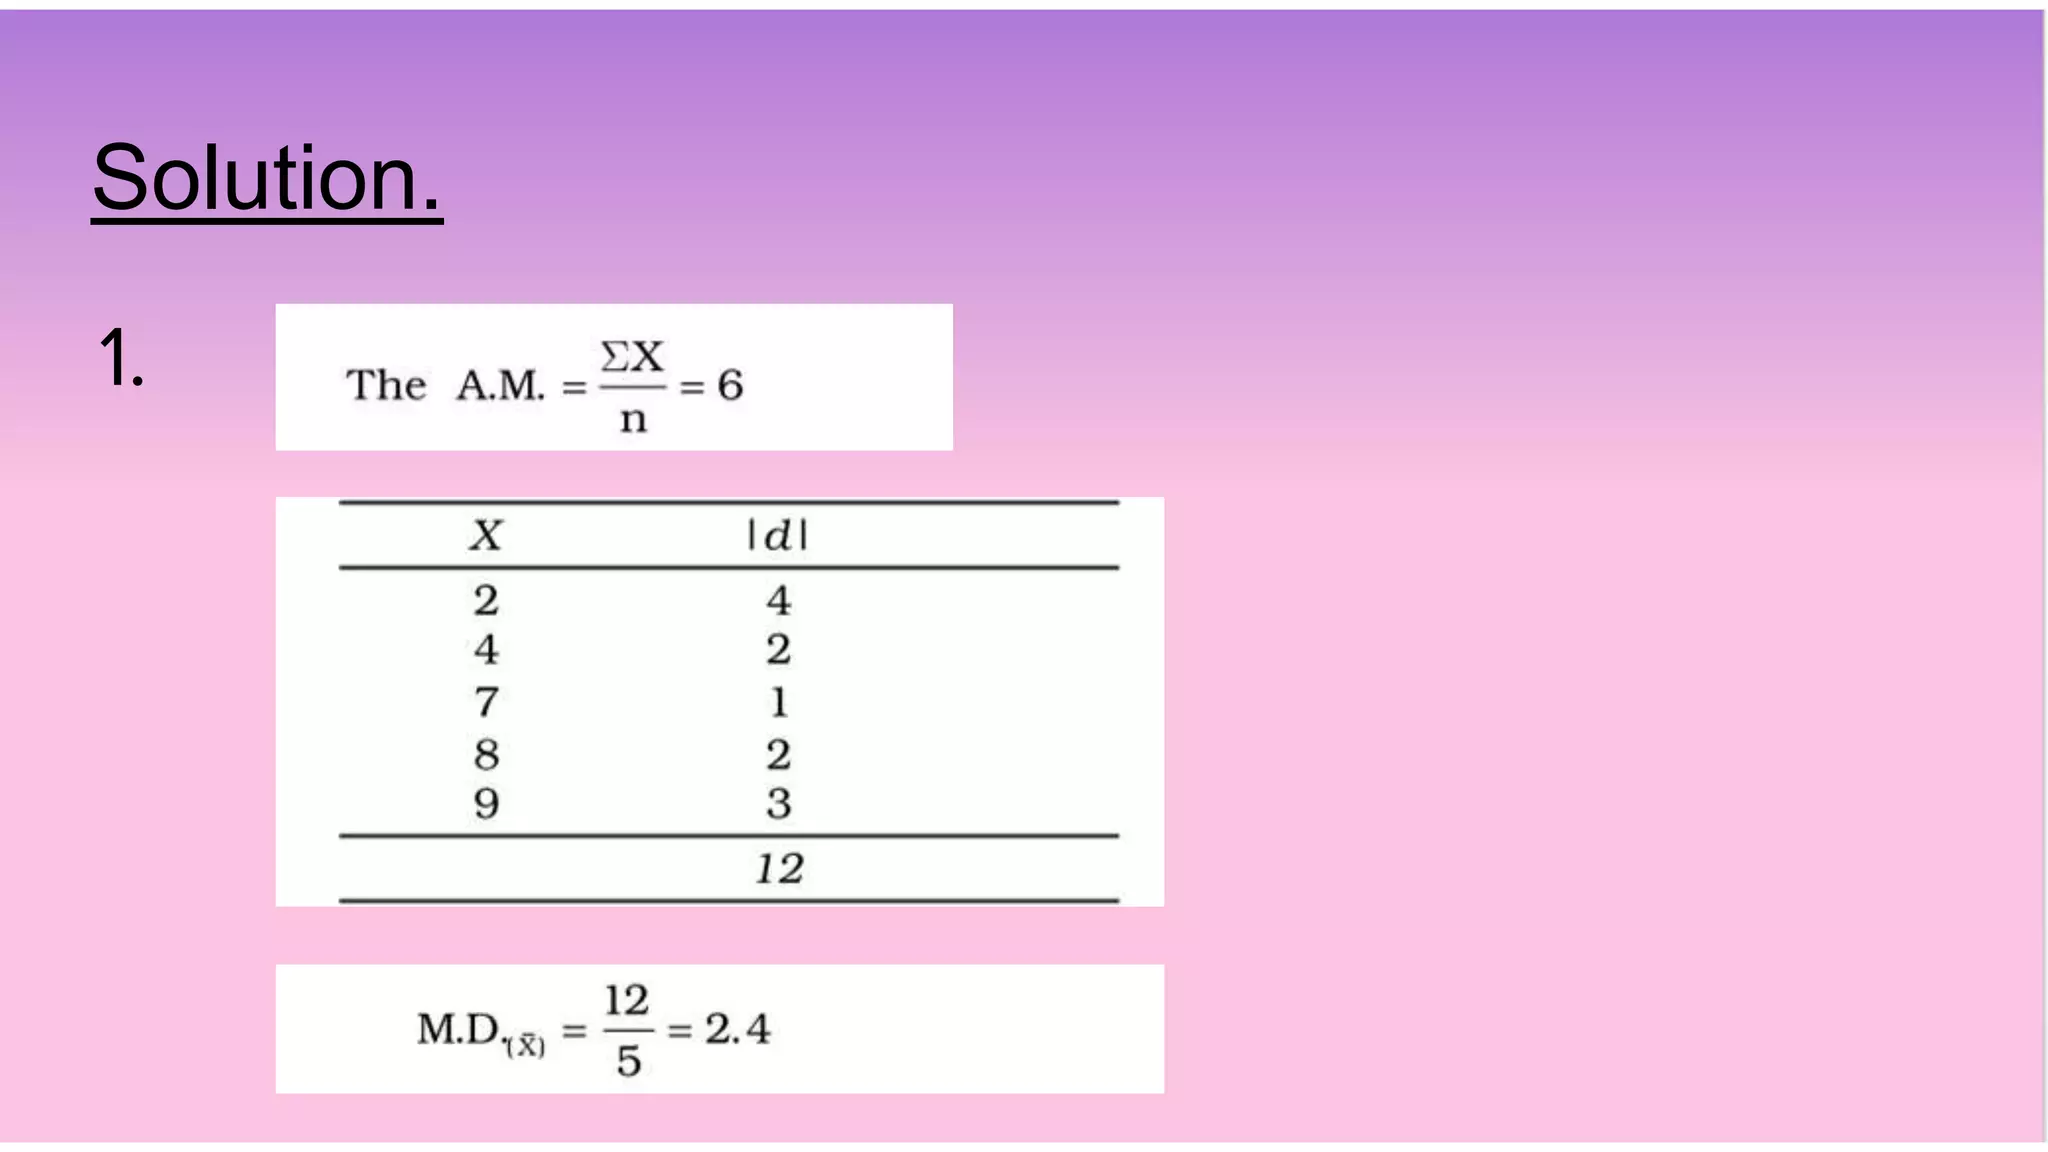
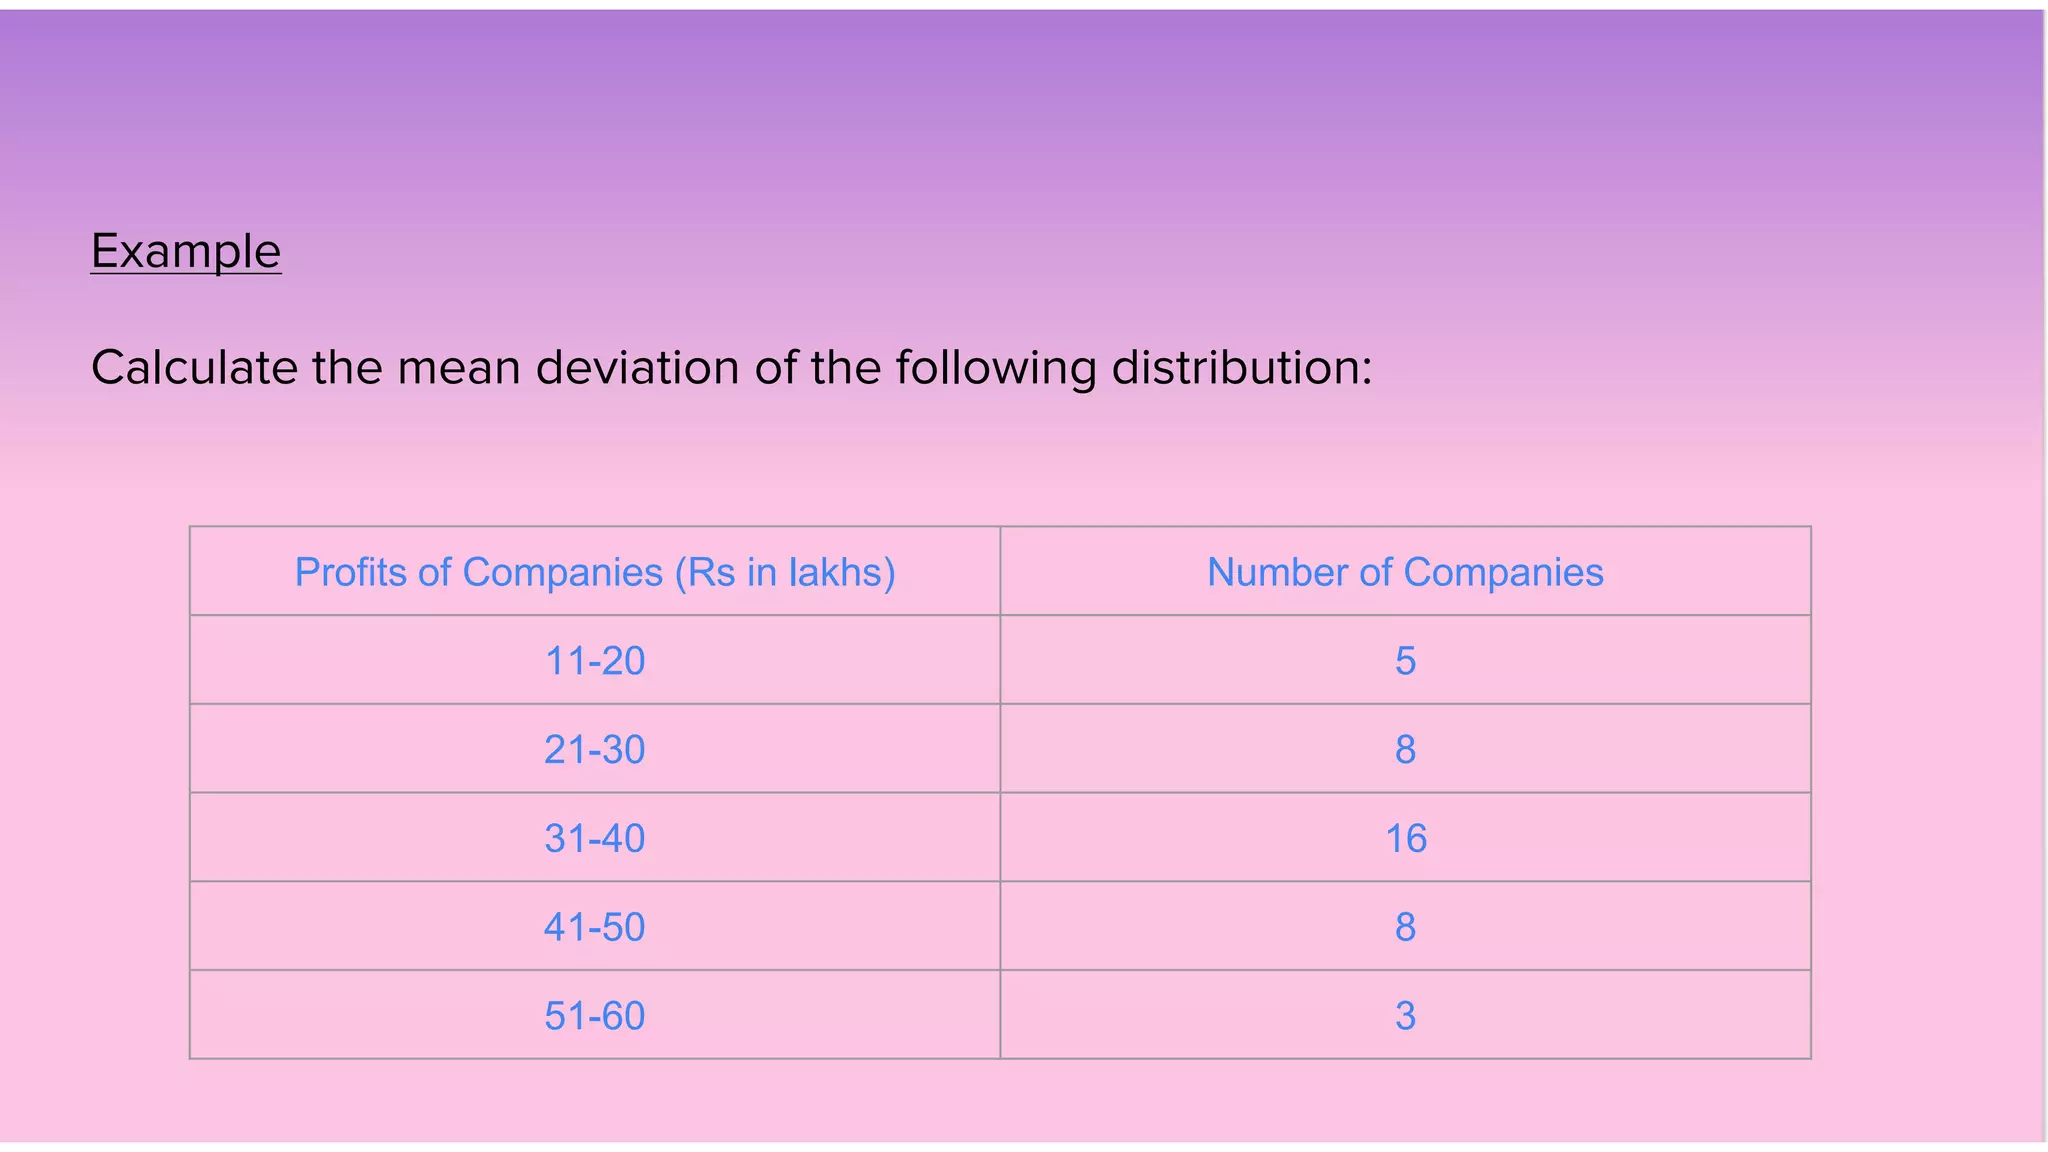
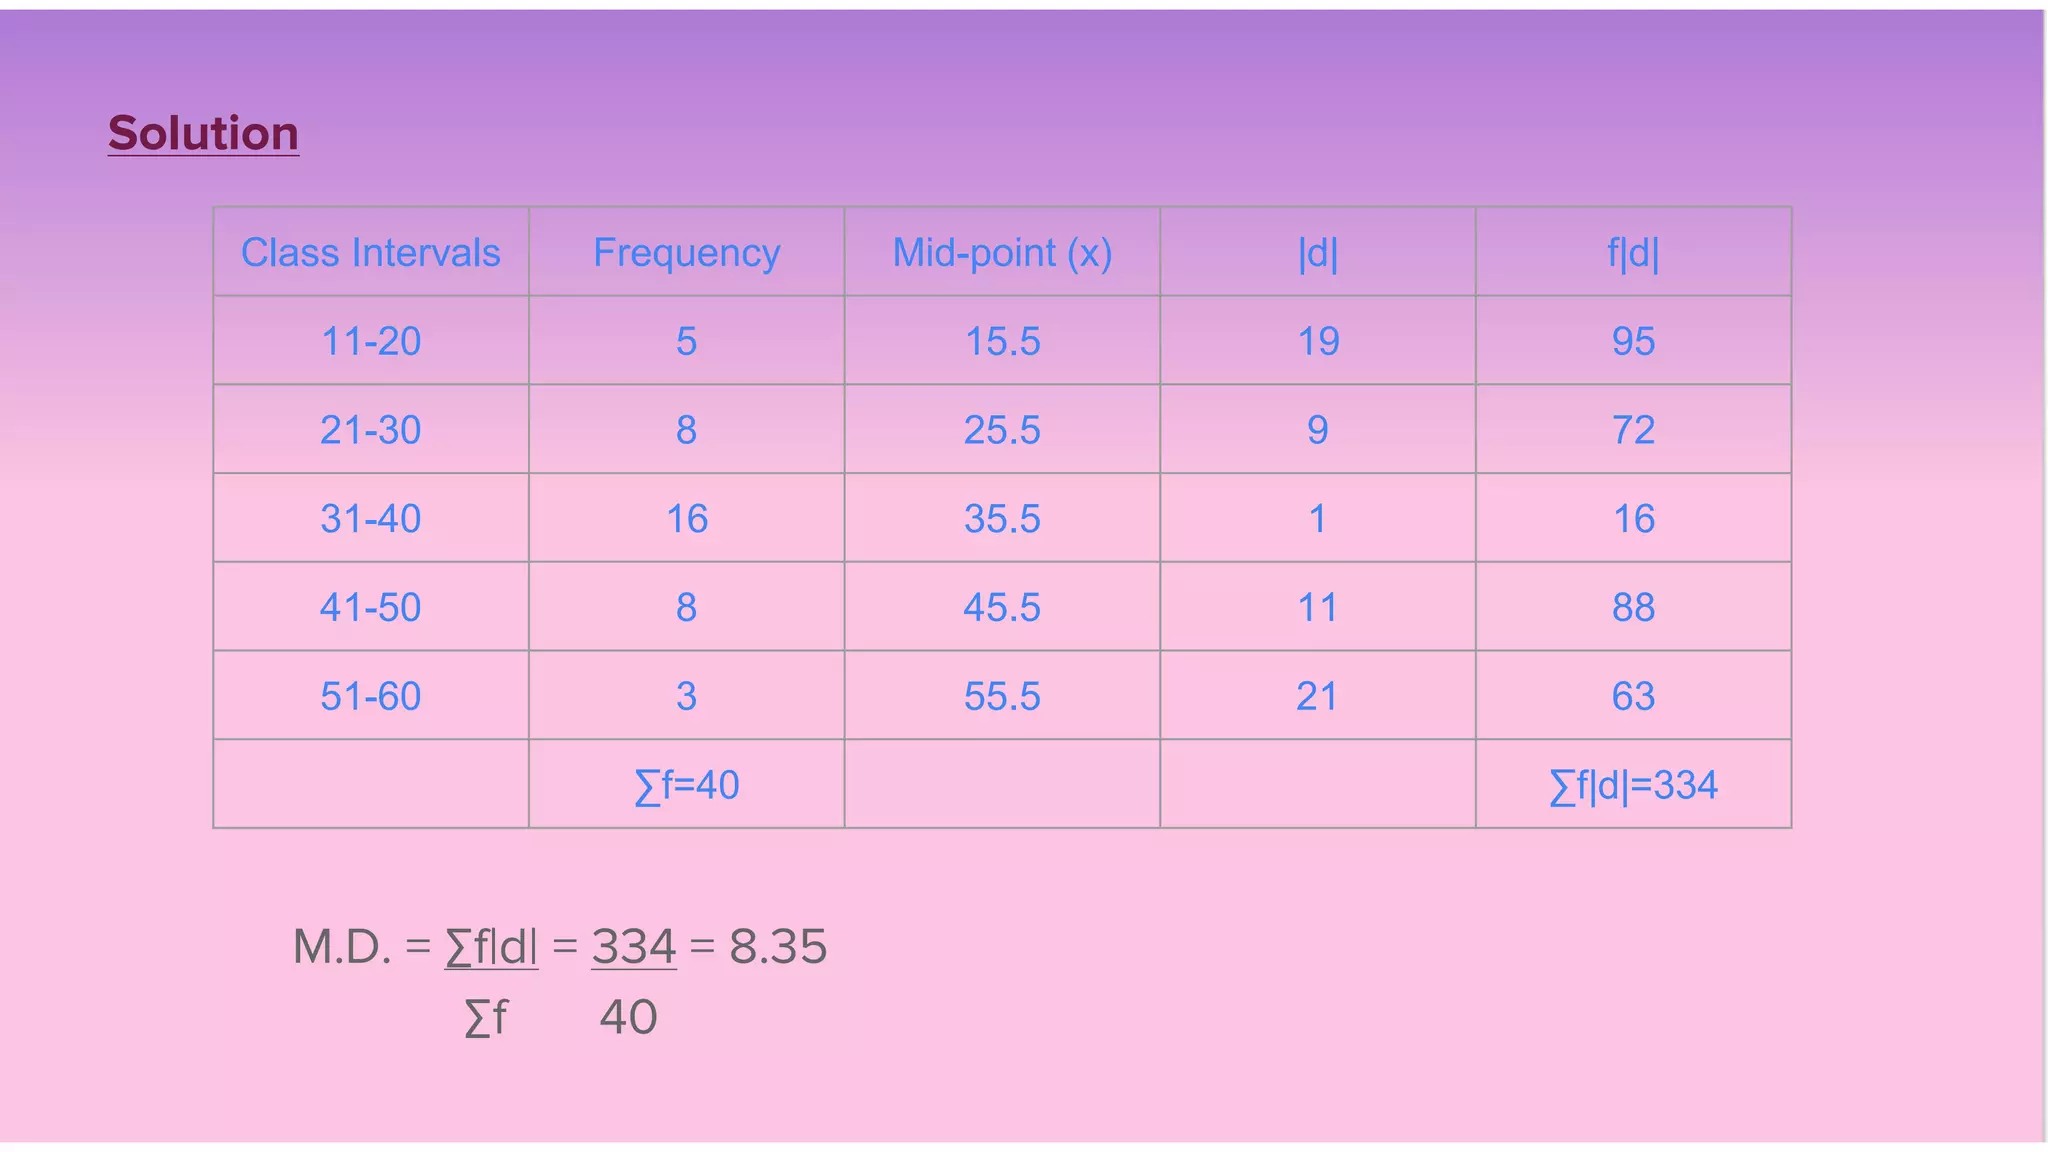
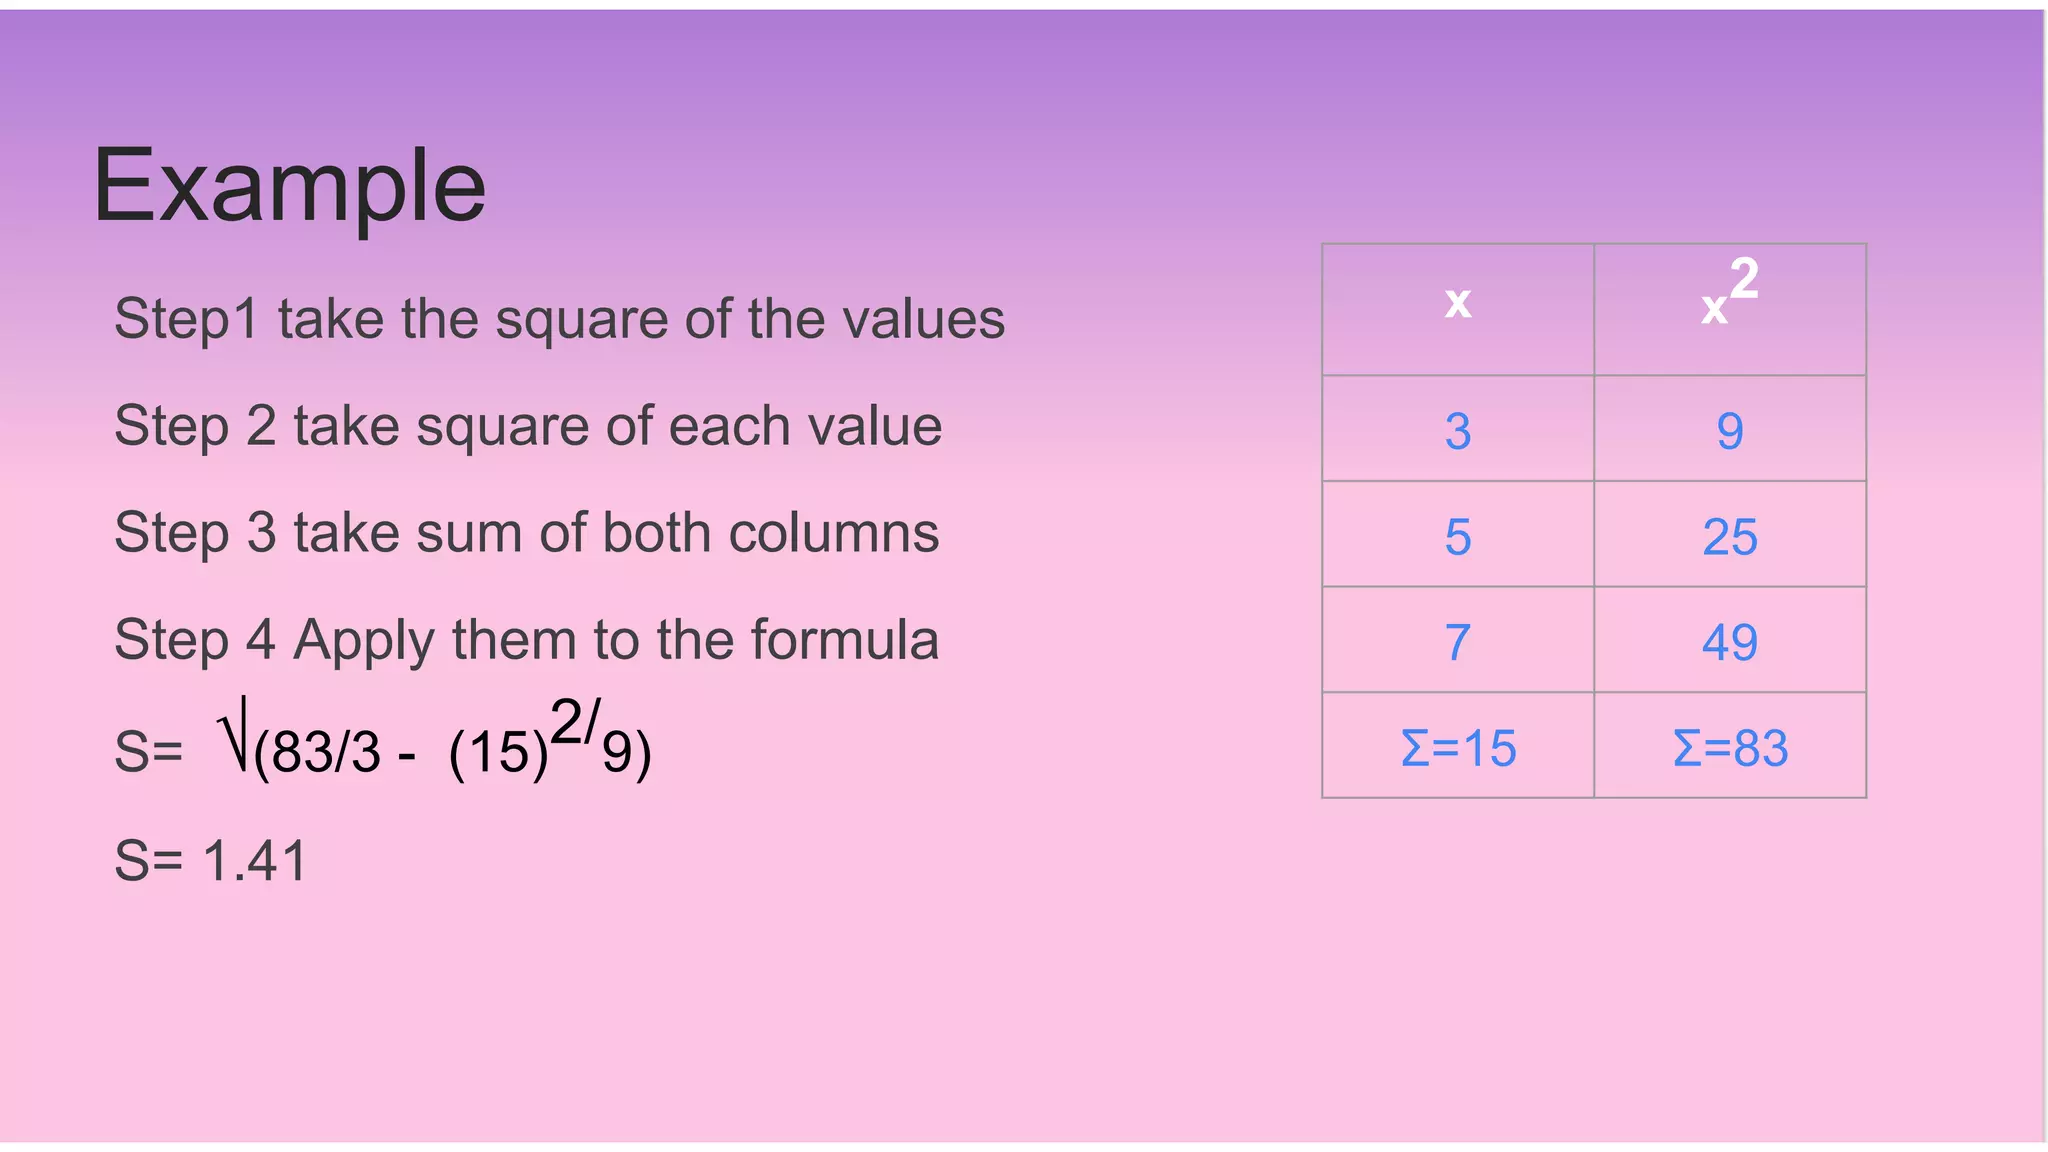
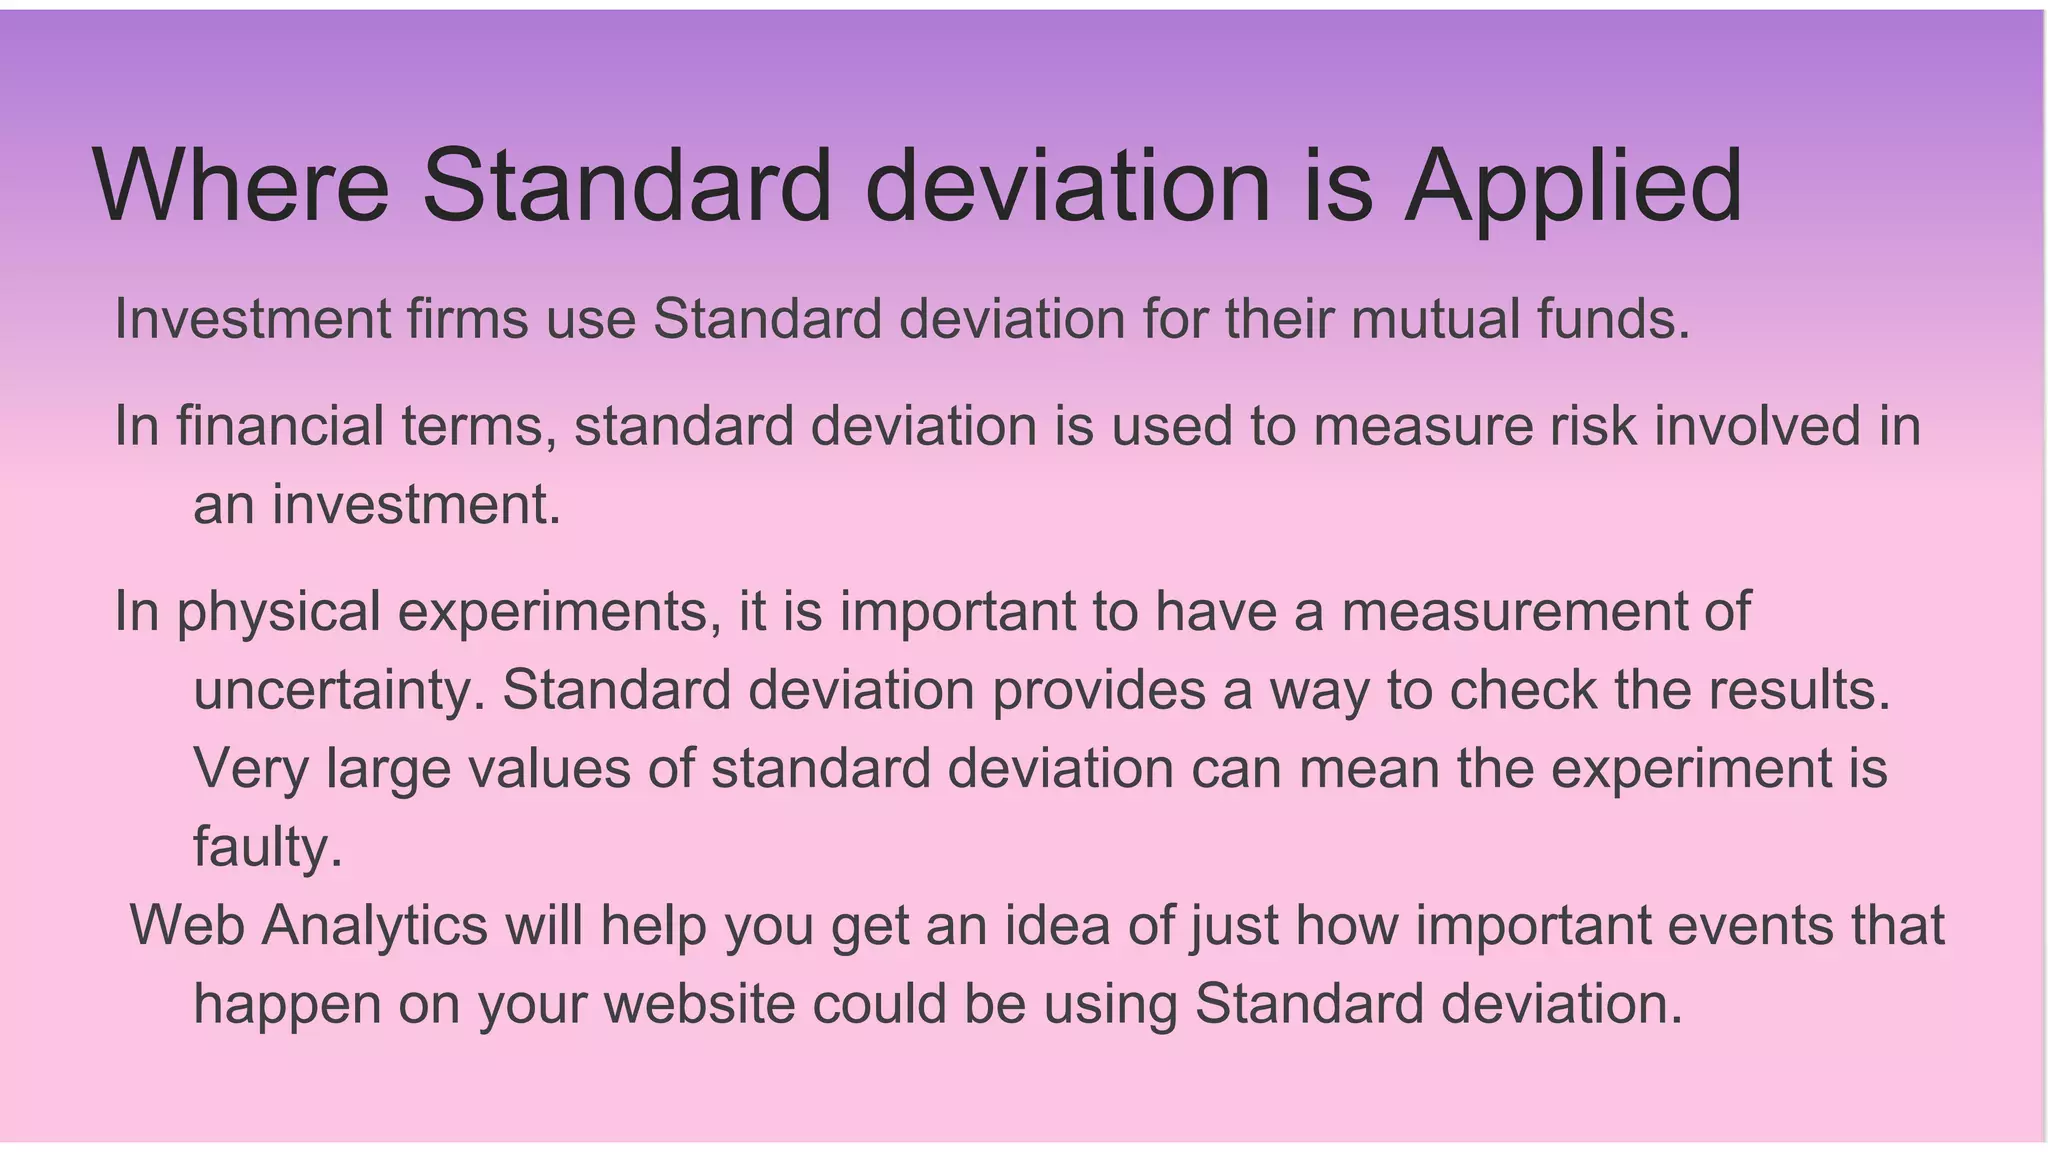
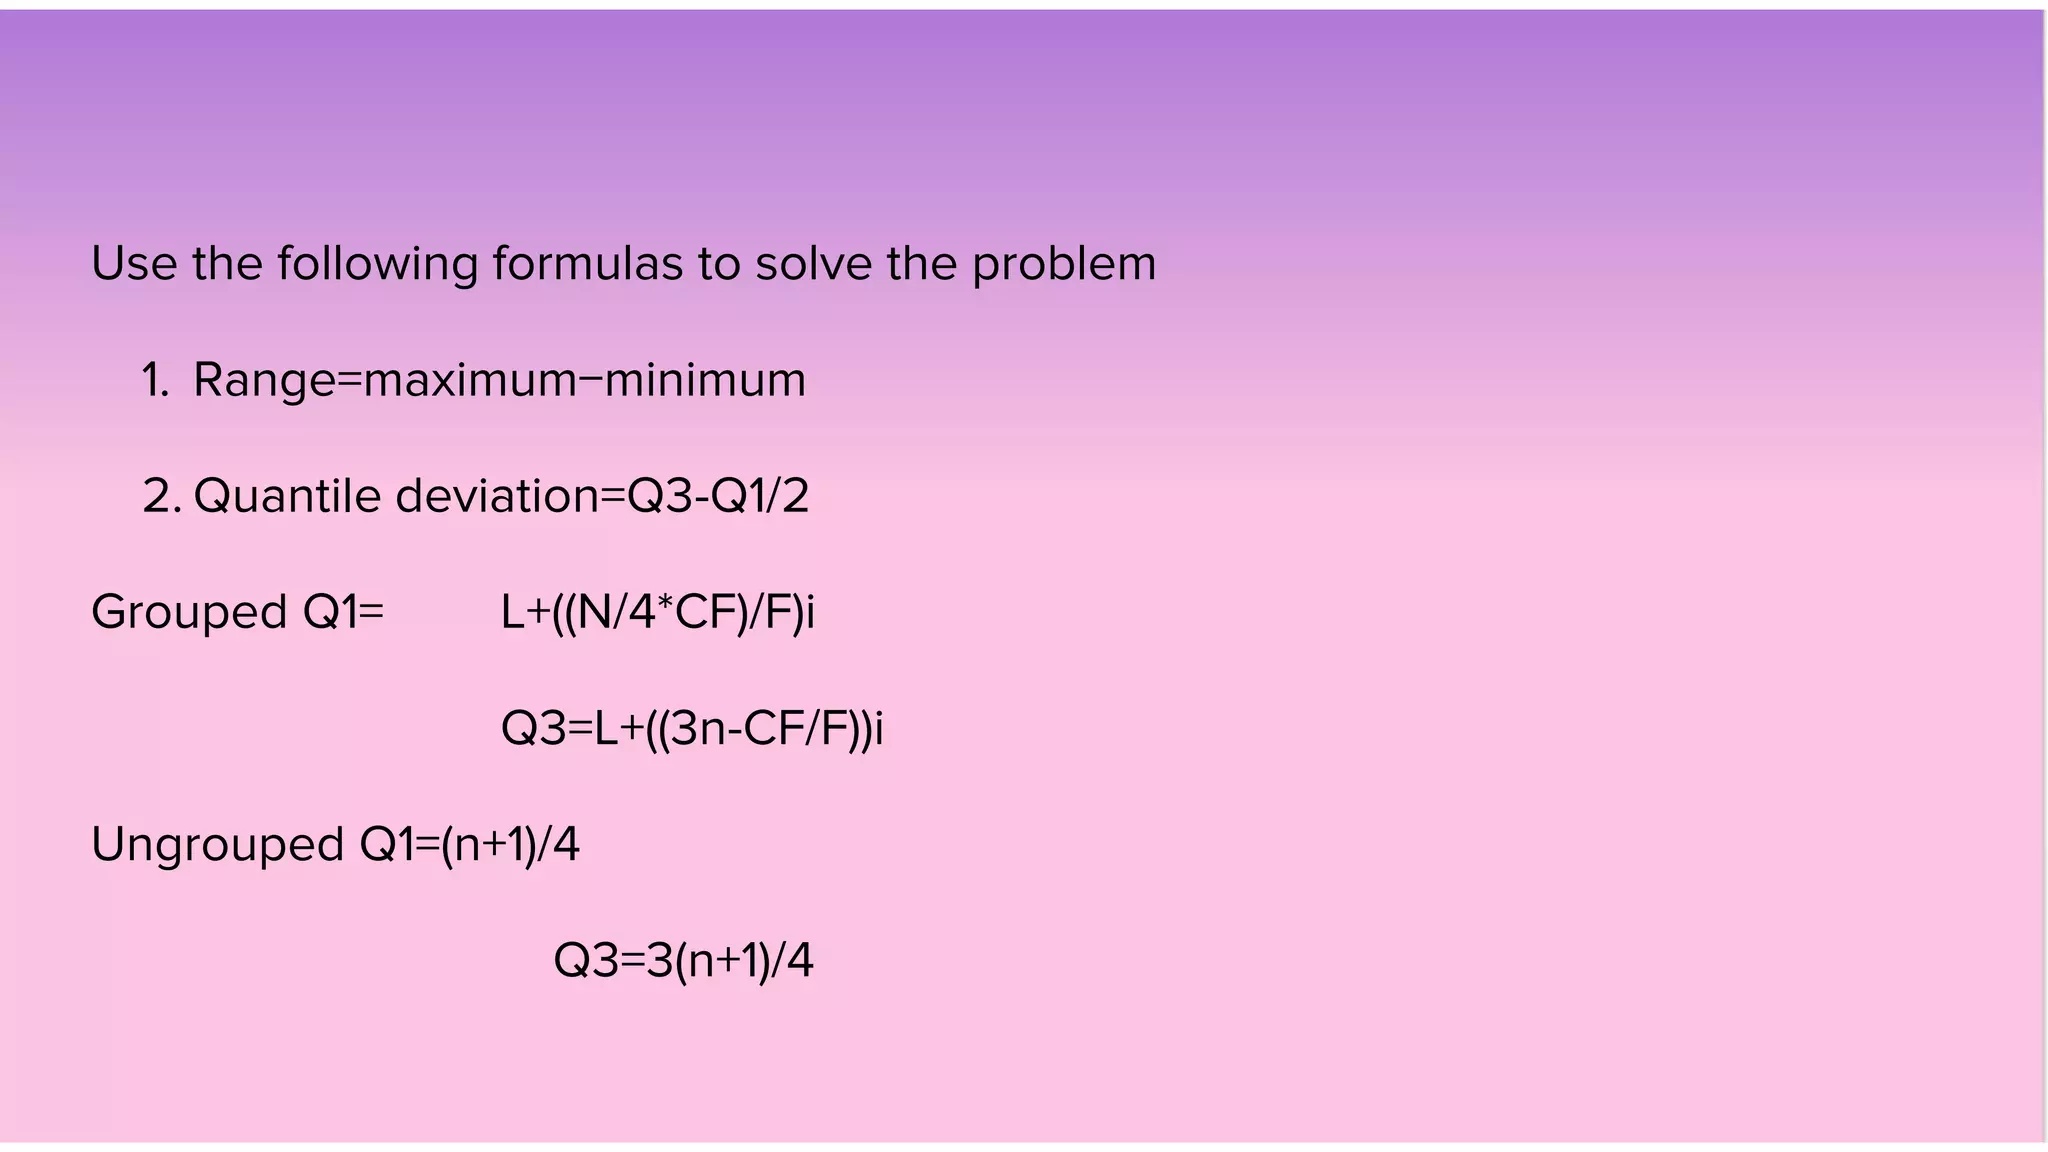
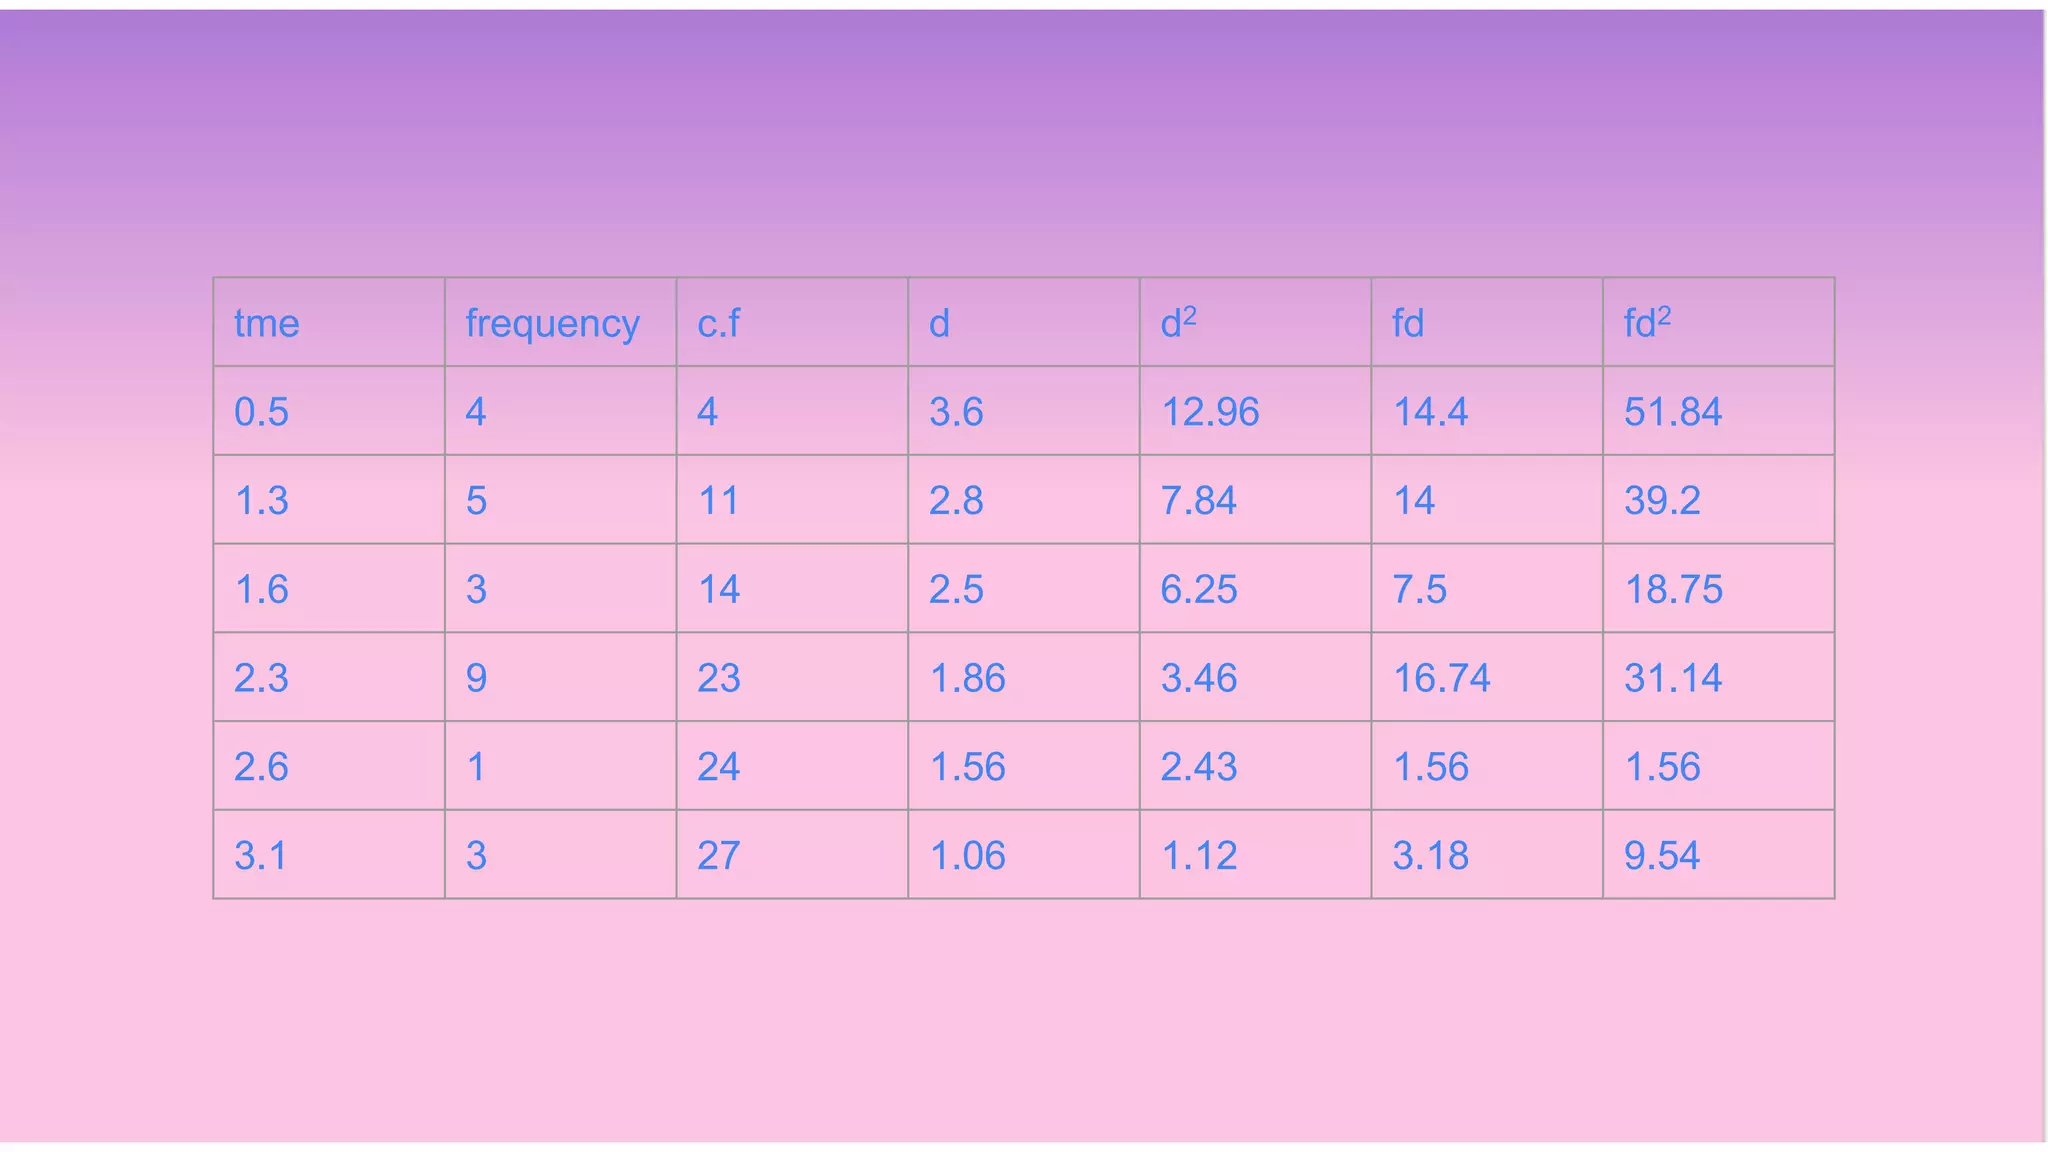
Case 6:
BIOSTATISTICS
“Measures of Dispersion”.
G5-PBL
Objectives:
Types of data.
Measures of Dispersion.
Range.
Quartile deviation.
Mean deviation.
Standard deviation.
Suitability of a dispersion method.
Case solving.
Types of data
1- Qualitative Data 2- Quantitative Data
1- Qualitative Data
● Uses words and descriptions.
● Can be observed.
● Examples of qualitative data: descriptions of texture, taste, or
an experience.
2- Quantitative Data
● Expressed with numbers.
● Can be put into categories, measured, or ranked.
● Examples of quantitative data: length, weight, age, cost, salary.
The Quantitative Data has two types:
1- Categorical data 2- Continuous data
- has been placed into groups.
- Example: hair color, opinions.
- numerical data measured on
a continuous range or scale.
- Example: height, weight.
What might be the qualitative and quantitative data that
describe this cup of coffee?
- The qualitative data: it has a strong taste and robust aroma.
- The quantitative data: it is 150 degrees Fahrenheit, and costs 10 SR.
MEASURES OF DISPERSION
Introduction
In addition to the measures of central tendency such as mean, mode,median we often
need to calculate a second type of measure called a measure of dispersion which
measures the variation in the observations about the middle value– mean or
median etc.
● The measure of central tendency of any series or data distribution summarises it
into single representative for which are useful in many respect but it fails to account
the general distribution pattern of data.
● Thus any conclusion only based on central tendency may be misleading
● Dispersion can prove very effective in association with central tendency in making
any statistical decision.
WHAT IS MEASURES OF DISPERSION ?
Measures of dispersion: group of analytical tools that describes the spread or
variability of a data set
Suppose that we have the distribution of the yields (kg per plot) of two paddy
varieties from 5 plots each. The distribution may be as follows:
Variety I 45 42 42 41 40 Variety II 54 48 42 33 30
It can be seen that the mean yield for both varieties is 42 kg but cannot say
that the performances of the two varieties are same. There is greater uniformity of
yields in the first variety whereas there is more variability in the yields of the
second variety. The first variety may be preferred since it is more consistent in yield
performance.
It is the value of dispersion which says how much reliable a central tendency is?
Usually, a small value of dispersion indicates that measure of central tendency is more
reliable representative of data series and vice‐versa.
There are different measures of dispersion like the range, the quartile deviation, the
mean deviation and the standard deviation
IMPORTANCE OF MEASURES OF DISPERSION
● supplements an average or a measure of central tendency.
● compares one group of data with another.
● Indicates how representative the data is.
● Measure of dispersion is also used to compare uniformity of different data like income,
temperature, rainfall, weight, height… etc.
The range in statistics is the difference between the
maximum and minimum values of a data set. We will
learn more details concerning this very basic descriptive
statistic
Example:
● (8 , 9, 10 , 11 , 12)
Range: 12-8=4
● (0 , 10 , -10 , 30 ,20)
(-10 , 0 , 10 , 20 ,30)
Range: 30-(-10)=40
Range for Ungrouped data.
*Range: 3.1 - 0.5 = 2.6
Time Frequency
0.5 4
1.3 5
1.6 3
2.3 9
2.6 1
3.1 3
Range for Grouped data.
*Range: 5 - 1.5 = 3.5
Time Frequency (Midpoint)
X
1.2 - 1.8 10 1.5
1.9 - 2.5 11 2.2
2.6 - 3.2 5 2.9
3.3 - 3.9 3 3.6
4.0 - 4.6 2 4.3
4.7 - 5.3 1 5
Example:
The answer is:
c
The answer is:
c
Uses of Range
With all its limitations Range is commonly used in certain fields. These are:
(i) Quality Control:
In quality control of manufactured products, range is used to study the variation in the
quality of the units manufactured. Even with the most modern mechanical equipment
there may be a small, almost insignificant, difference in the different units of a
commodity manufactured. Thus, if a company is manufacturing bottles of a particular
type, there may be a slight variation in the size or shape of the bottles manufactured.
In such cases a range is usually determined, and all the units which fall within these
limits are accepted while those which fall outside the limits are rejected.
Uses of Range
(ii) Variation in Money Rates, Share values, Exchange Rates and Gold prices, etc:
Variations in money rates, share values, gold prices and exchange rates are commonly
studied through range because the fluctuations in them are not very large. In fact
range as a measure of dispersion should be generally used only when variations in the
value of the variable are not much.
(iii) Weather forecasting:
Range gives an idea of the variation between maximum and minimum levels of
temperature. From day to day the range would not vary much and it is helpful in
studying the vagaries of nature if variations suddenly rise or fall.
Quartile Deviation
Quartiles in statistics are values that divide your data into quarters. they divide your
data into four segments according to where the numbers fall on the number line.
The four quarters that divide a data set into quartiles are:
1. The lowest 25% of numbers.
2. The next lowest 25% of numbers (up to the median).
3. The second highest 25% of numbers (above the median).
4. The highest 25% of numbers.
How can you find the quartile ?
If a data set of scores is arranged in ascending order of magnitude, then:
The lower quartile (Q1) is the median of the lower half of the data set.
Q 2 (The median) is the middle value of the data set
The upper quartile (Q3) is the median of the upper half of the data set.
Quartile Deviation
semi-inter-quartile range or the quartile deviation:
Quartile Deviation (QD) means the semi variation between the upper quartiles (Q3) and lower quartiles (Q1)
in a distribution
the inter quartile rang (IQR) : is the spread of the middle 50% of the data values. So:
Coefficient of Quartile Deviation:A relative measure of dispersion based on the quartile deviation is called
the coefficient of quartile deviation.
Quartile Deviation For Ungrouped Data
First: Arrange the data in ascending order.
Second: Find First Quartile
Third: Find Third Quartile
Finally: Put the values into the Formula of Quartile Deviation
Example:
Problem: Following are run scores by batsman in last 20 test
matches:
96,70,100,96,81,84,90,89,63,90,34,75,39,82,85,86,76,64,67
and 88.
First: Arrange the data in Ascending order
34,39,63,64,67,70,75,76,81,82,84,85,86,8
8,89,90,90,96,96,100
Second: First Quartile
Third: Third Quartile
Finally: find Quartile Deviation
Quartile Deviation For grouped Data
Calculate the quartile deviation and coefficient of quartile deviation from the
data given below:
Quartile Deviation For grouped Data
We have to calculate:
● Class boundaries :
The lower limit for every class is the smallest value in that class.
the upper limit for every class is the greatest value in that class.
The size of the gap between classes is the difference between the
upper class limit of one class and the lower class limit of the next
class.
In this case the gap is
9.8-9.7 = 0.1
The lower boundary of each class is calculated by subtracting half of the gap
value
9.3 - (0.1 / 2 ) =9.25
the upper boundary of each class is calculated by adding half of the gap value
9.7 + (0.1 /2 ) = 9.75
Quartile Deviation For grouped Data
We have to calculate:
● Cumulative frequency
The total of a frequency and all
frequencies so far in a frequency
distribution.
It is the 'running total' of frequencies.
Quartile Deviation For grouped Data
Mean Deviation.
Mean Deviation is the arithmetic mean of the differences of the values
from their average. The average used is either the arithmetic mean or
median.
Since the average is a central value, some deviations are positive and
some are negative. If these are added as they are, the sum will not
reveal anything; because the sum of deviations from Arithmetic Mean
is always zero.
Mean Deviation tries to overcome this problem by ignoring the signs of
deviations, i.e., it considers all deviations positive.
Mean Deviation for ungrouped data.
Direct Method Steps:
The A.M. of the values is calculated.
Difference between each value and the A.M. is calculated. All differences are
considered positive. These are denoted as |d|
The A.M. of these differences (called deviations) is the Mean Deviation.
i.e. MD = Σ | d |
n
Example.
Calculate the Mean Deviation of the
following values; 2, 4, 7, 8 and 9.
Solution.
1.
Mean Deviation for Grouped Data
Steps
1. Calculate the mean of the distribution.
2. Calculate the absolute deviations |d| of the class midpoints from the mean.
3. Multiply each |d| value with its corresponding frequency to get f|d| values. Sum
them up to get ∑f∣d∣.
4. Apply the following formula,
M.D. = ∑f∣d∣
∑f
Example
Calculate the mean deviation of the following distribution:
Profits of Companies (Rs in lakhs) Number of Companies
11-20 5
21-30 8
31-40 16
41-50 8
51-60 3
Solution
M.D. = ∑f|d| = 334 = 8.35
∑f 40
Class Intervals Frequency Mid-point (x) |d| f|d|
11-20 5 15.5 19 95
21-30 8 25.5 9 72
31-40 16 35.5 1 16
41-50 8 45.5 11 88
51-60 3 55.5 21 63
∑f=40 ∑f|d|=334
Standard deviation
The Standard Deviation is a number that measures how far away each number in a
set of data is from their mean ,it shows the variation in data.
Standard Deviation is also known as root-mean square deviation as it is the square
root of means of the squared deviations from the arithmetic mean.
If the Standard Deviation is large it means the numbers are spread out from their
mean. If the Standard Deviation is small it means the numbers are close to their
mean.
The symbol for Standard Deviation used for a sample data is s and the symbol used
for a population data is σ.
Formulas of Standard Deviation
For ungrouped
In case of individual observations, Standard Deviation can be computed in any of the two ways:
1. Take the deviation of the items from the actual mean
2. Take the deviation of the item from the assumed mean
The formula for an ungroup data is:
´The formula for an ungroup data using assumed mean method:
where d=x-a
Example
Step1 take the square of the values
Step 2 take square of each value
Step 3 take sum of both columns
Step 4 Apply them to the formula
S= ⎷(83/3 - (15)2/9)
S= 1.41
x x
2
3 9
5 25
7 49
Σ=15 Σ=83
Where Standard deviation is Applied
Investment firms use Standard deviation for their mutual funds.
In financial terms, standard deviation is used to measure risk involved in
an investment.
In physical experiments, it is important to have a measurement of
uncertainty. Standard deviation provides a way to check the results.
Very large values of standard deviation can mean the experiment is
faulty.
Web Analytics will help you get an idea of just how important events that
happen on your website could be using Standard deviation.
grouped data standard Deviation
M = mid-point
μ = Mean
F = frequency
n= number of samples
Σ=sum
σ2 = data variance
σ= standard deviation
Example Problem:
Find an estimate of the variance
and standard deviation of the
following data for the marks
obtained in a test by 88 students.
Marks Frequency (f)
0 ≤ x < 10 6
10 ≤ x < 20 16
20 ≤ x < 30 24
30 ≤ x < 40 25
40 ≤ x < 50 17
step 1:find the mid-point for each group or range of the frequency table.
(0+10)/2 = 5
(10+20)/2= 15
(20+30)/2= 25
(30+40)/2= 35
(40+50)/2= 45
step 2: calculate the number of samples of a data set by summing up the
frequencies.
n= 6+16+24+25+17= 88
step 3: find the mean for the grouped data by dividing the addition of
multiplication of each group mid-point and frequency of the data set by the
number of samples.
μ= Σ(M*F)/n
μ= (5×6 + 15×16 + 25×24 + 35×25 + 45×17)/n
μ= 2510/88 = 28.5227
Step 4: calculate the variance for the frequency table data.
σ2=Σ(F × M2) - (n × μ2)/(n - 1)
σ2= (6×52 + 16×152 + 24×252 + 25×352 + 17×452) - (88 × (28.5227)2)/(88-1)
σ2= 138.73
step 5:estimate standard deviation for the frequency table by taking square
root of the variance.
σ= √138.73
= 11.78
Solve the case
Find the following measures:
1. Range
2. Mean deviation
3. Standard deviation
4. Quartile deviation
Time Frequency
0.5 4
1.3 5
1.6 3
2.3 9
2.6 1
3.1 3
Time Frequency
1.2-1.8 10
1.9-2.5 11
2.6-3.2 5
3.3-3.9 3
4.0-4.6 2
4.7-5.3 1
Use the following formulas to solve the problem
1. Range=maximum−minimum
2. Quantile deviation=Q3-Q1/2
Grouped Q1= L+((N/4*CF)/F)i
Q3=L+((3n-CF/F))i
Ungrouped Q1=(n+1)/4
Q3=3(n+1)/4
3.Mean deviation
Grouped=√((∑fd2/n)-(∑fd)2/n)
Ungrouped=∑(d)/n
4.standard deviation
Grouped=√((∑fd2)/n-(∑fd)2/n)
Ungrouped=√(∑d2)/n
time frequ
ency
m.p c.f fx d d2 fd
1.2-
1.8
10 1.5 10 15 276 7617
6
2760
1.9-
2.5
11 4.4 21 48.4 242.6 5885
4.76
2668.
6
2.6-
3.2
5 5.8 26 29 262 6864
4
1310
3.3-
3.9
3 7.2 29 21.6 269.4 7257
6.36
808.2
4.0-
4.6
2 8.6 31 172 119 1416
1
238
4.7-
5.3
1 5 32 5 286 8179
6
286
tme frequency c.f d d2 fd fd2
0.5 4 4 3.6 12.96 14.4 51.84
1.3 5 11 2.8 7.84 14 39.2
1.6 3 14 2.5 6.25 7.5 18.75
2.3 9 23 1.86 3.46 16.74 31.14
2.6 1 24 1.56 2.43 1.56 1.56
3.1 3 27 1.06 1.12 3.18 9.54
Suitability of a dispersion method
Range is the simplest method of studying dispersion. Range
is the difference between the smallest value and the largest
value of a series. While computing range, we do not take into
account frequencies of different groups.
Formula: Absolute Range = L – S
Coefficient of Range =
where, L represents largest value in a distribution
S represents smallest value in a distribution
Standard Deviation
Advantages:-
•Shows how much data is clustered around a mean value
•It gives a more accurate idea of how the data is distributed
•Not as affected by extreme values
Disadvantages:-
•It doesn't give you the full range of the data
•It can be hard to calculate
•Only used with data where an independent variable is plotted against the frequency of it
•Assumes a normal distribution pattern
The mean deviation is actually more efficient than the standard
deviation in the realistic situation where some of the
measurements are in error, more efficient for distributions other
than perfect normal, closely related to a number of other useful
analytical techniques, and easier to understand.
References
● https://www.thoughtco.com/what-is-the-range-in-statistics-3126248
● http://www.transtutors.com/homework-help/statistics/measures-of-dispersion/uses-range.aspx
● http://www.mathopolis.com/questions/q.php?id=696&site=1&ref=/data/range.html&qs=696_740_1468_1469_2159_2160_3064_3065_3
798_3799
● http://www.mathopolis.com/questions/q.php?id=3799&site=1&ref=/data/range.html&qs=696_740_1468_1469_2159_2160_3064_3065_
3798_3799
● https://www.youtube.com/watch?v=vuhB1O8q0ys
● http://mba-lectures.com/statistics/descriptive-statistics/279/range.html
● http://www.kuk.ac.in/userfiles/file/distance_education/Year-2011-2012/Lecture-2%20(Paper%205(a)).pdf
● http://eagri.tnau.ac.in/eagri50/STAM101/pdf/lec05.pdf
● http://ncert.nic.in/ncerts/l/keep215.pdf
● http://labstat.psa.gov.ph/learnstat/3_Measures%20of%20Central%20Tendency,%20Dispersion%20and%20Skewness.pdf
● http://www.emathzone.com/tutorials/basic-statistics/quartile-deviation-and-its-coefficient.html
● http://www.mathsteacher.com.au/year10/ch16_statistics/05_quartiles/24quartiles.htm
● http://www.statisticshowto.com/what-are-quartiles/
● https://www.easycalculation.com/statistics/learn-quartile-deviation-calculator.php
● https://www.mathway.com/examples/statistics/frequency-distribution/finding-the-class-boundaries?id=1003
HAVE A NICE DAY :)

measure of dispersion

  • 1.
  • 2.
    Objectives: Types of data. Measuresof Dispersion. Range. Quartile deviation. Mean deviation. Standard deviation. Suitability of a dispersion method. Case solving.
  • 3.
    Types of data 1-Qualitative Data 2- Quantitative Data
  • 4.
    1- Qualitative Data ●Uses words and descriptions. ● Can be observed. ● Examples of qualitative data: descriptions of texture, taste, or an experience.
  • 5.
    2- Quantitative Data ●Expressed with numbers. ● Can be put into categories, measured, or ranked. ● Examples of quantitative data: length, weight, age, cost, salary.
  • 6.
    The Quantitative Datahas two types: 1- Categorical data 2- Continuous data - has been placed into groups. - Example: hair color, opinions. - numerical data measured on a continuous range or scale. - Example: height, weight.
  • 7.
    What might bethe qualitative and quantitative data that describe this cup of coffee? - The qualitative data: it has a strong taste and robust aroma. - The quantitative data: it is 150 degrees Fahrenheit, and costs 10 SR.
  • 9.
    MEASURES OF DISPERSION Introduction Inaddition to the measures of central tendency such as mean, mode,median we often need to calculate a second type of measure called a measure of dispersion which measures the variation in the observations about the middle value– mean or median etc. ● The measure of central tendency of any series or data distribution summarises it into single representative for which are useful in many respect but it fails to account the general distribution pattern of data. ● Thus any conclusion only based on central tendency may be misleading ● Dispersion can prove very effective in association with central tendency in making any statistical decision.
  • 10.
    WHAT IS MEASURESOF DISPERSION ? Measures of dispersion: group of analytical tools that describes the spread or variability of a data set Suppose that we have the distribution of the yields (kg per plot) of two paddy varieties from 5 plots each. The distribution may be as follows: Variety I 45 42 42 41 40 Variety II 54 48 42 33 30 It can be seen that the mean yield for both varieties is 42 kg but cannot say that the performances of the two varieties are same. There is greater uniformity of yields in the first variety whereas there is more variability in the yields of the second variety. The first variety may be preferred since it is more consistent in yield performance.
  • 11.
    It is thevalue of dispersion which says how much reliable a central tendency is? Usually, a small value of dispersion indicates that measure of central tendency is more reliable representative of data series and vice‐versa. There are different measures of dispersion like the range, the quartile deviation, the mean deviation and the standard deviation IMPORTANCE OF MEASURES OF DISPERSION ● supplements an average or a measure of central tendency. ● compares one group of data with another. ● Indicates how representative the data is. ● Measure of dispersion is also used to compare uniformity of different data like income, temperature, rainfall, weight, height… etc.
  • 12.
    The range instatistics is the difference between the maximum and minimum values of a data set. We will learn more details concerning this very basic descriptive statistic
  • 13.
    Example: ● (8 ,9, 10 , 11 , 12) Range: 12-8=4 ● (0 , 10 , -10 , 30 ,20) (-10 , 0 , 10 , 20 ,30) Range: 30-(-10)=40
  • 14.
    Range for Ungroupeddata. *Range: 3.1 - 0.5 = 2.6 Time Frequency 0.5 4 1.3 5 1.6 3 2.3 9 2.6 1 3.1 3
  • 15.
    Range for Groupeddata. *Range: 5 - 1.5 = 3.5 Time Frequency (Midpoint) X 1.2 - 1.8 10 1.5 1.9 - 2.5 11 2.2 2.6 - 3.2 5 2.9 3.3 - 3.9 3 3.6 4.0 - 4.6 2 4.3 4.7 - 5.3 1 5
  • 16.
  • 17.
  • 18.
    Uses of Range Withall its limitations Range is commonly used in certain fields. These are: (i) Quality Control: In quality control of manufactured products, range is used to study the variation in the quality of the units manufactured. Even with the most modern mechanical equipment there may be a small, almost insignificant, difference in the different units of a commodity manufactured. Thus, if a company is manufacturing bottles of a particular type, there may be a slight variation in the size or shape of the bottles manufactured. In such cases a range is usually determined, and all the units which fall within these limits are accepted while those which fall outside the limits are rejected.
  • 19.
    Uses of Range (ii)Variation in Money Rates, Share values, Exchange Rates and Gold prices, etc: Variations in money rates, share values, gold prices and exchange rates are commonly studied through range because the fluctuations in them are not very large. In fact range as a measure of dispersion should be generally used only when variations in the value of the variable are not much. (iii) Weather forecasting: Range gives an idea of the variation between maximum and minimum levels of temperature. From day to day the range would not vary much and it is helpful in studying the vagaries of nature if variations suddenly rise or fall.
  • 20.
    Quartile Deviation Quartiles instatistics are values that divide your data into quarters. they divide your data into four segments according to where the numbers fall on the number line. The four quarters that divide a data set into quartiles are: 1. The lowest 25% of numbers. 2. The next lowest 25% of numbers (up to the median). 3. The second highest 25% of numbers (above the median). 4. The highest 25% of numbers.
  • 21.
    How can youfind the quartile ? If a data set of scores is arranged in ascending order of magnitude, then: The lower quartile (Q1) is the median of the lower half of the data set. Q 2 (The median) is the middle value of the data set The upper quartile (Q3) is the median of the upper half of the data set.
  • 22.
    Quartile Deviation semi-inter-quartile rangeor the quartile deviation: Quartile Deviation (QD) means the semi variation between the upper quartiles (Q3) and lower quartiles (Q1) in a distribution the inter quartile rang (IQR) : is the spread of the middle 50% of the data values. So: Coefficient of Quartile Deviation:A relative measure of dispersion based on the quartile deviation is called the coefficient of quartile deviation.
  • 23.
    Quartile Deviation ForUngrouped Data First: Arrange the data in ascending order. Second: Find First Quartile Third: Find Third Quartile Finally: Put the values into the Formula of Quartile Deviation
  • 24.
    Example: Problem: Following arerun scores by batsman in last 20 test matches: 96,70,100,96,81,84,90,89,63,90,34,75,39,82,85,86,76,64,67 and 88.
  • 25.
    First: Arrange thedata in Ascending order 34,39,63,64,67,70,75,76,81,82,84,85,86,8 8,89,90,90,96,96,100
  • 26.
  • 27.
  • 28.
  • 29.
    Quartile Deviation Forgrouped Data Calculate the quartile deviation and coefficient of quartile deviation from the data given below:
  • 30.
    Quartile Deviation Forgrouped Data We have to calculate: ● Class boundaries : The lower limit for every class is the smallest value in that class. the upper limit for every class is the greatest value in that class. The size of the gap between classes is the difference between the upper class limit of one class and the lower class limit of the next class. In this case the gap is 9.8-9.7 = 0.1 The lower boundary of each class is calculated by subtracting half of the gap value 9.3 - (0.1 / 2 ) =9.25 the upper boundary of each class is calculated by adding half of the gap value 9.7 + (0.1 /2 ) = 9.75
  • 31.
    Quartile Deviation Forgrouped Data We have to calculate: ● Cumulative frequency The total of a frequency and all frequencies so far in a frequency distribution. It is the 'running total' of frequencies.
  • 32.
  • 33.
    Mean Deviation. Mean Deviationis the arithmetic mean of the differences of the values from their average. The average used is either the arithmetic mean or median. Since the average is a central value, some deviations are positive and some are negative. If these are added as they are, the sum will not reveal anything; because the sum of deviations from Arithmetic Mean is always zero. Mean Deviation tries to overcome this problem by ignoring the signs of deviations, i.e., it considers all deviations positive.
  • 34.
    Mean Deviation forungrouped data. Direct Method Steps: The A.M. of the values is calculated. Difference between each value and the A.M. is calculated. All differences are considered positive. These are denoted as |d| The A.M. of these differences (called deviations) is the Mean Deviation. i.e. MD = Σ | d | n
  • 35.
    Example. Calculate the MeanDeviation of the following values; 2, 4, 7, 8 and 9.
  • 36.
  • 37.
    Mean Deviation forGrouped Data Steps 1. Calculate the mean of the distribution. 2. Calculate the absolute deviations |d| of the class midpoints from the mean. 3. Multiply each |d| value with its corresponding frequency to get f|d| values. Sum them up to get ∑f∣d∣. 4. Apply the following formula, M.D. = ∑f∣d∣ ∑f
  • 38.
    Example Calculate the meandeviation of the following distribution: Profits of Companies (Rs in lakhs) Number of Companies 11-20 5 21-30 8 31-40 16 41-50 8 51-60 3
  • 39.
    Solution M.D. = ∑f|d|= 334 = 8.35 ∑f 40 Class Intervals Frequency Mid-point (x) |d| f|d| 11-20 5 15.5 19 95 21-30 8 25.5 9 72 31-40 16 35.5 1 16 41-50 8 45.5 11 88 51-60 3 55.5 21 63 ∑f=40 ∑f|d|=334
  • 40.
    Standard deviation The StandardDeviation is a number that measures how far away each number in a set of data is from their mean ,it shows the variation in data. Standard Deviation is also known as root-mean square deviation as it is the square root of means of the squared deviations from the arithmetic mean. If the Standard Deviation is large it means the numbers are spread out from their mean. If the Standard Deviation is small it means the numbers are close to their mean. The symbol for Standard Deviation used for a sample data is s and the symbol used for a population data is σ.
  • 41.
    Formulas of StandardDeviation For ungrouped In case of individual observations, Standard Deviation can be computed in any of the two ways: 1. Take the deviation of the items from the actual mean 2. Take the deviation of the item from the assumed mean The formula for an ungroup data is: ´The formula for an ungroup data using assumed mean method: where d=x-a
  • 42.
    Example Step1 take thesquare of the values Step 2 take square of each value Step 3 take sum of both columns Step 4 Apply them to the formula S= ⎷(83/3 - (15)2/9) S= 1.41 x x 2 3 9 5 25 7 49 Σ=15 Σ=83
  • 43.
    Where Standard deviationis Applied Investment firms use Standard deviation for their mutual funds. In financial terms, standard deviation is used to measure risk involved in an investment. In physical experiments, it is important to have a measurement of uncertainty. Standard deviation provides a way to check the results. Very large values of standard deviation can mean the experiment is faulty. Web Analytics will help you get an idea of just how important events that happen on your website could be using Standard deviation.
  • 44.
    grouped data standardDeviation M = mid-point μ = Mean F = frequency n= number of samples Σ=sum σ2 = data variance σ= standard deviation
  • 45.
    Example Problem: Find anestimate of the variance and standard deviation of the following data for the marks obtained in a test by 88 students. Marks Frequency (f) 0 ≤ x < 10 6 10 ≤ x < 20 16 20 ≤ x < 30 24 30 ≤ x < 40 25 40 ≤ x < 50 17
  • 46.
    step 1:find themid-point for each group or range of the frequency table. (0+10)/2 = 5 (10+20)/2= 15 (20+30)/2= 25 (30+40)/2= 35 (40+50)/2= 45
  • 47.
    step 2: calculatethe number of samples of a data set by summing up the frequencies. n= 6+16+24+25+17= 88 step 3: find the mean for the grouped data by dividing the addition of multiplication of each group mid-point and frequency of the data set by the number of samples. μ= Σ(M*F)/n μ= (5×6 + 15×16 + 25×24 + 35×25 + 45×17)/n μ= 2510/88 = 28.5227
  • 48.
    Step 4: calculatethe variance for the frequency table data. σ2=Σ(F × M2) - (n × μ2)/(n - 1) σ2= (6×52 + 16×152 + 24×252 + 25×352 + 17×452) - (88 × (28.5227)2)/(88-1) σ2= 138.73 step 5:estimate standard deviation for the frequency table by taking square root of the variance. σ= √138.73 = 11.78
  • 49.
    Solve the case Findthe following measures: 1. Range 2. Mean deviation 3. Standard deviation 4. Quartile deviation Time Frequency 0.5 4 1.3 5 1.6 3 2.3 9 2.6 1 3.1 3 Time Frequency 1.2-1.8 10 1.9-2.5 11 2.6-3.2 5 3.3-3.9 3 4.0-4.6 2 4.7-5.3 1
  • 50.
    Use the followingformulas to solve the problem 1. Range=maximum−minimum 2. Quantile deviation=Q3-Q1/2 Grouped Q1= L+((N/4*CF)/F)i Q3=L+((3n-CF/F))i Ungrouped Q1=(n+1)/4 Q3=3(n+1)/4
  • 51.
  • 52.
    time frequ ency m.p c.ffx d d2 fd 1.2- 1.8 10 1.5 10 15 276 7617 6 2760 1.9- 2.5 11 4.4 21 48.4 242.6 5885 4.76 2668. 6 2.6- 3.2 5 5.8 26 29 262 6864 4 1310 3.3- 3.9 3 7.2 29 21.6 269.4 7257 6.36 808.2 4.0- 4.6 2 8.6 31 172 119 1416 1 238 4.7- 5.3 1 5 32 5 286 8179 6 286
  • 53.
    tme frequency c.fd d2 fd fd2 0.5 4 4 3.6 12.96 14.4 51.84 1.3 5 11 2.8 7.84 14 39.2 1.6 3 14 2.5 6.25 7.5 18.75 2.3 9 23 1.86 3.46 16.74 31.14 2.6 1 24 1.56 2.43 1.56 1.56 3.1 3 27 1.06 1.12 3.18 9.54
  • 54.
    Suitability of adispersion method Range is the simplest method of studying dispersion. Range is the difference between the smallest value and the largest value of a series. While computing range, we do not take into account frequencies of different groups. Formula: Absolute Range = L – S Coefficient of Range = where, L represents largest value in a distribution S represents smallest value in a distribution
  • 55.
    Standard Deviation Advantages:- •Shows howmuch data is clustered around a mean value •It gives a more accurate idea of how the data is distributed •Not as affected by extreme values Disadvantages:- •It doesn't give you the full range of the data •It can be hard to calculate •Only used with data where an independent variable is plotted against the frequency of it •Assumes a normal distribution pattern
  • 56.
    The mean deviationis actually more efficient than the standard deviation in the realistic situation where some of the measurements are in error, more efficient for distributions other than perfect normal, closely related to a number of other useful analytical techniques, and easier to understand.
  • 57.
    References ● https://www.thoughtco.com/what-is-the-range-in-statistics-3126248 ● http://www.transtutors.com/homework-help/statistics/measures-of-dispersion/uses-range.aspx ●http://www.mathopolis.com/questions/q.php?id=696&site=1&ref=/data/range.html&qs=696_740_1468_1469_2159_2160_3064_3065_3 798_3799 ● http://www.mathopolis.com/questions/q.php?id=3799&site=1&ref=/data/range.html&qs=696_740_1468_1469_2159_2160_3064_3065_ 3798_3799 ● https://www.youtube.com/watch?v=vuhB1O8q0ys ● http://mba-lectures.com/statistics/descriptive-statistics/279/range.html ● http://www.kuk.ac.in/userfiles/file/distance_education/Year-2011-2012/Lecture-2%20(Paper%205(a)).pdf ● http://eagri.tnau.ac.in/eagri50/STAM101/pdf/lec05.pdf ● http://ncert.nic.in/ncerts/l/keep215.pdf ● http://labstat.psa.gov.ph/learnstat/3_Measures%20of%20Central%20Tendency,%20Dispersion%20and%20Skewness.pdf ● http://www.emathzone.com/tutorials/basic-statistics/quartile-deviation-and-its-coefficient.html ● http://www.mathsteacher.com.au/year10/ch16_statistics/05_quartiles/24quartiles.htm ● http://www.statisticshowto.com/what-are-quartiles/ ● https://www.easycalculation.com/statistics/learn-quartile-deviation-calculator.php ● https://www.mathway.com/examples/statistics/frequency-distribution/finding-the-class-boundaries?id=1003
  • 58.

Editor's Notes