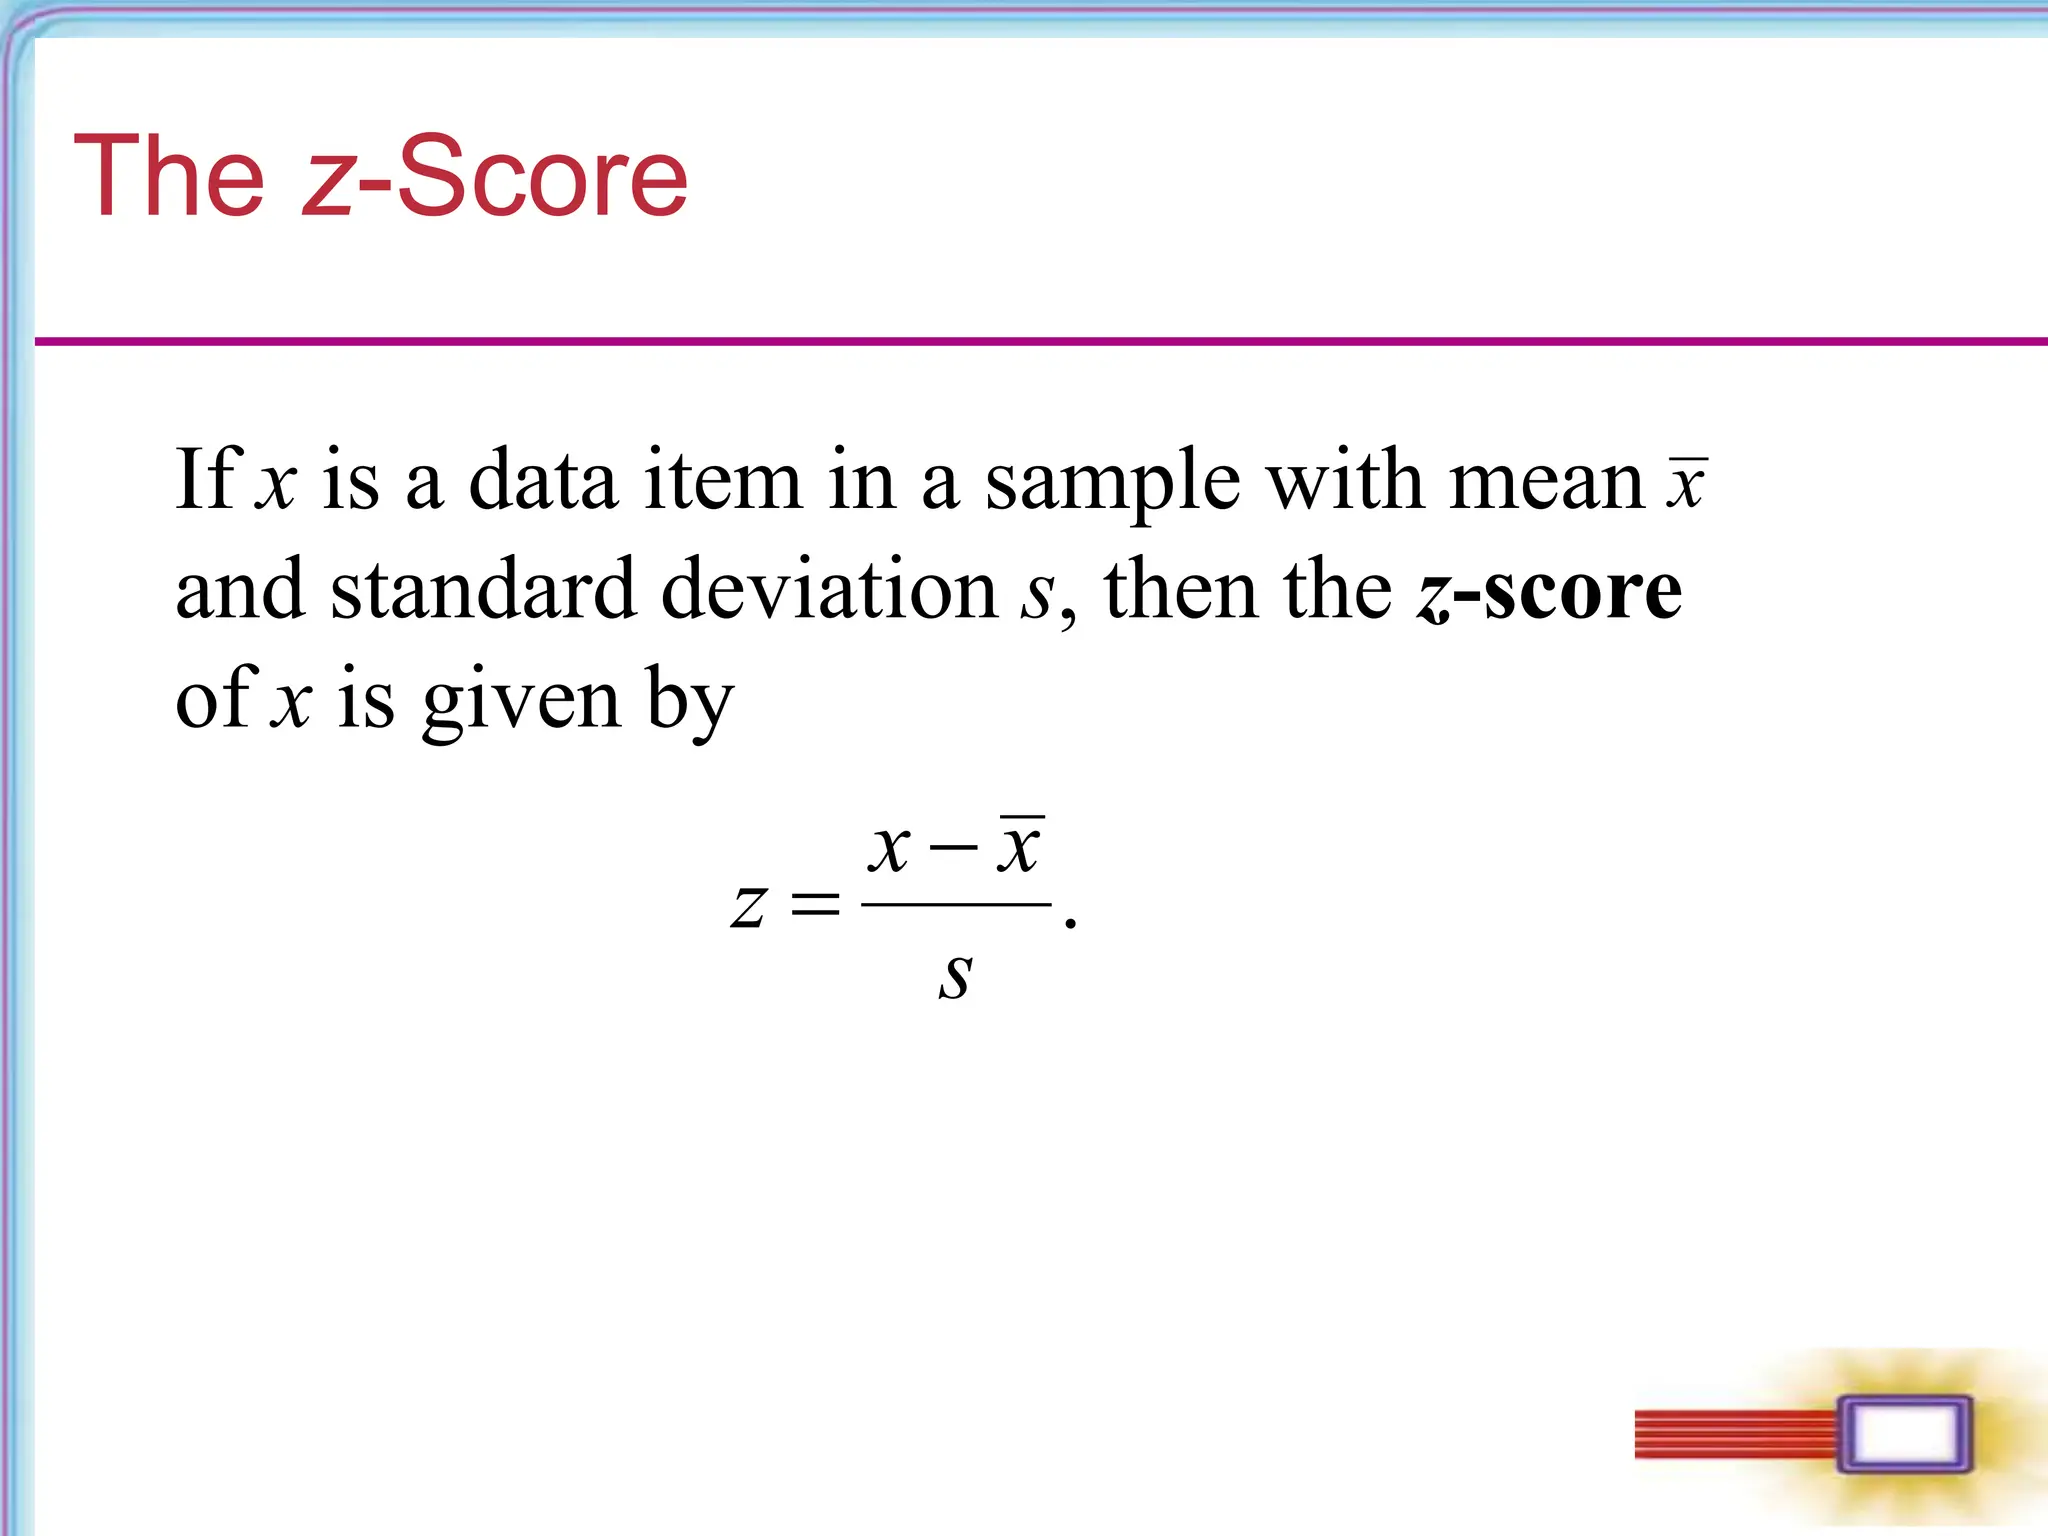
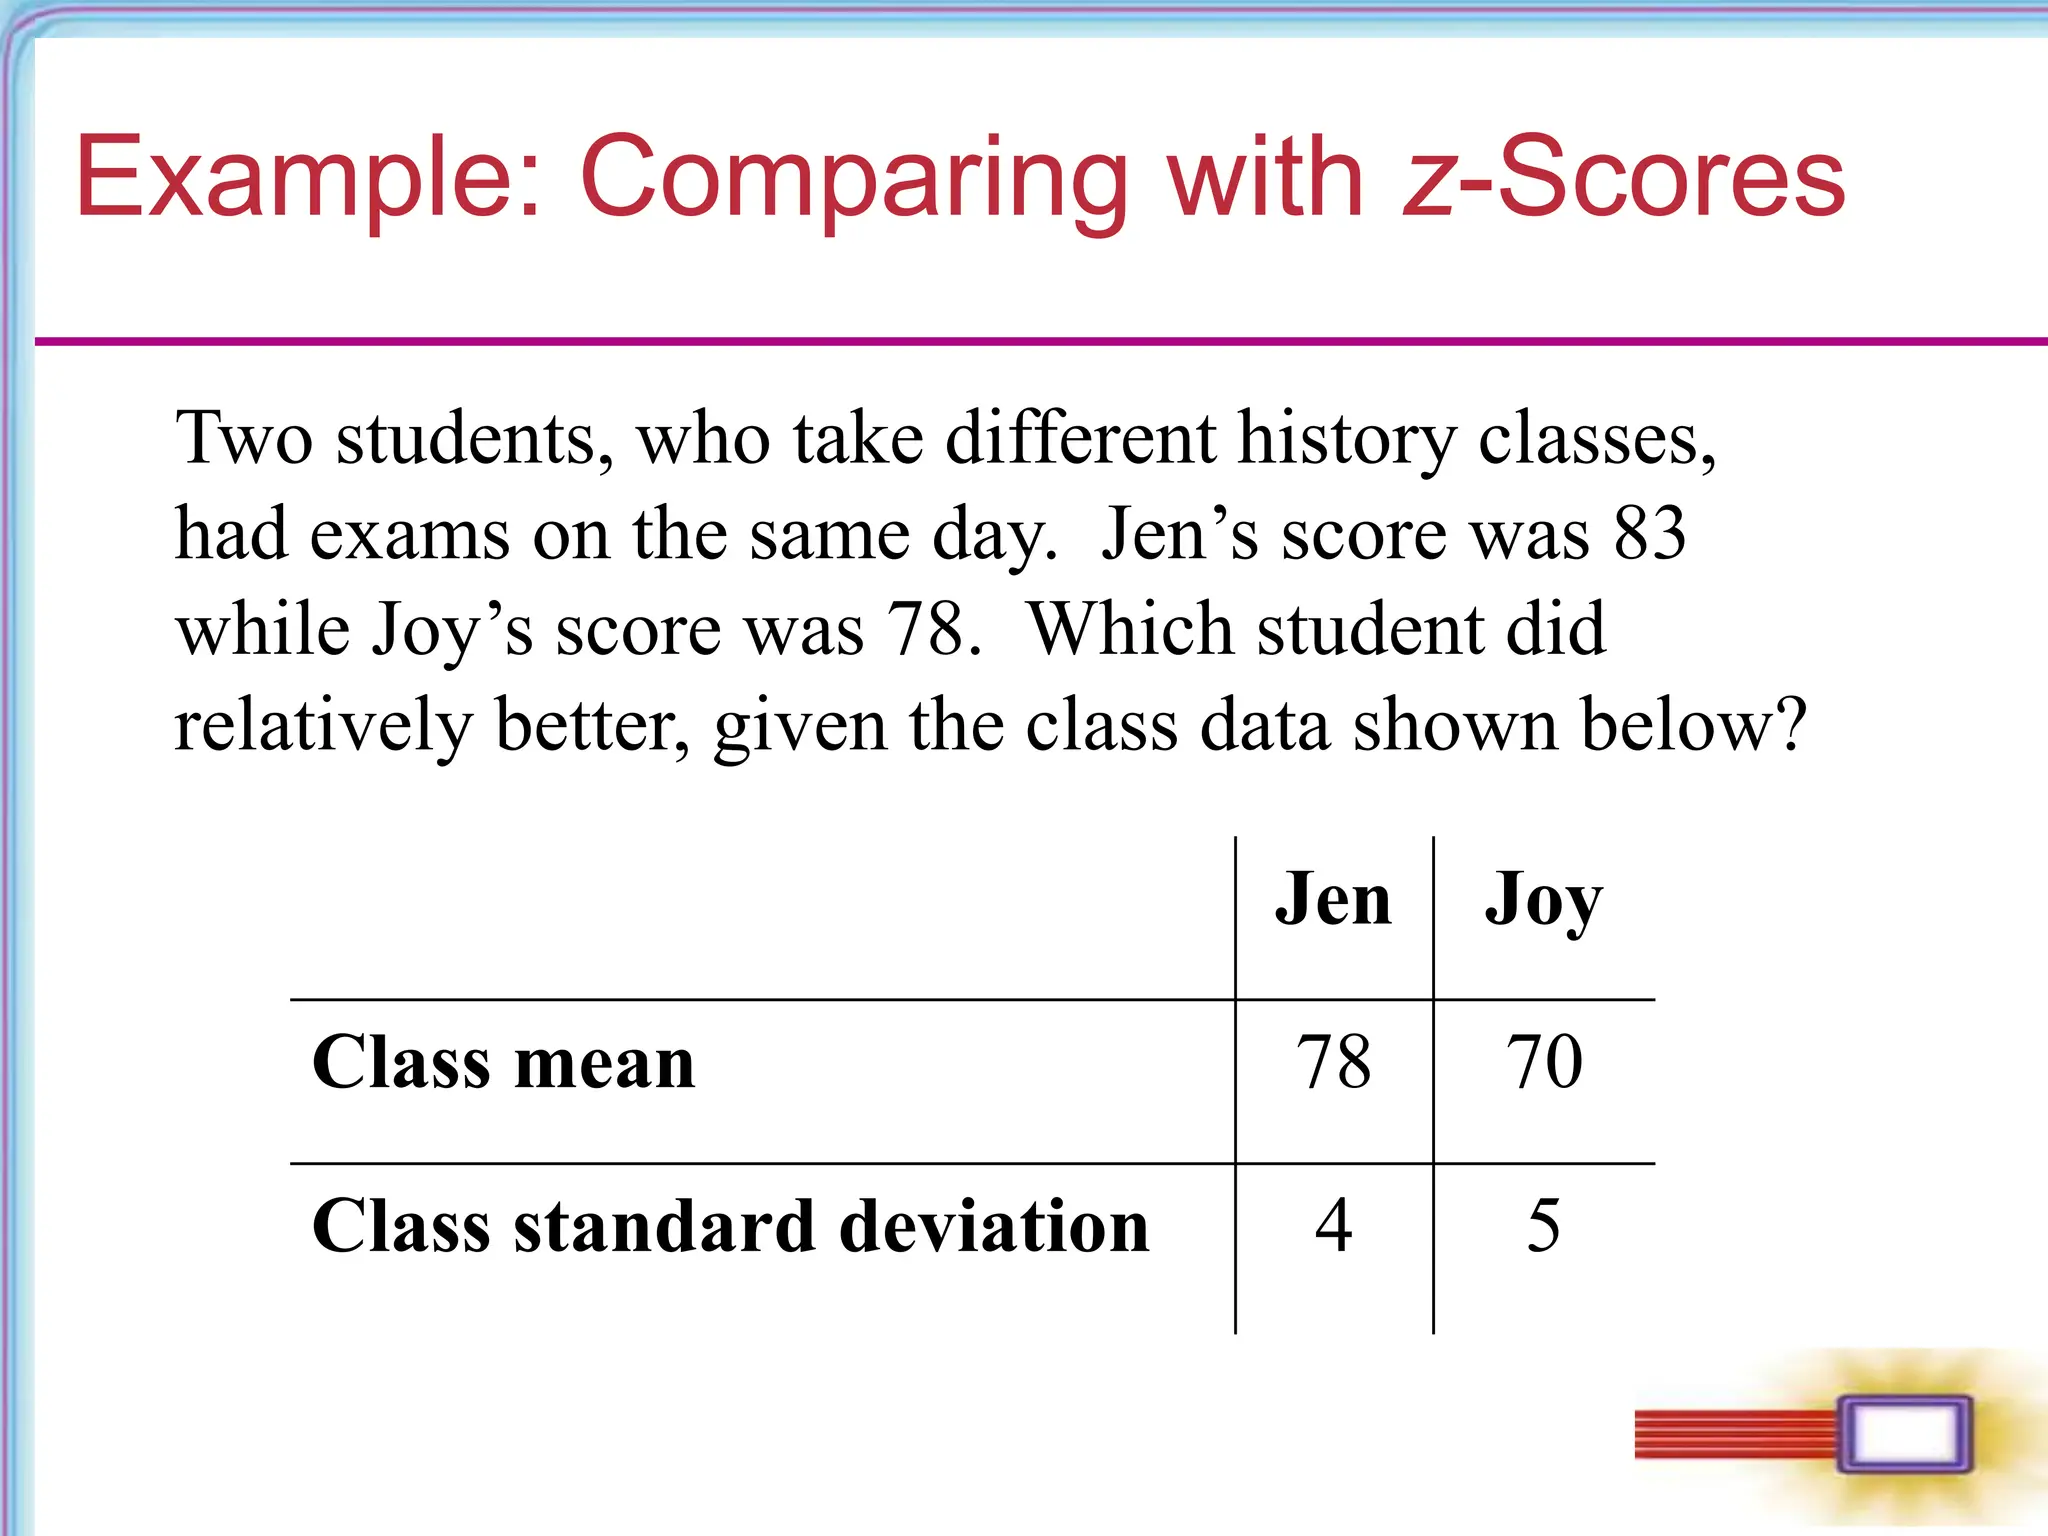
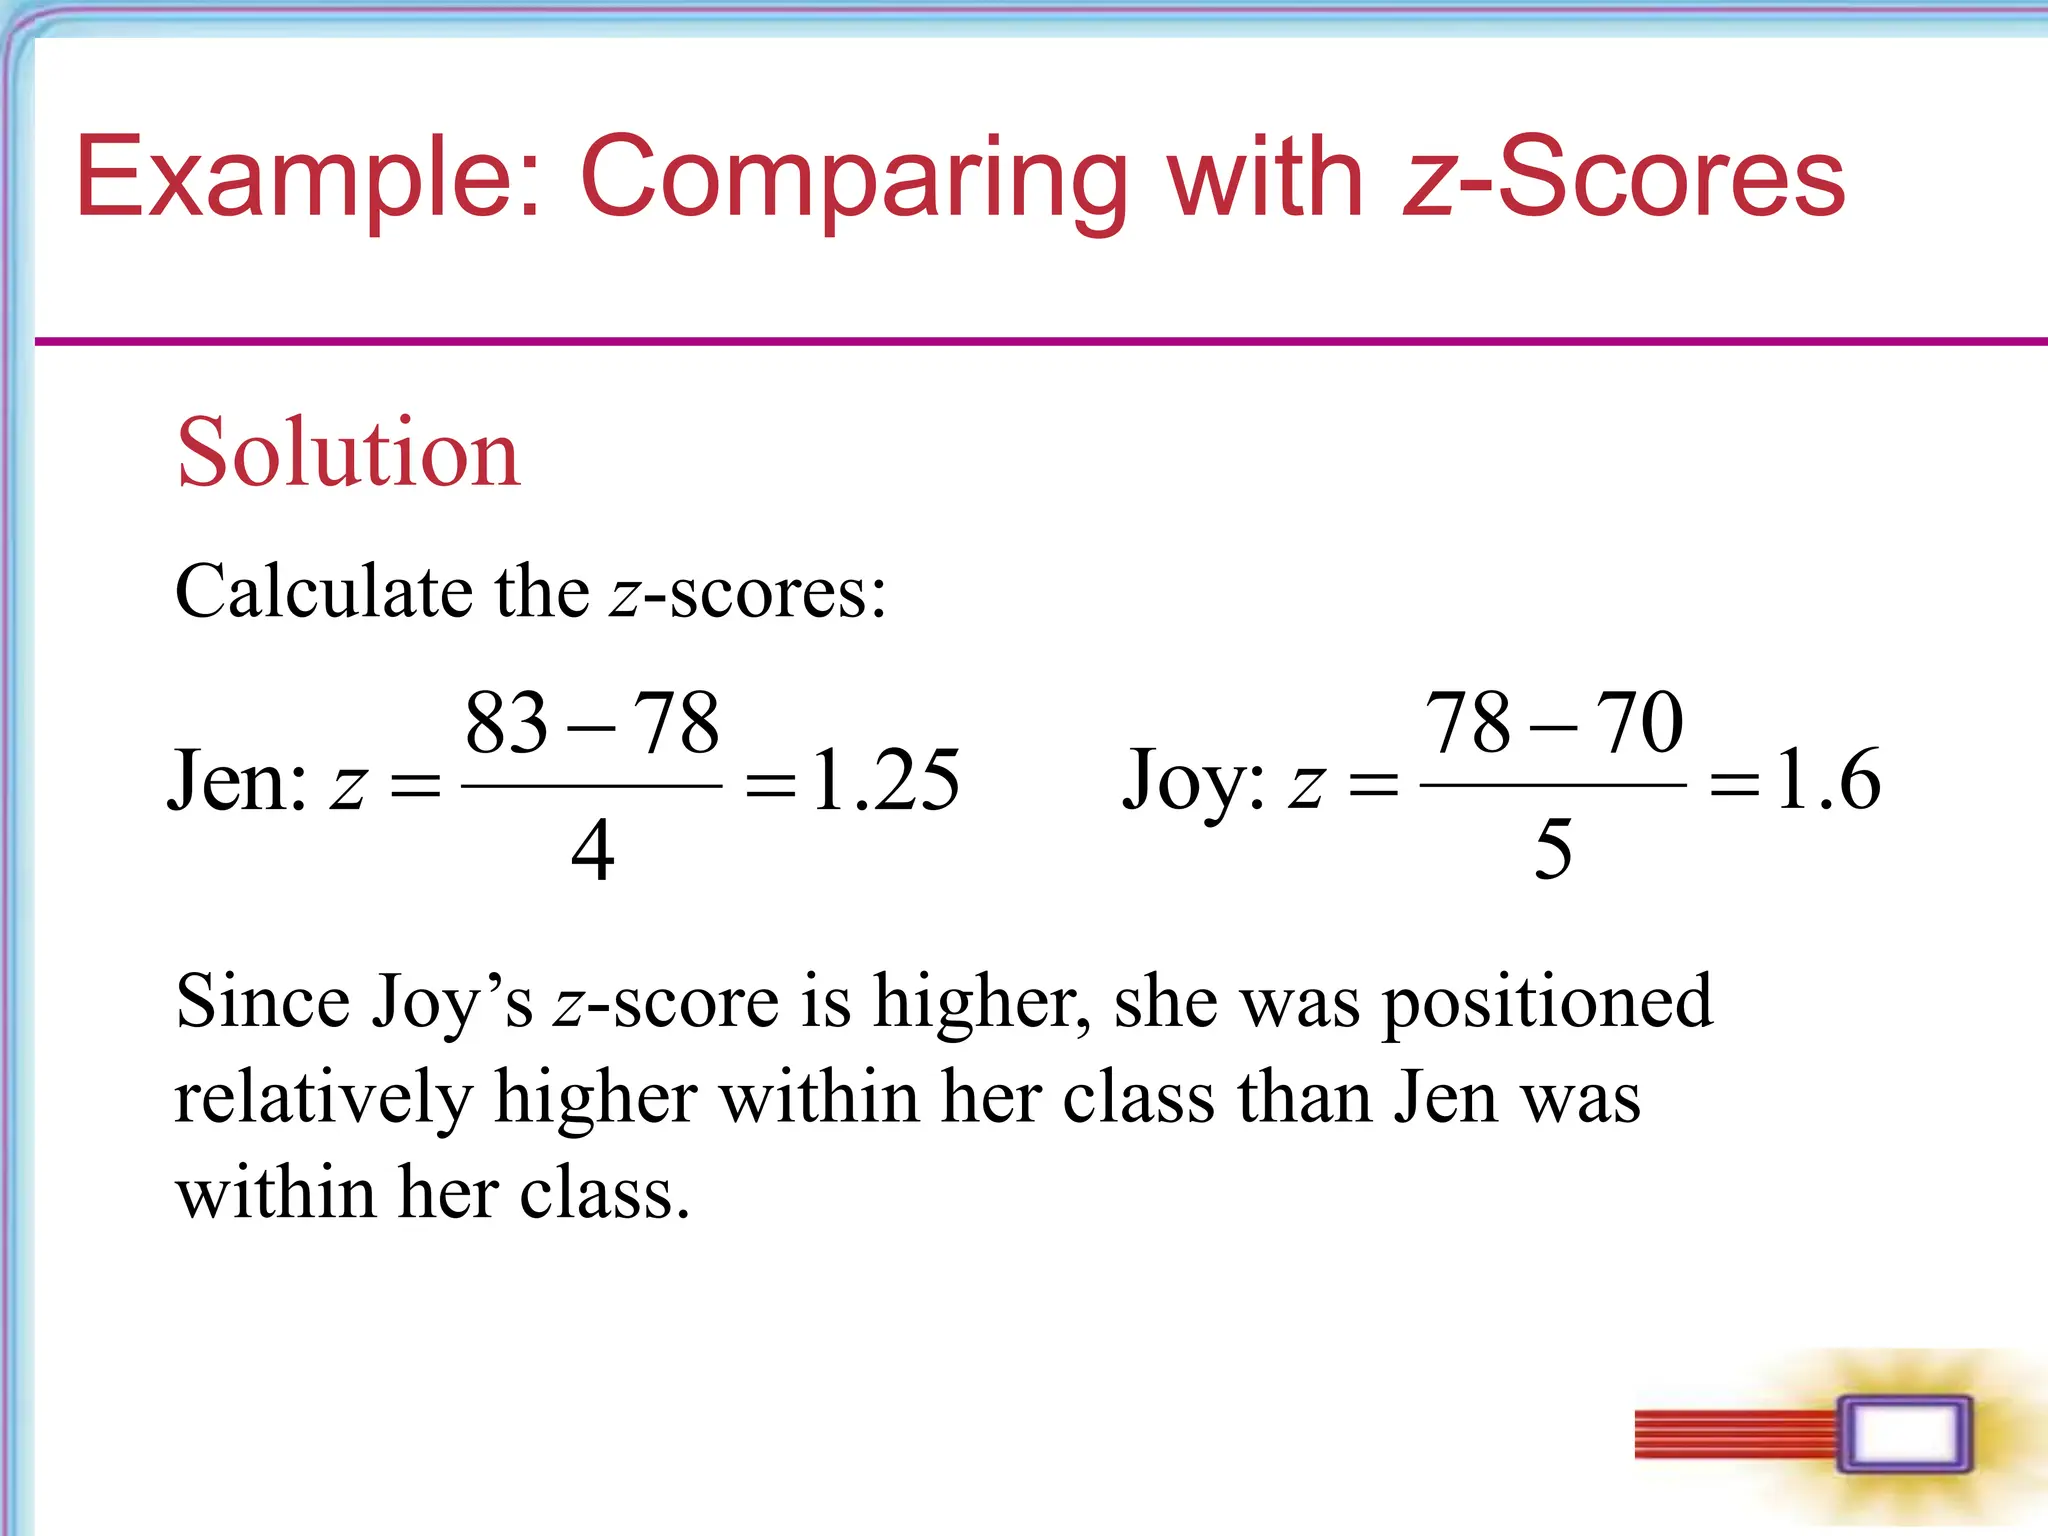
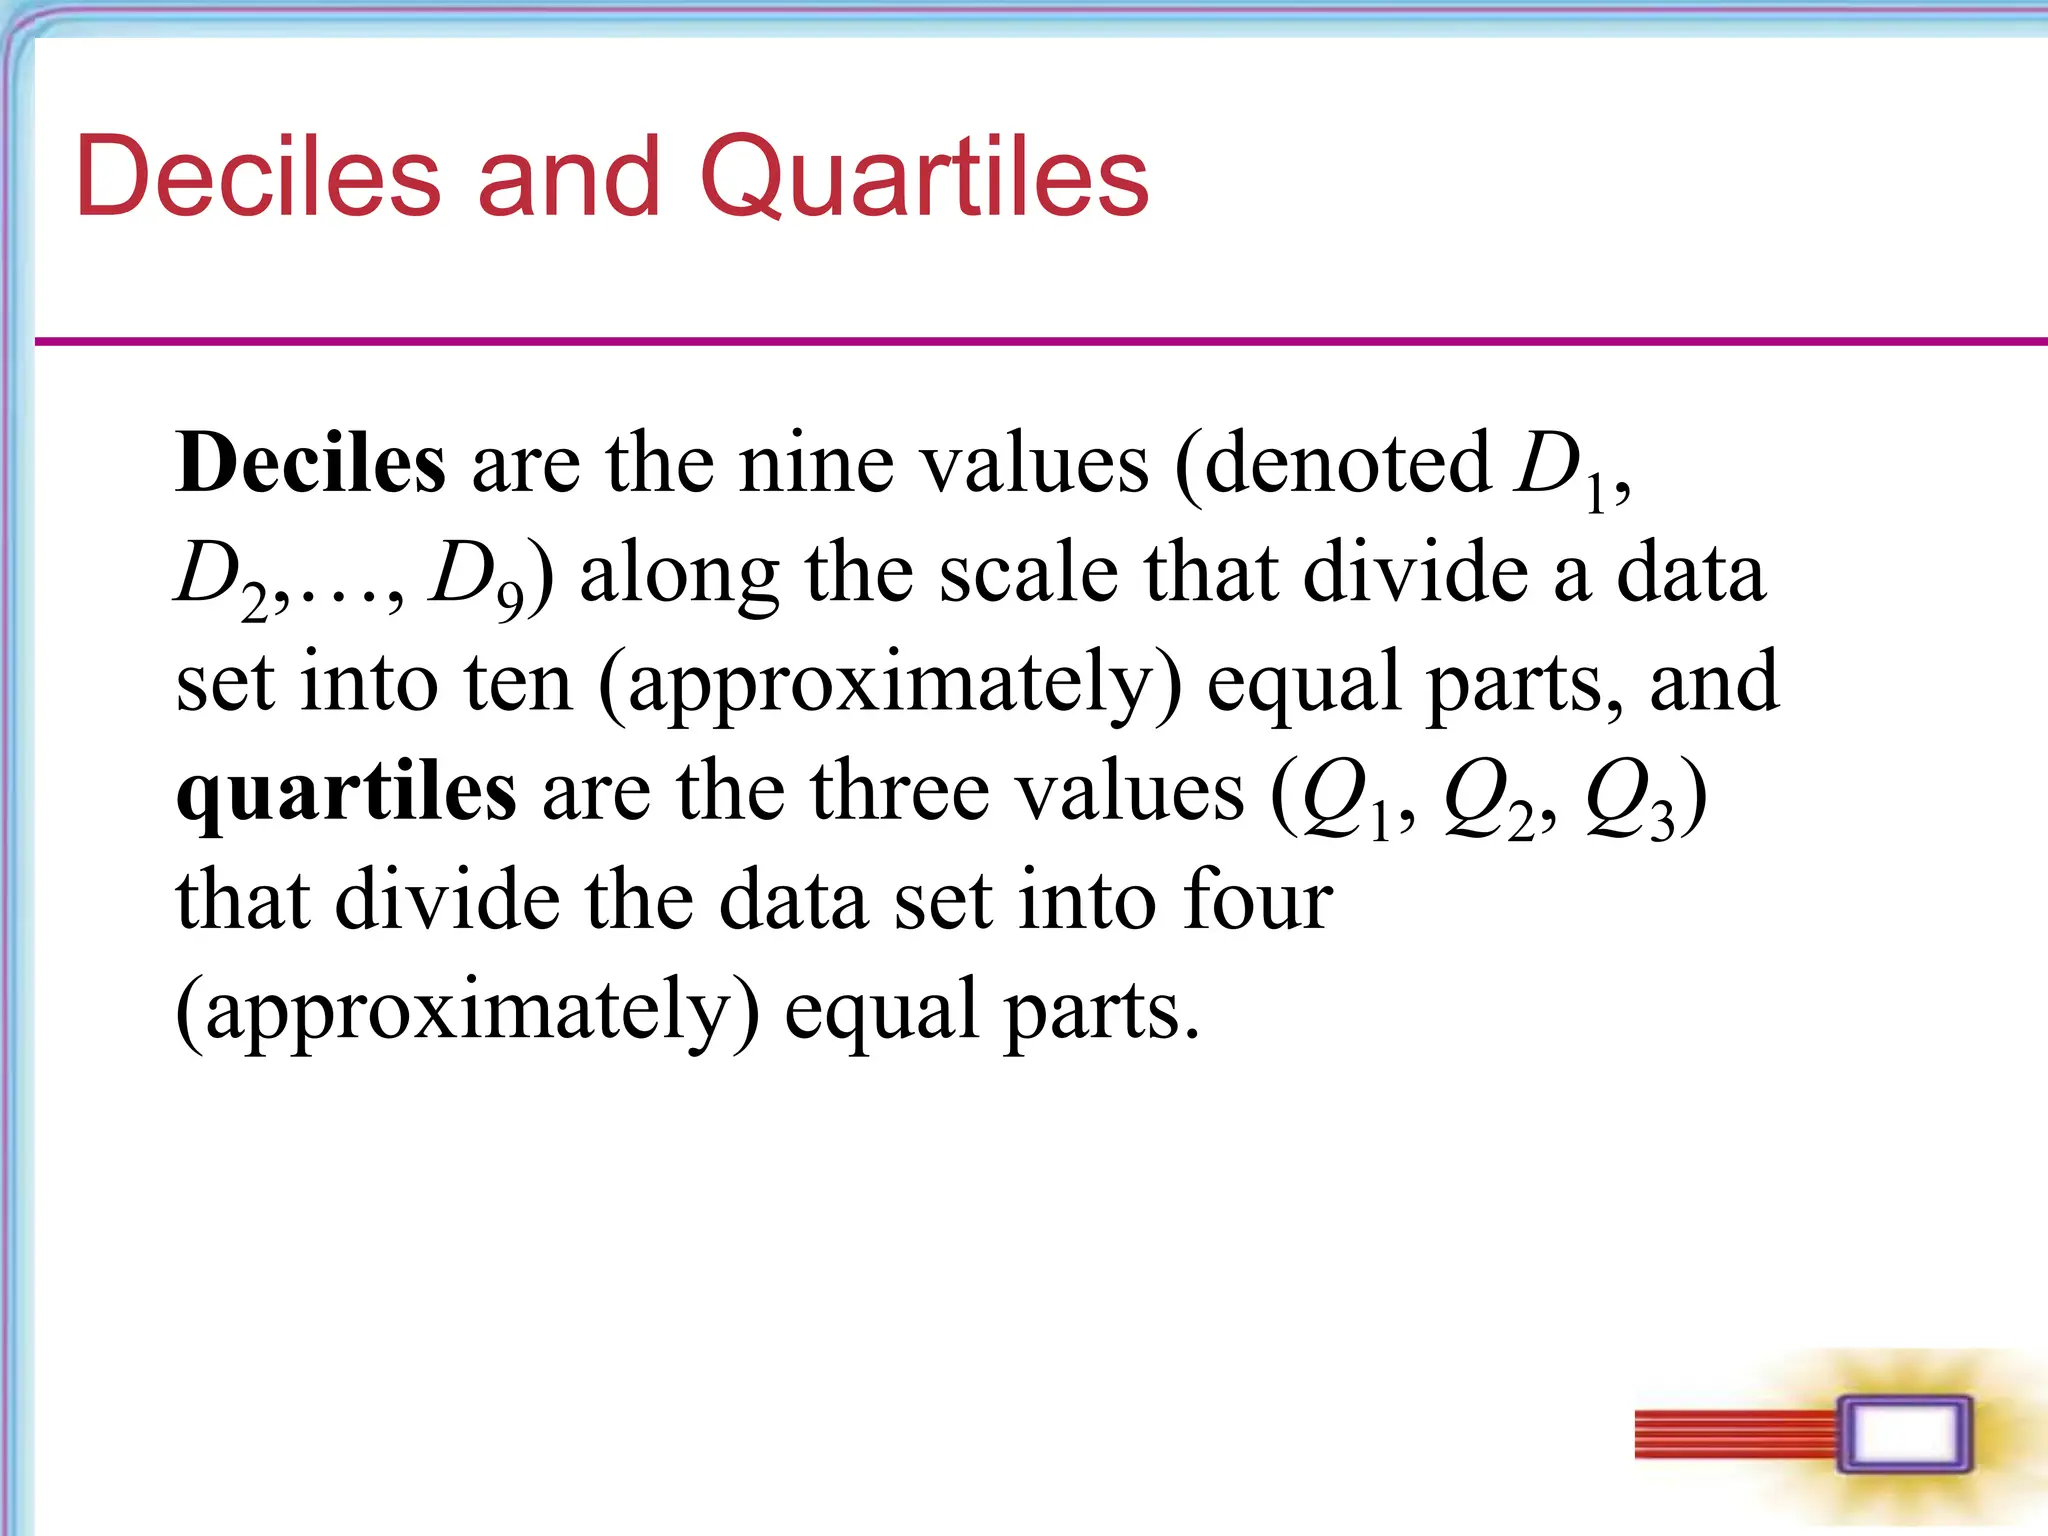
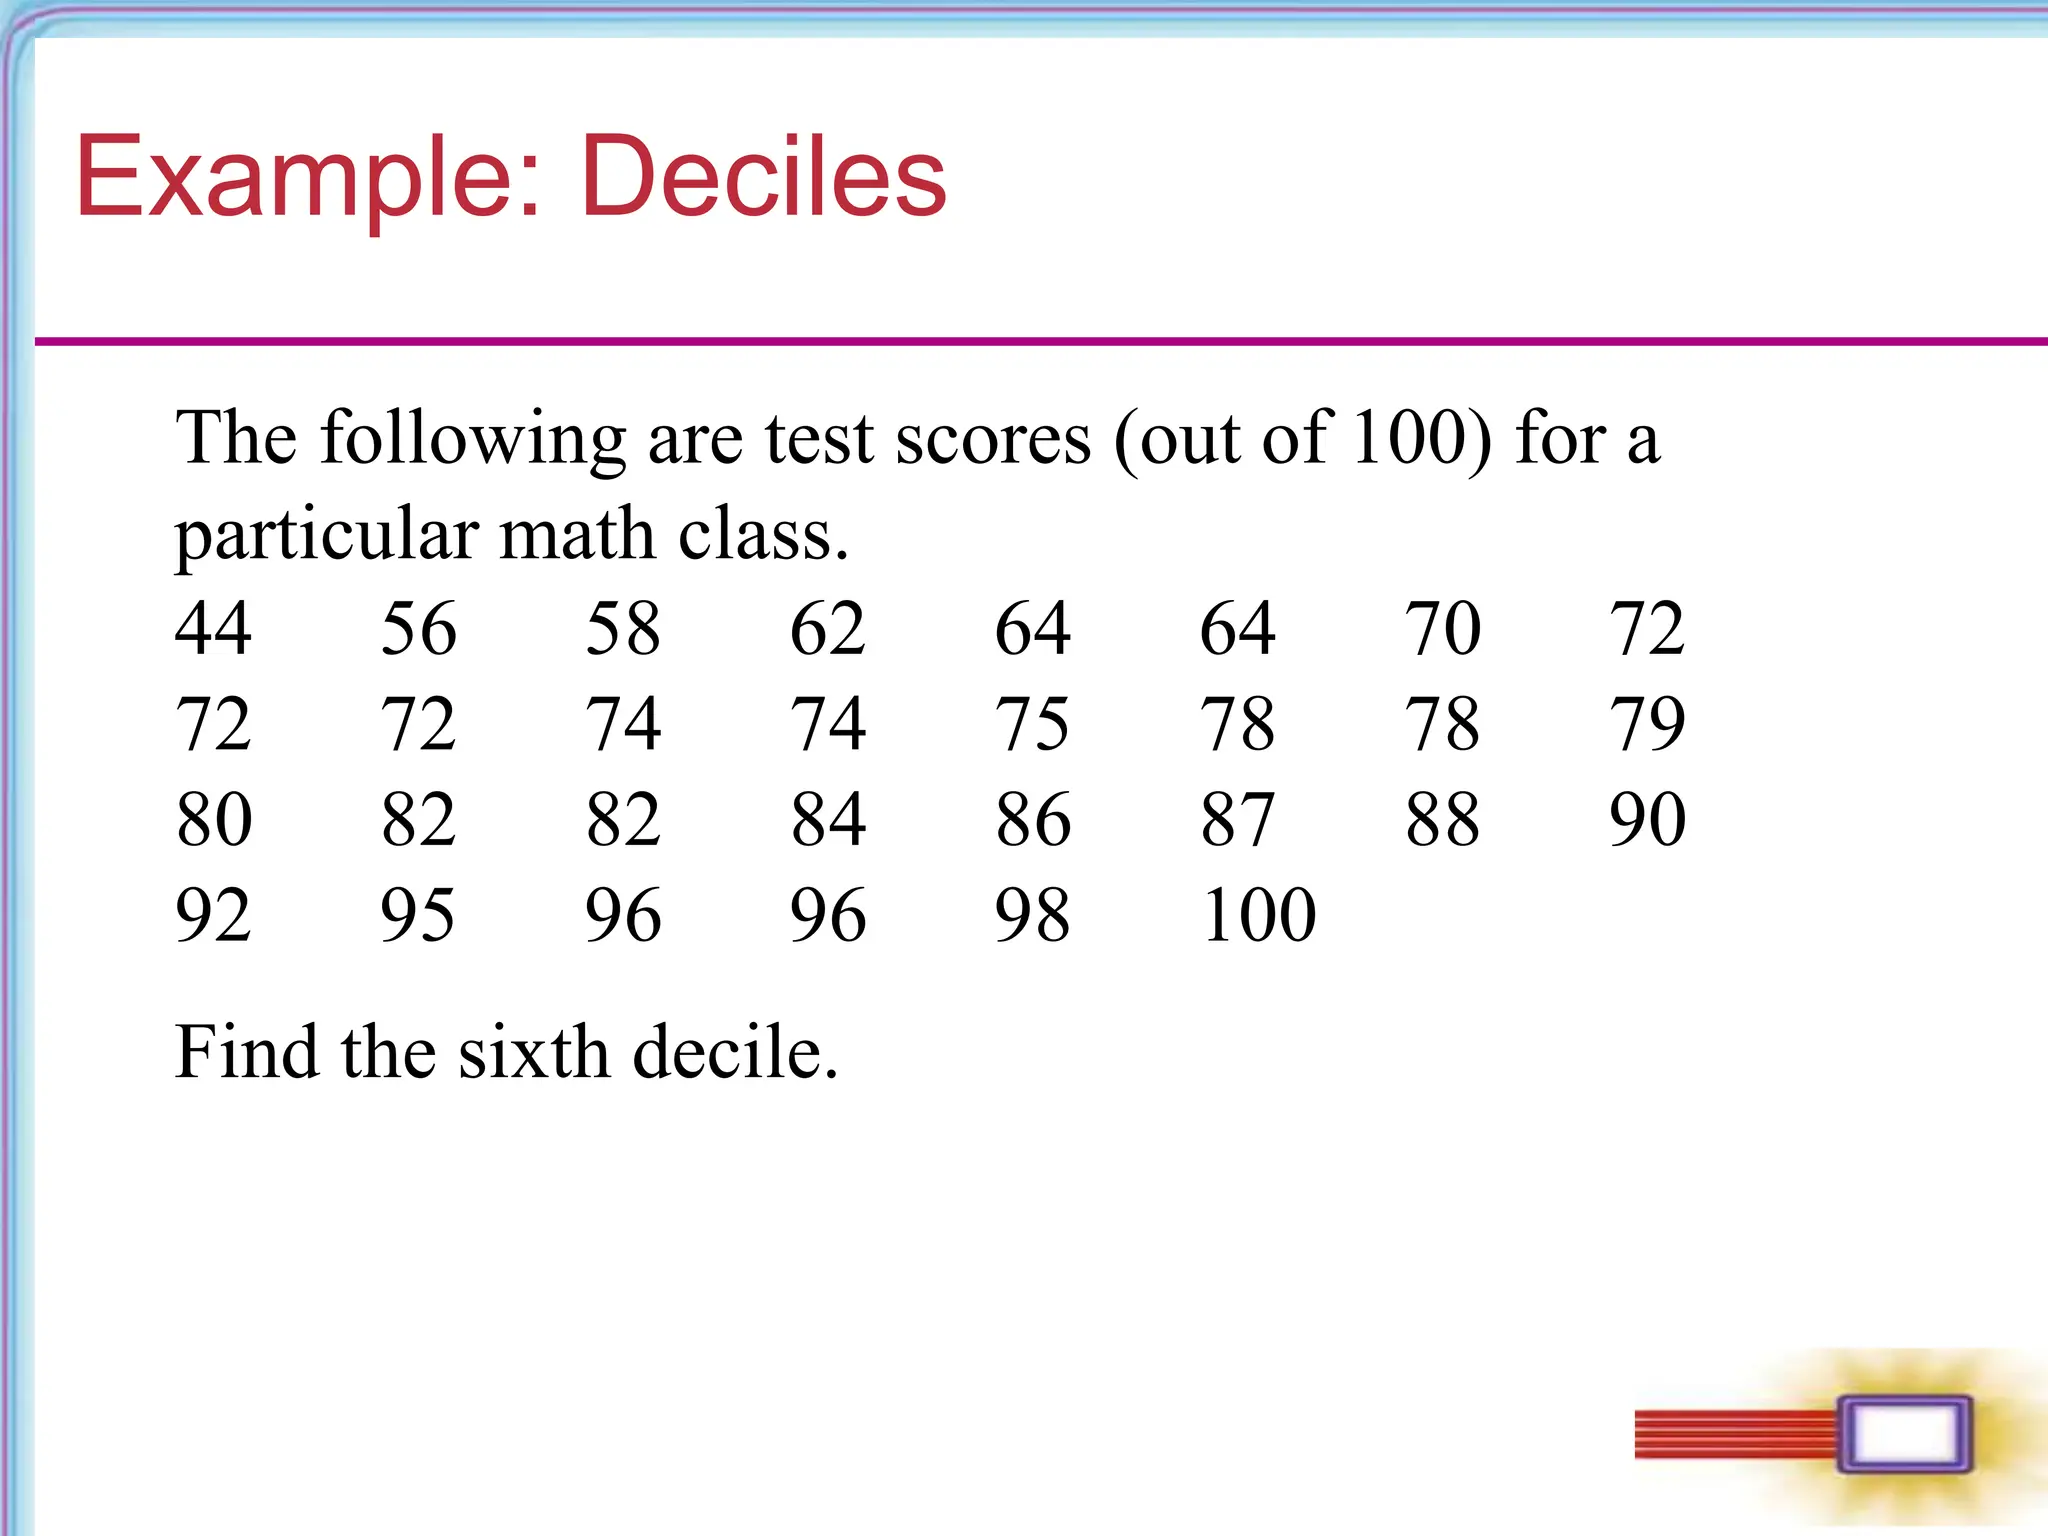
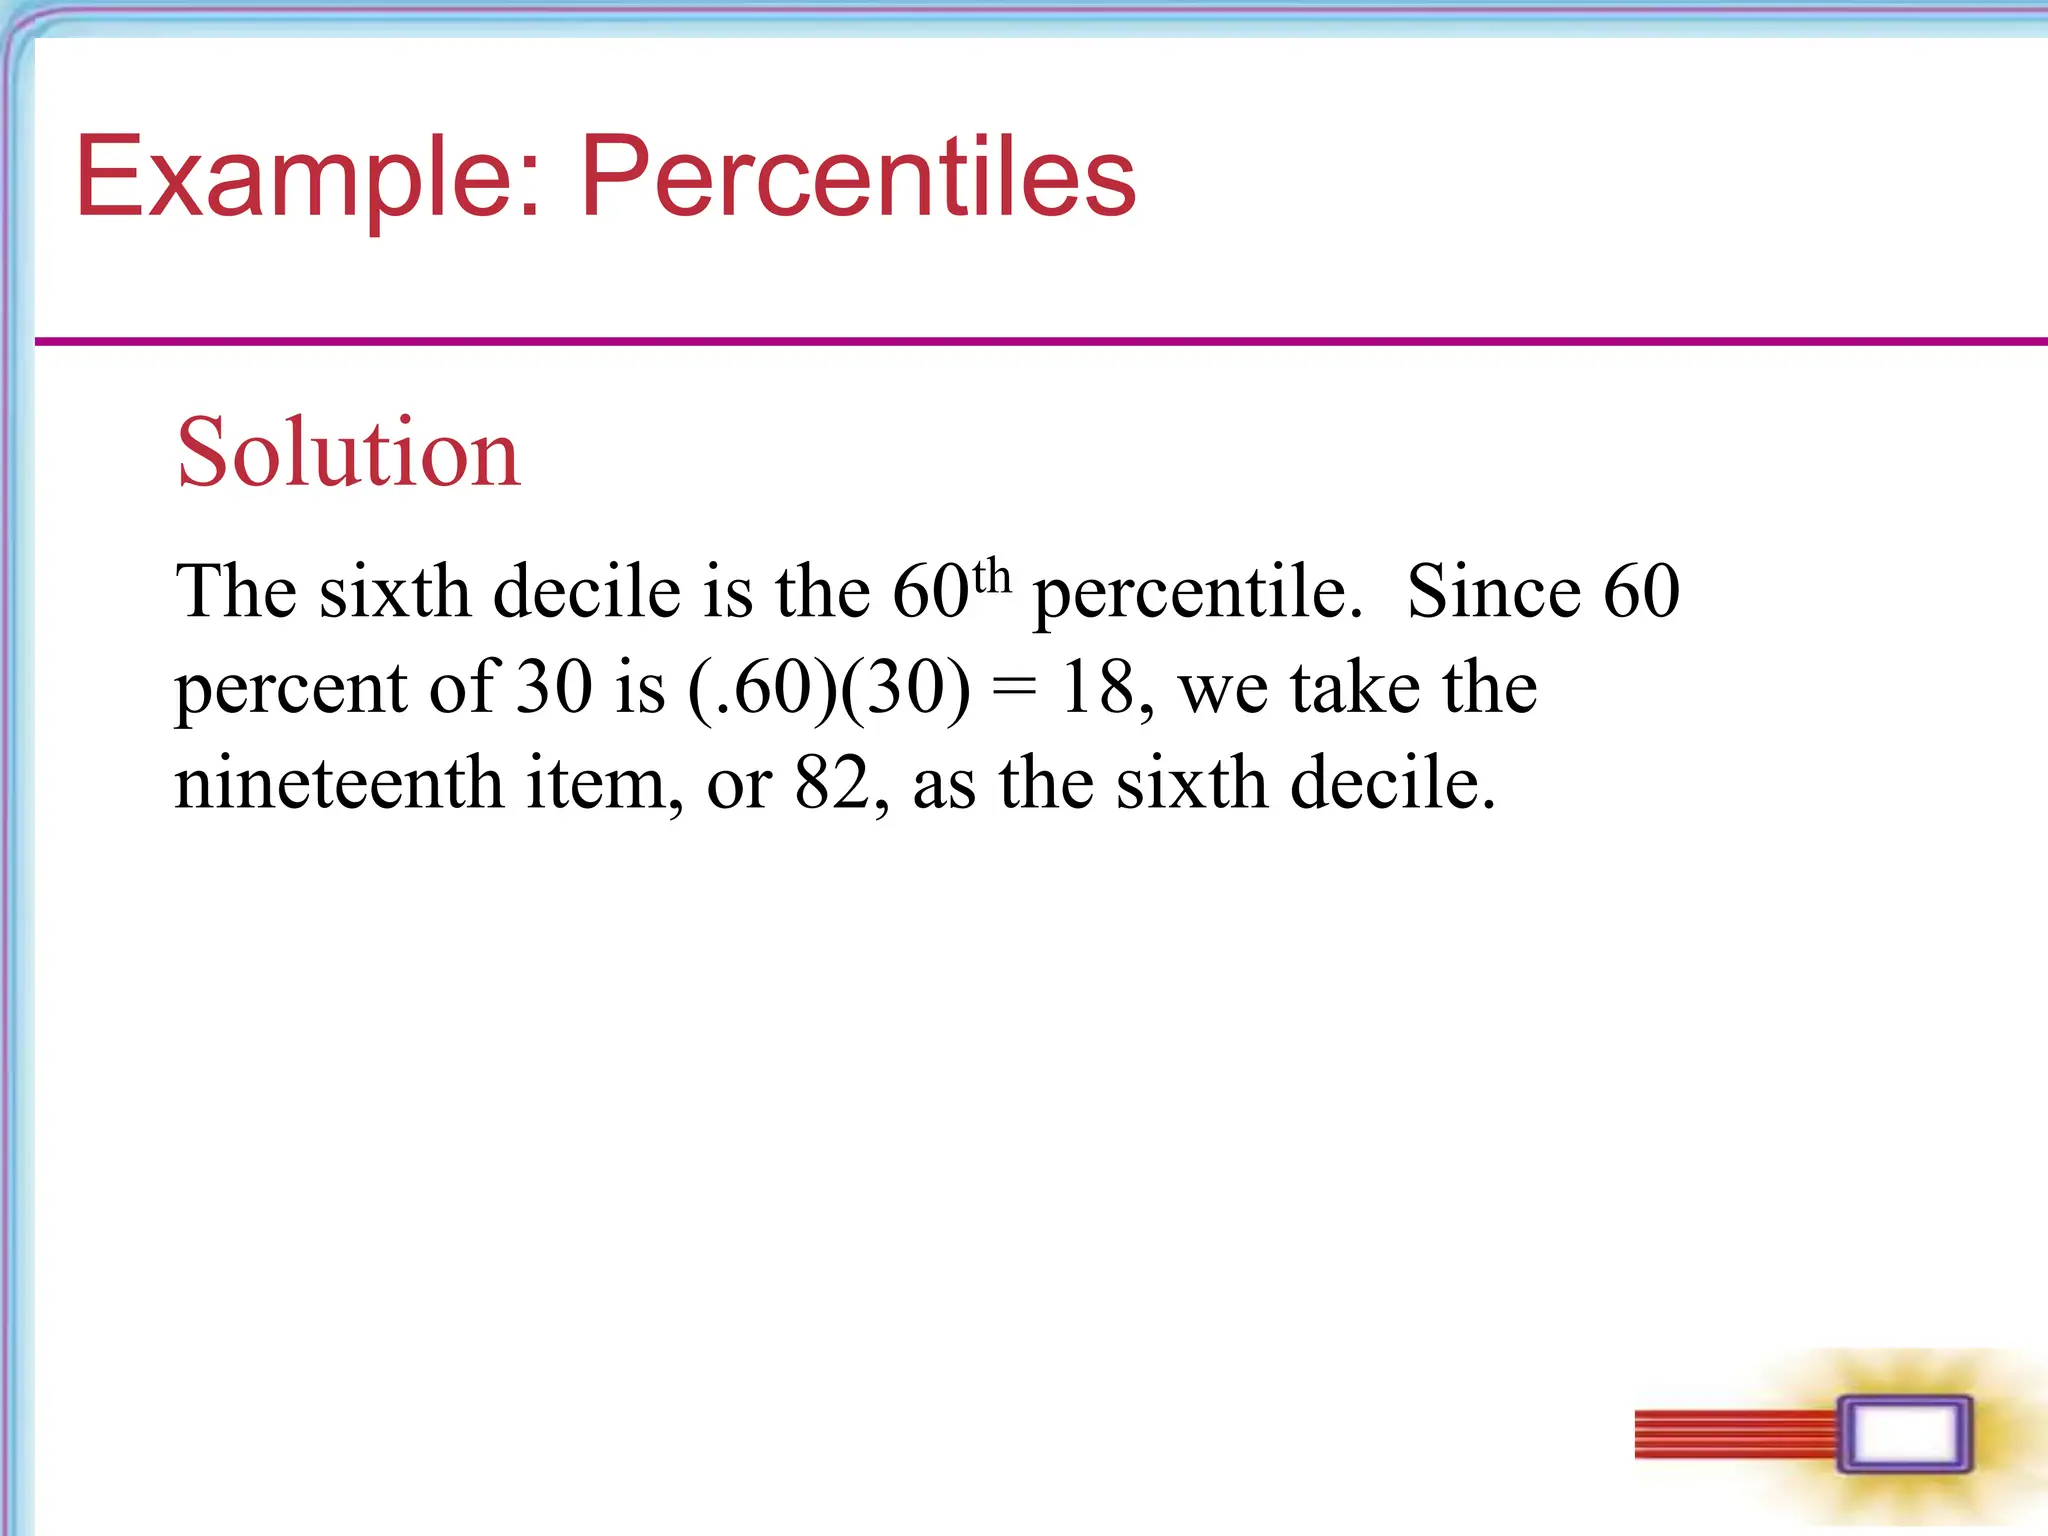
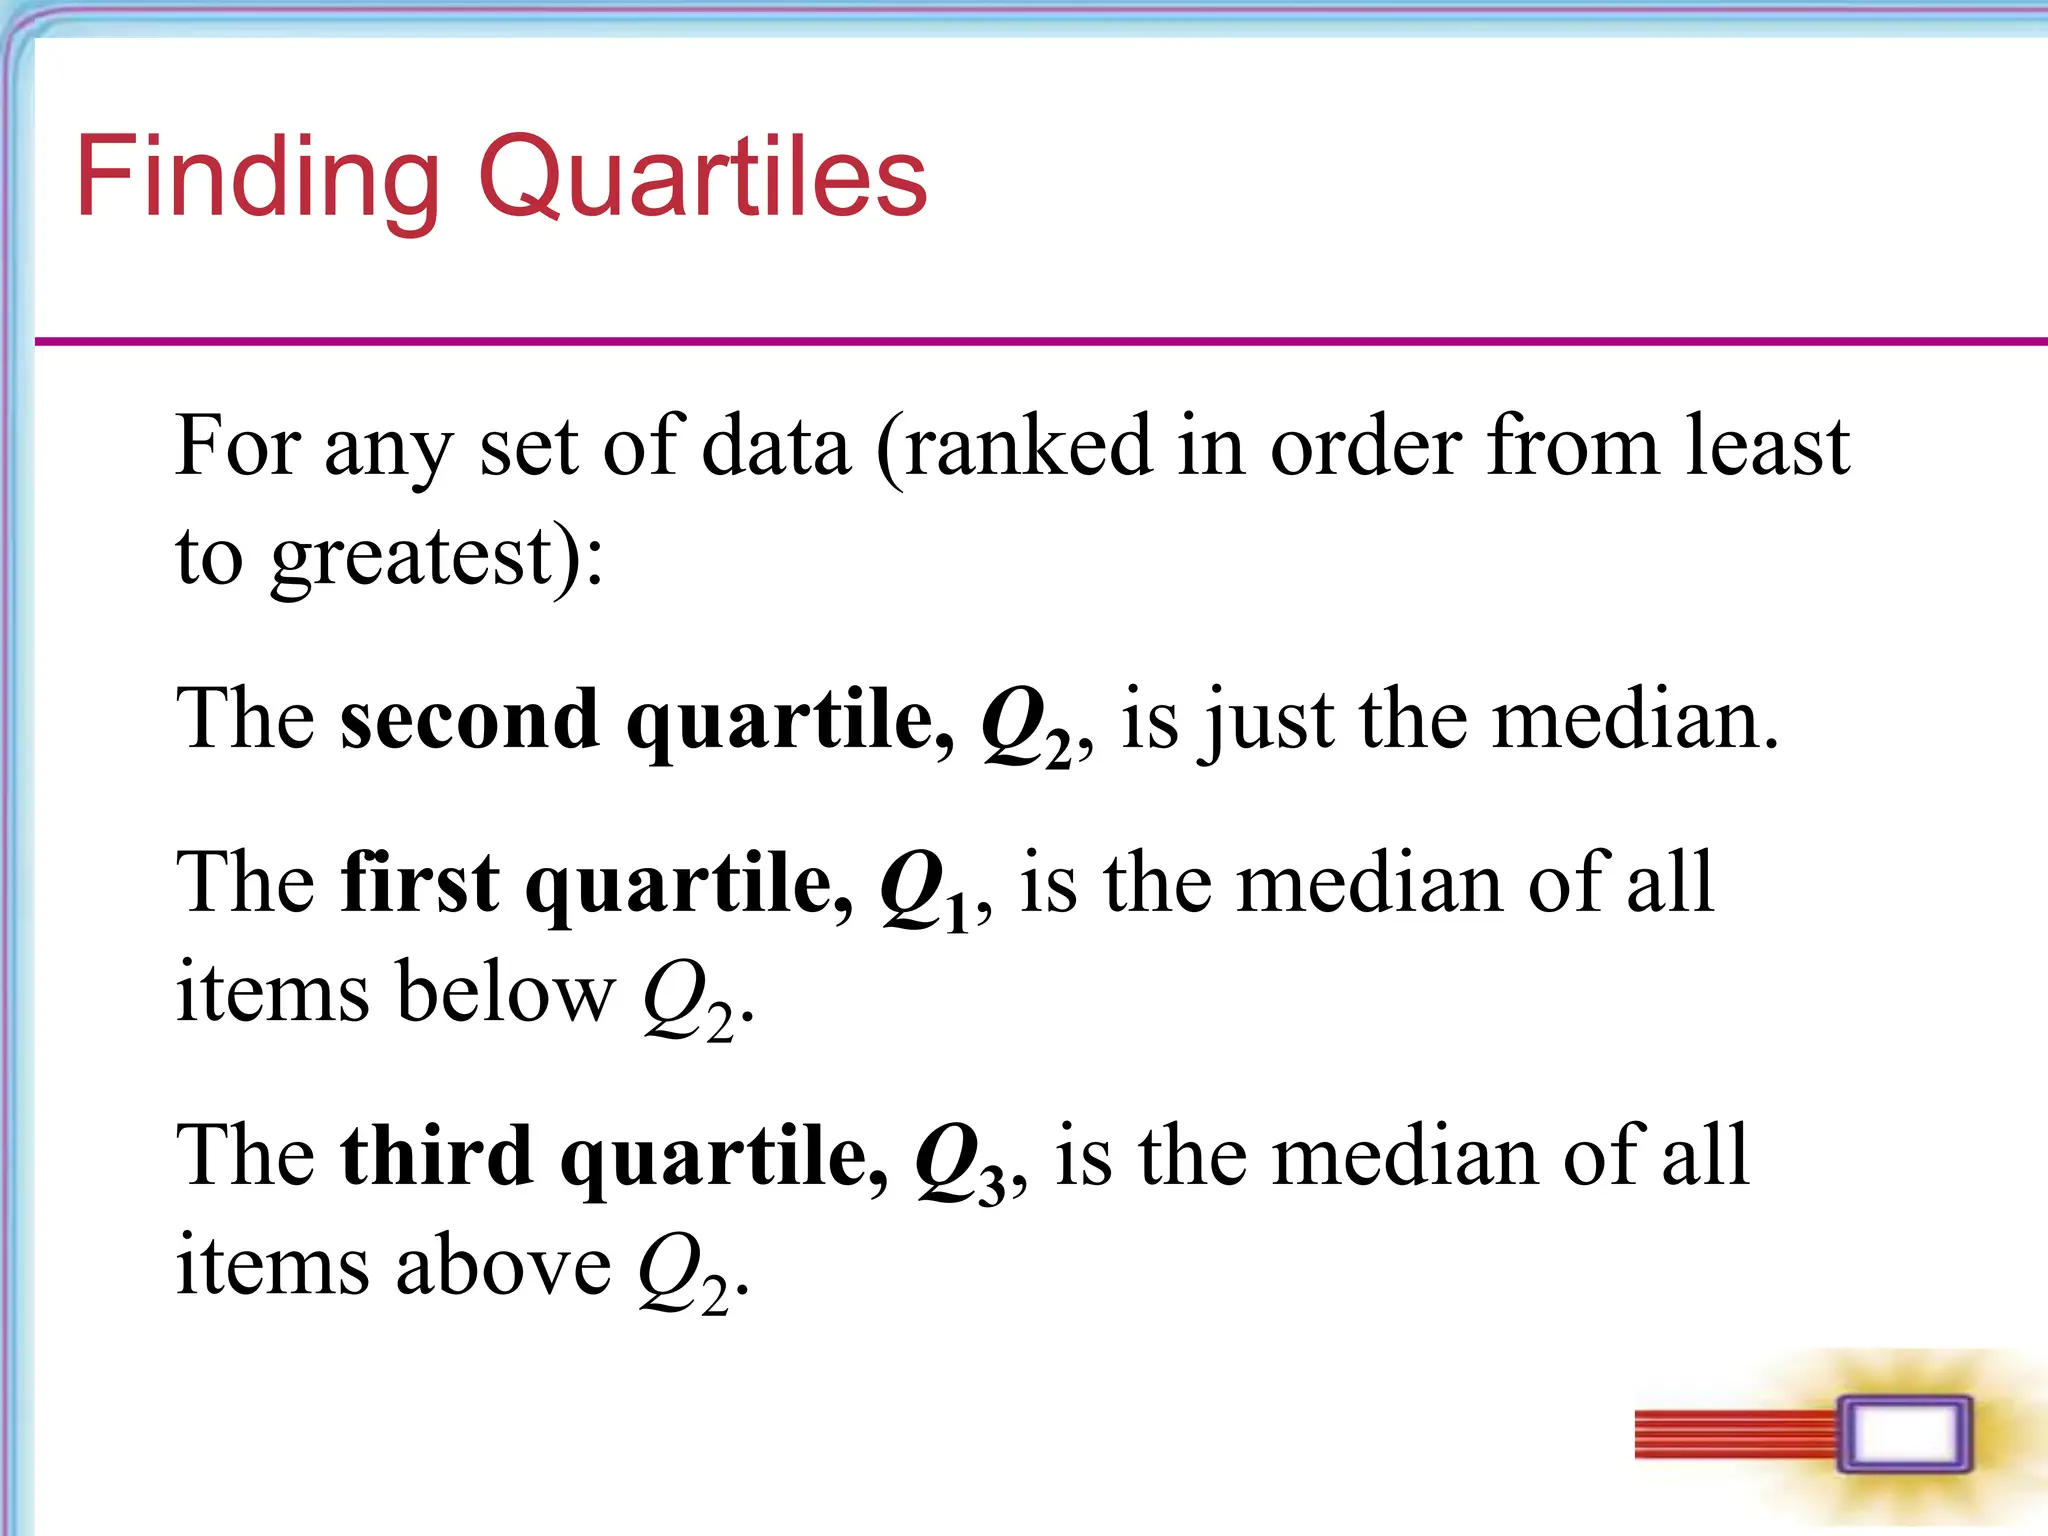
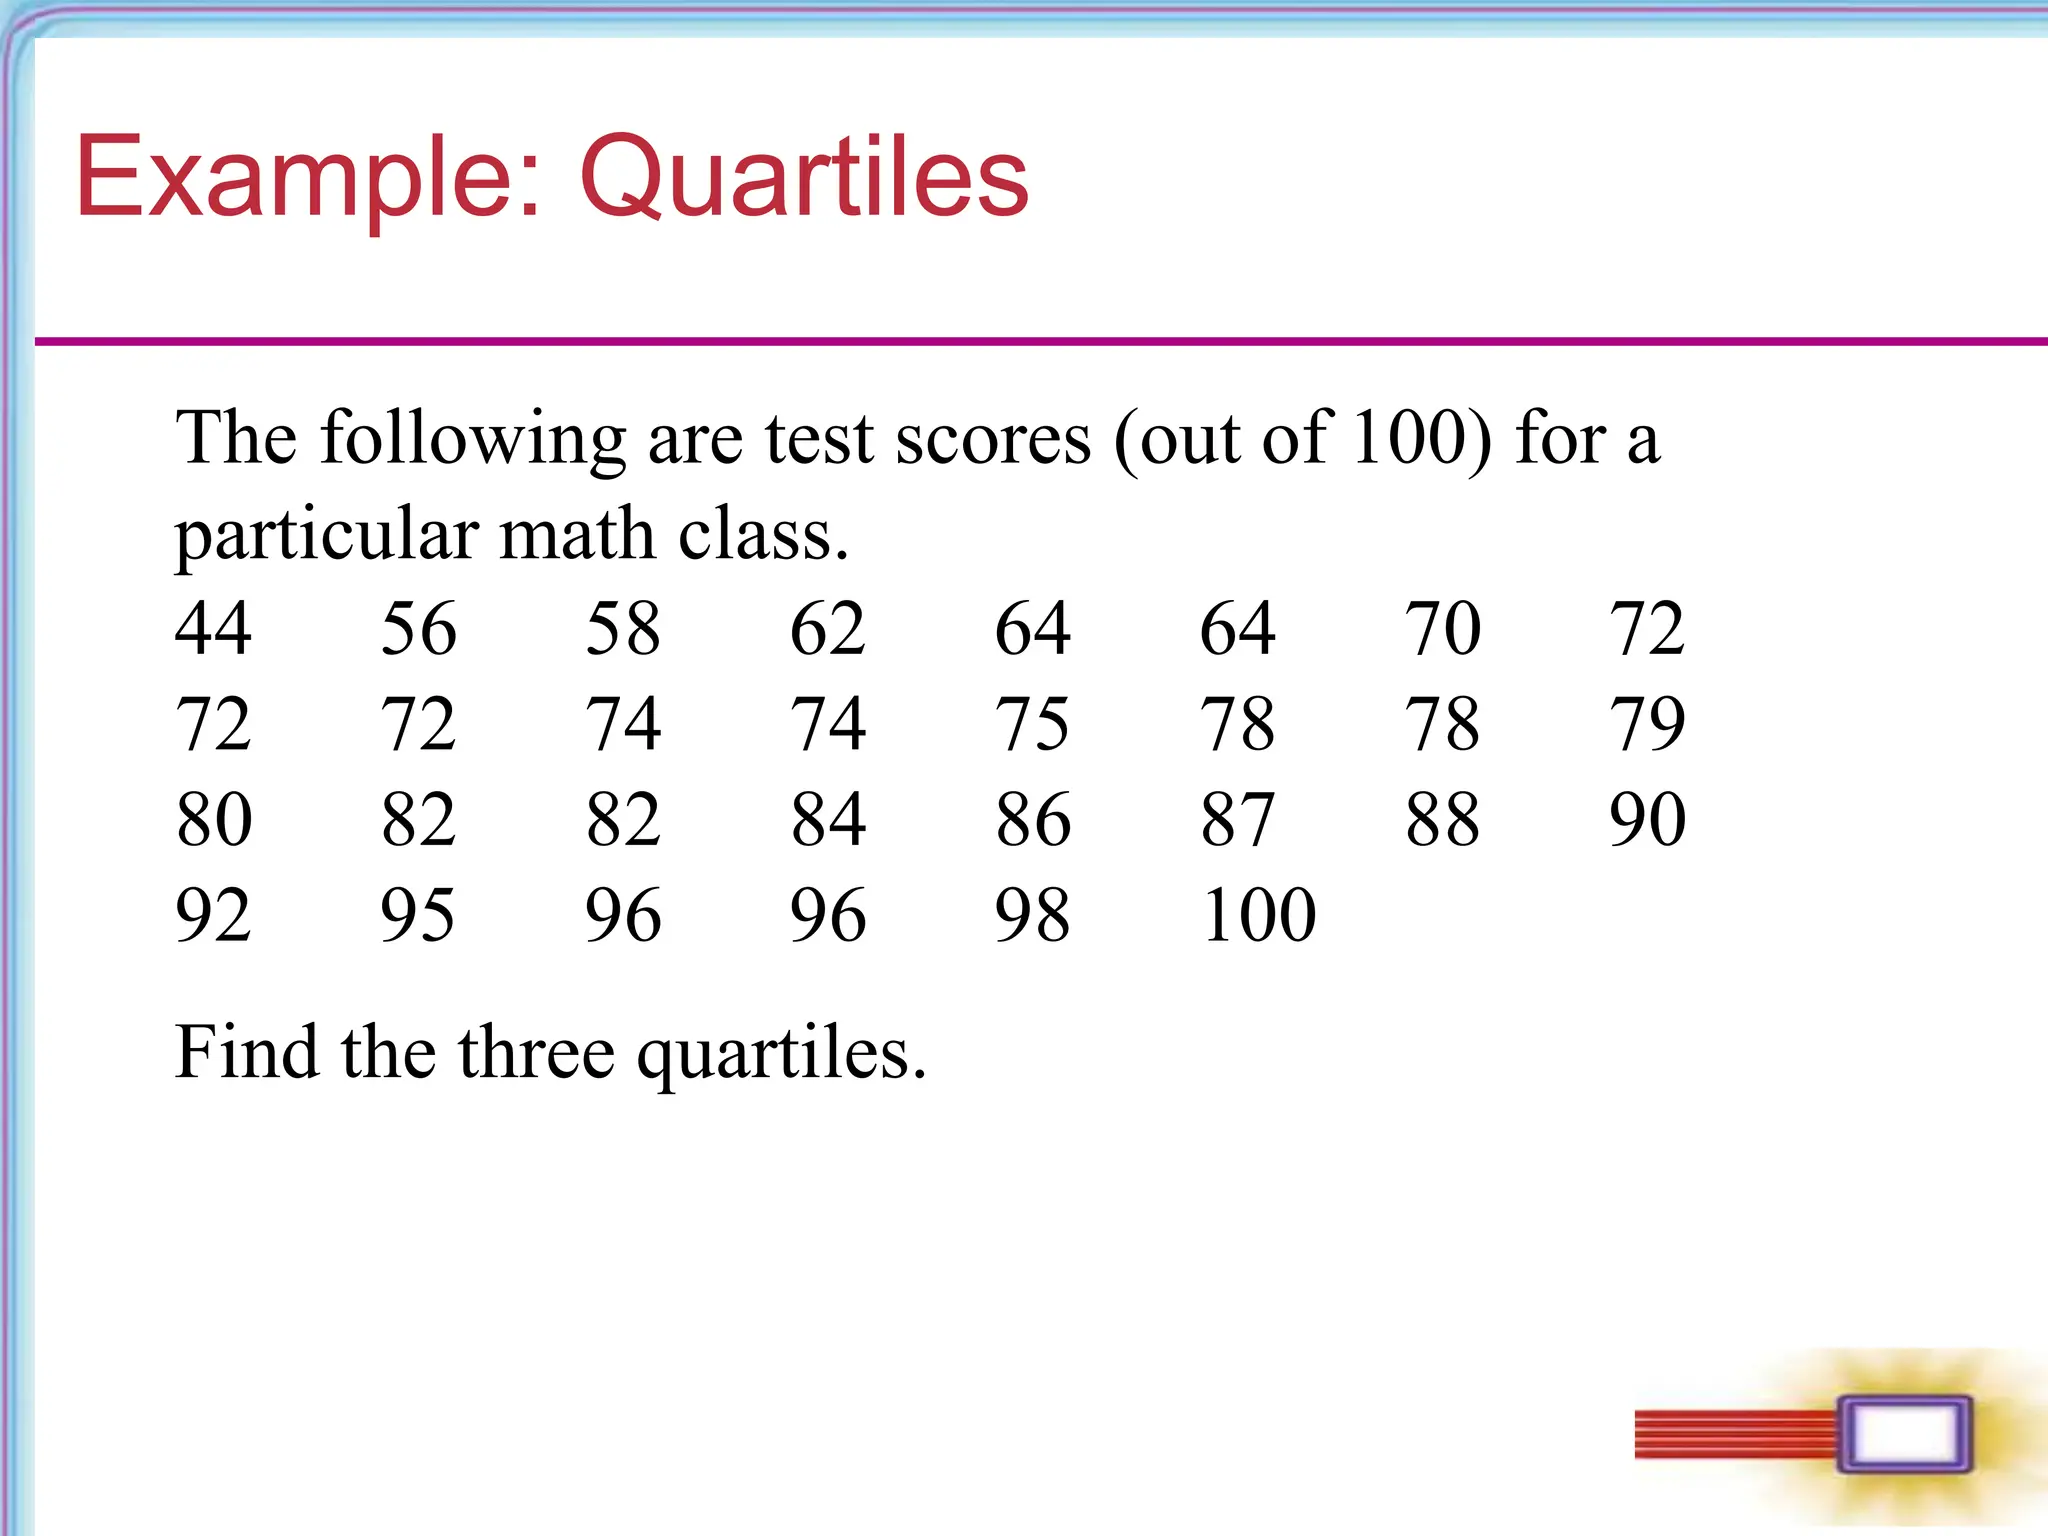
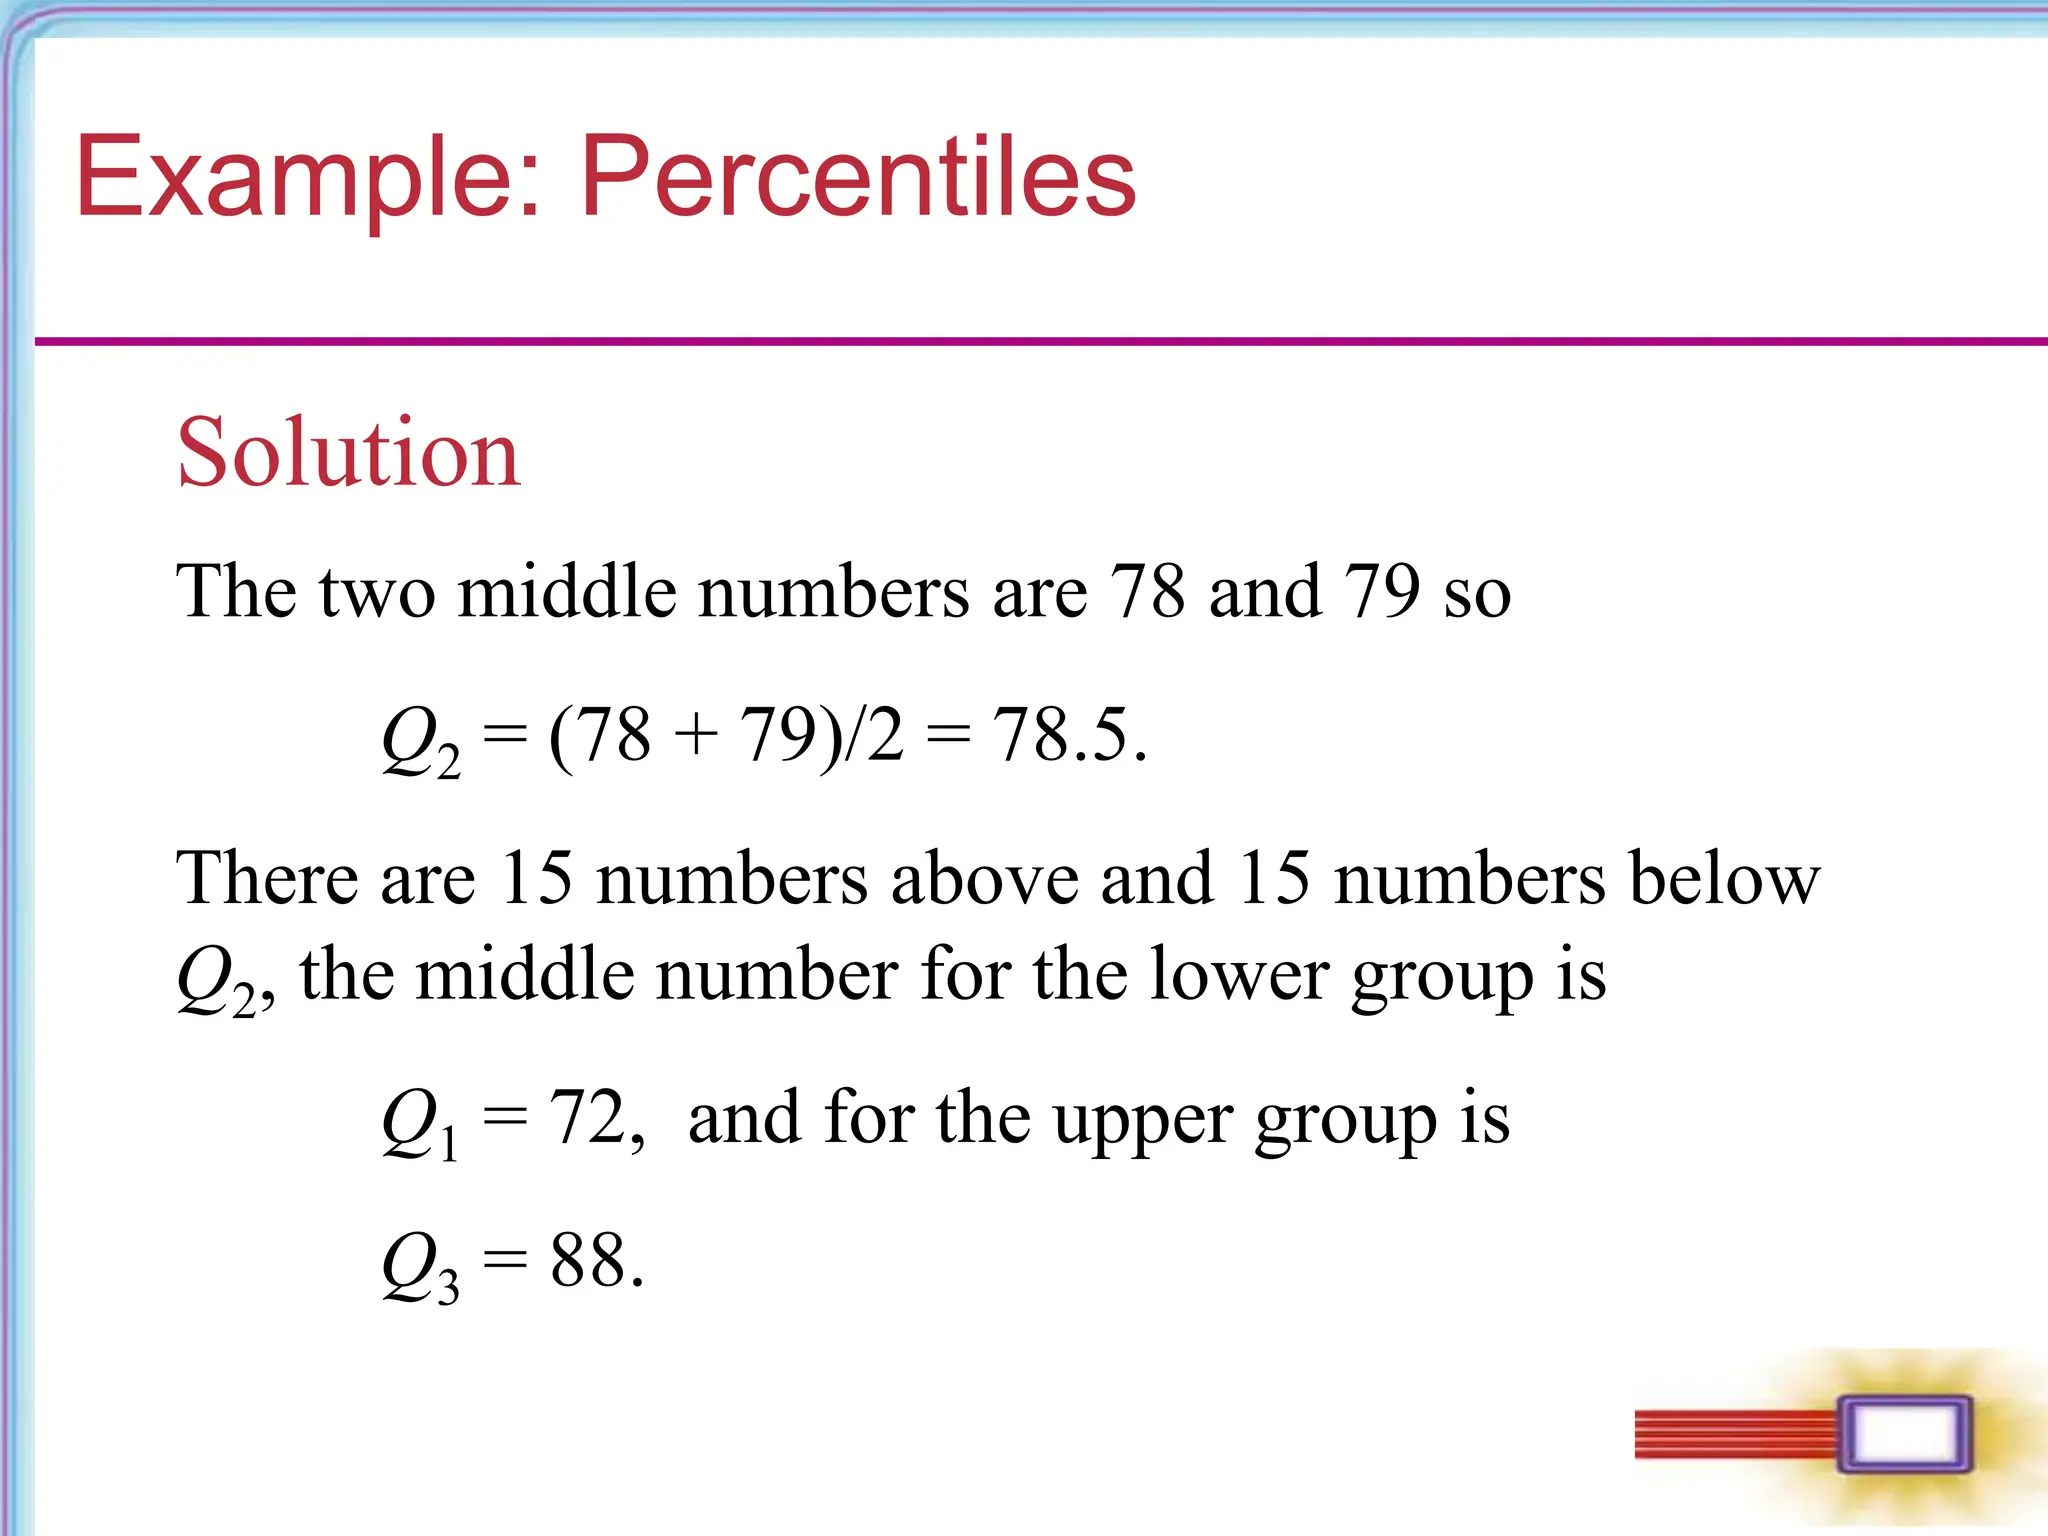
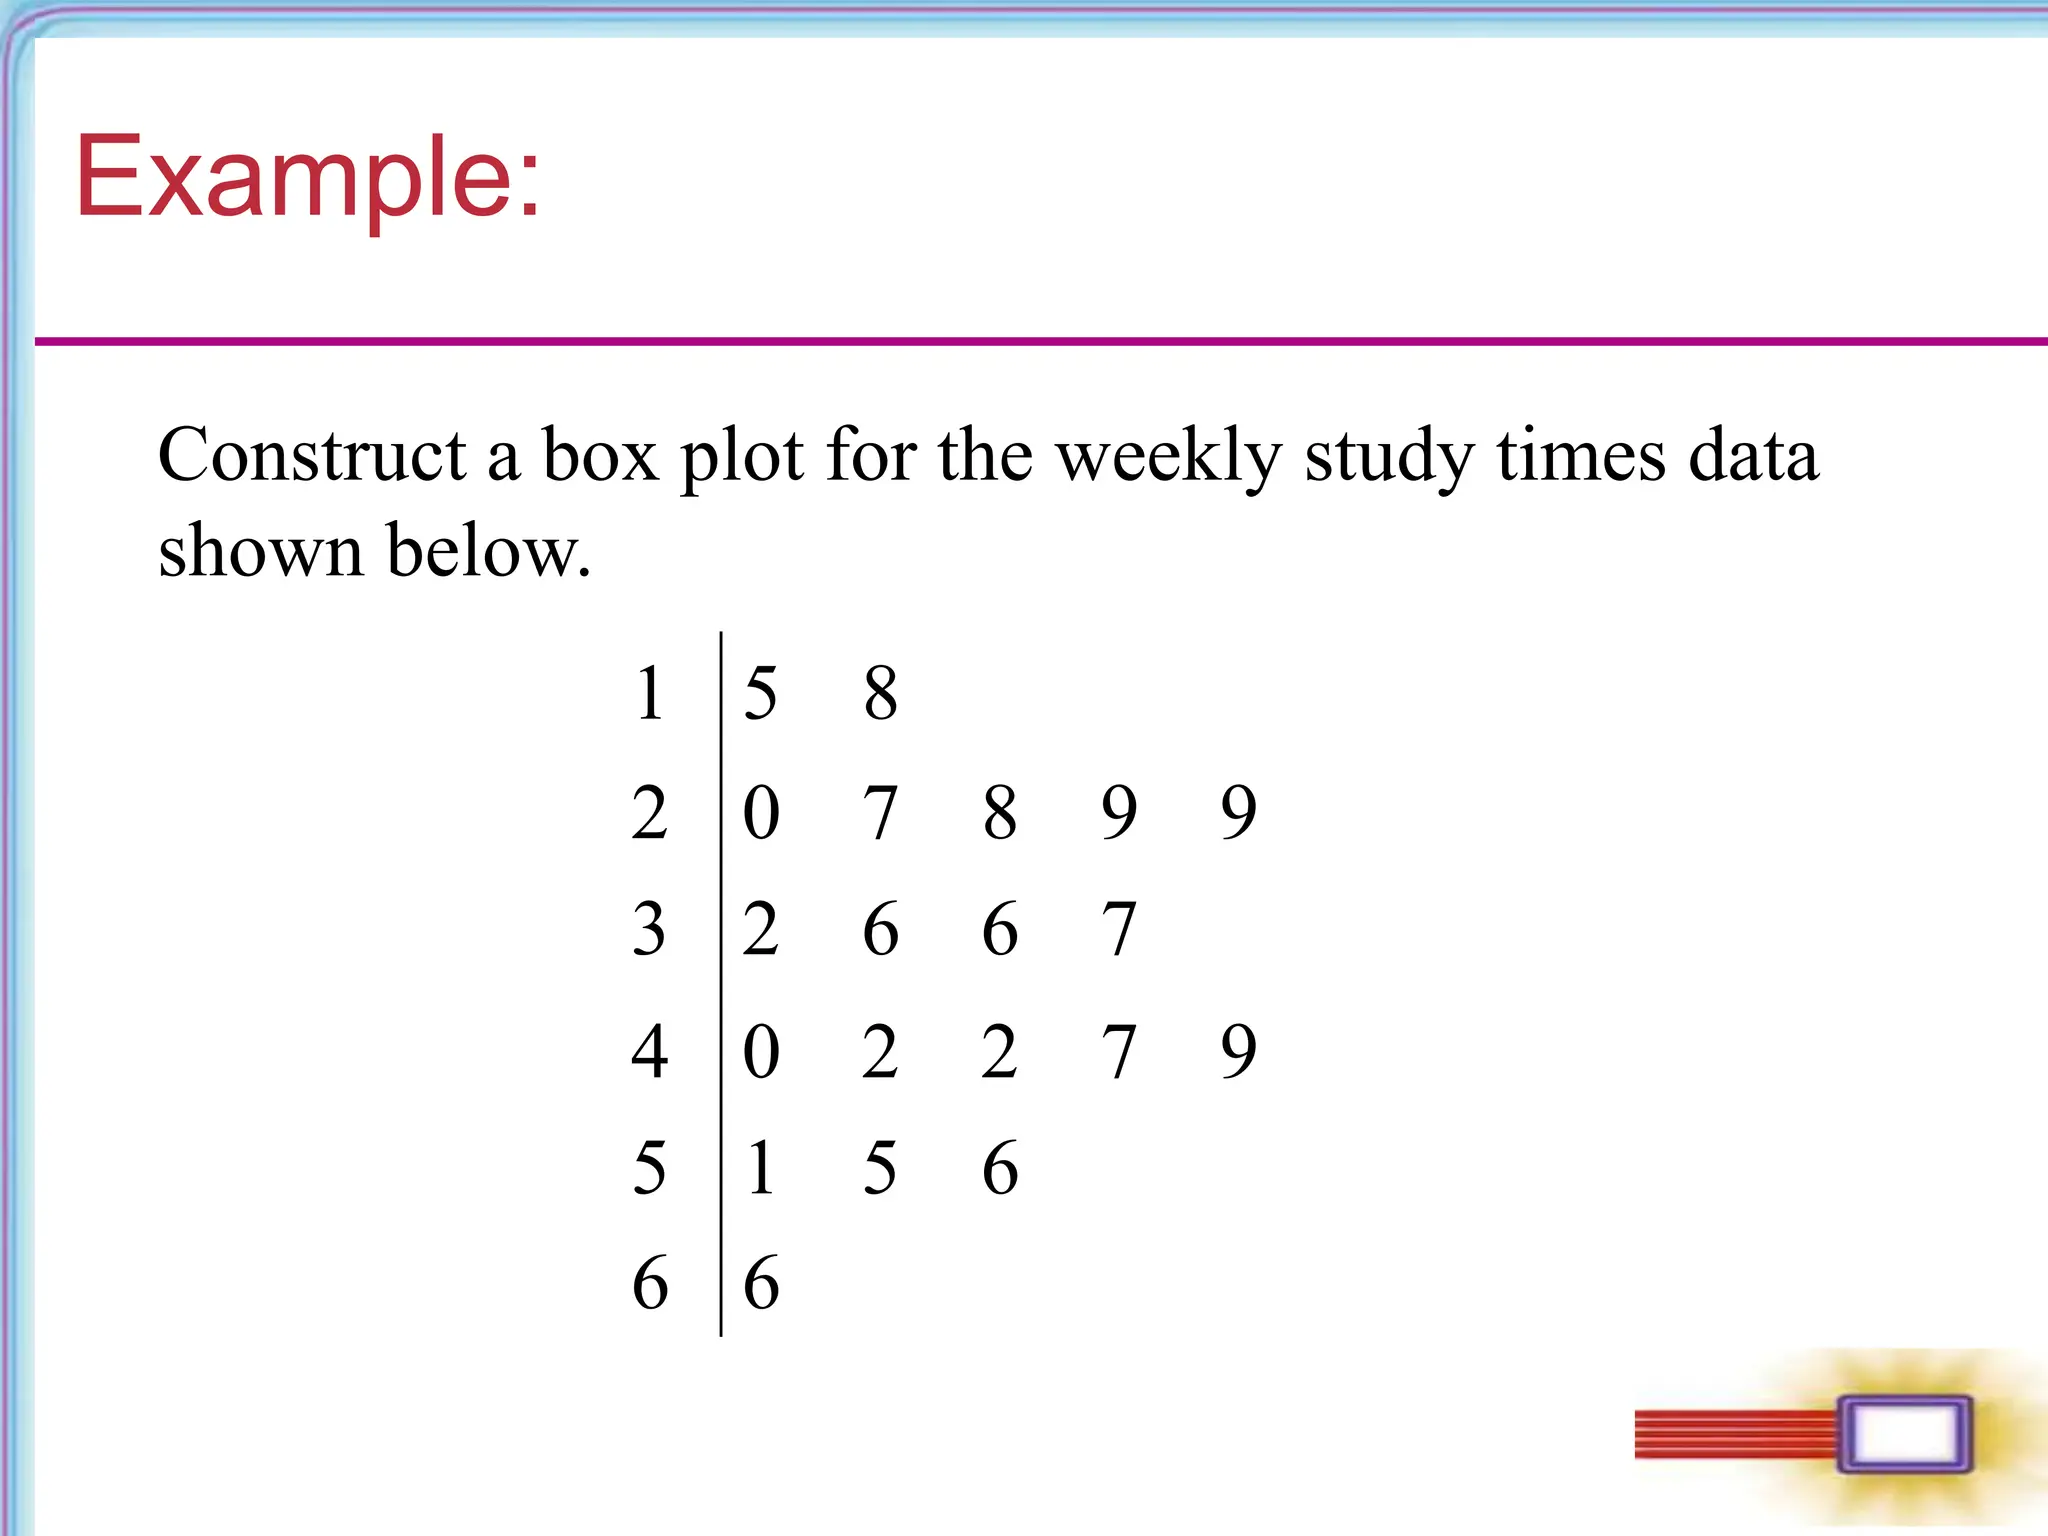
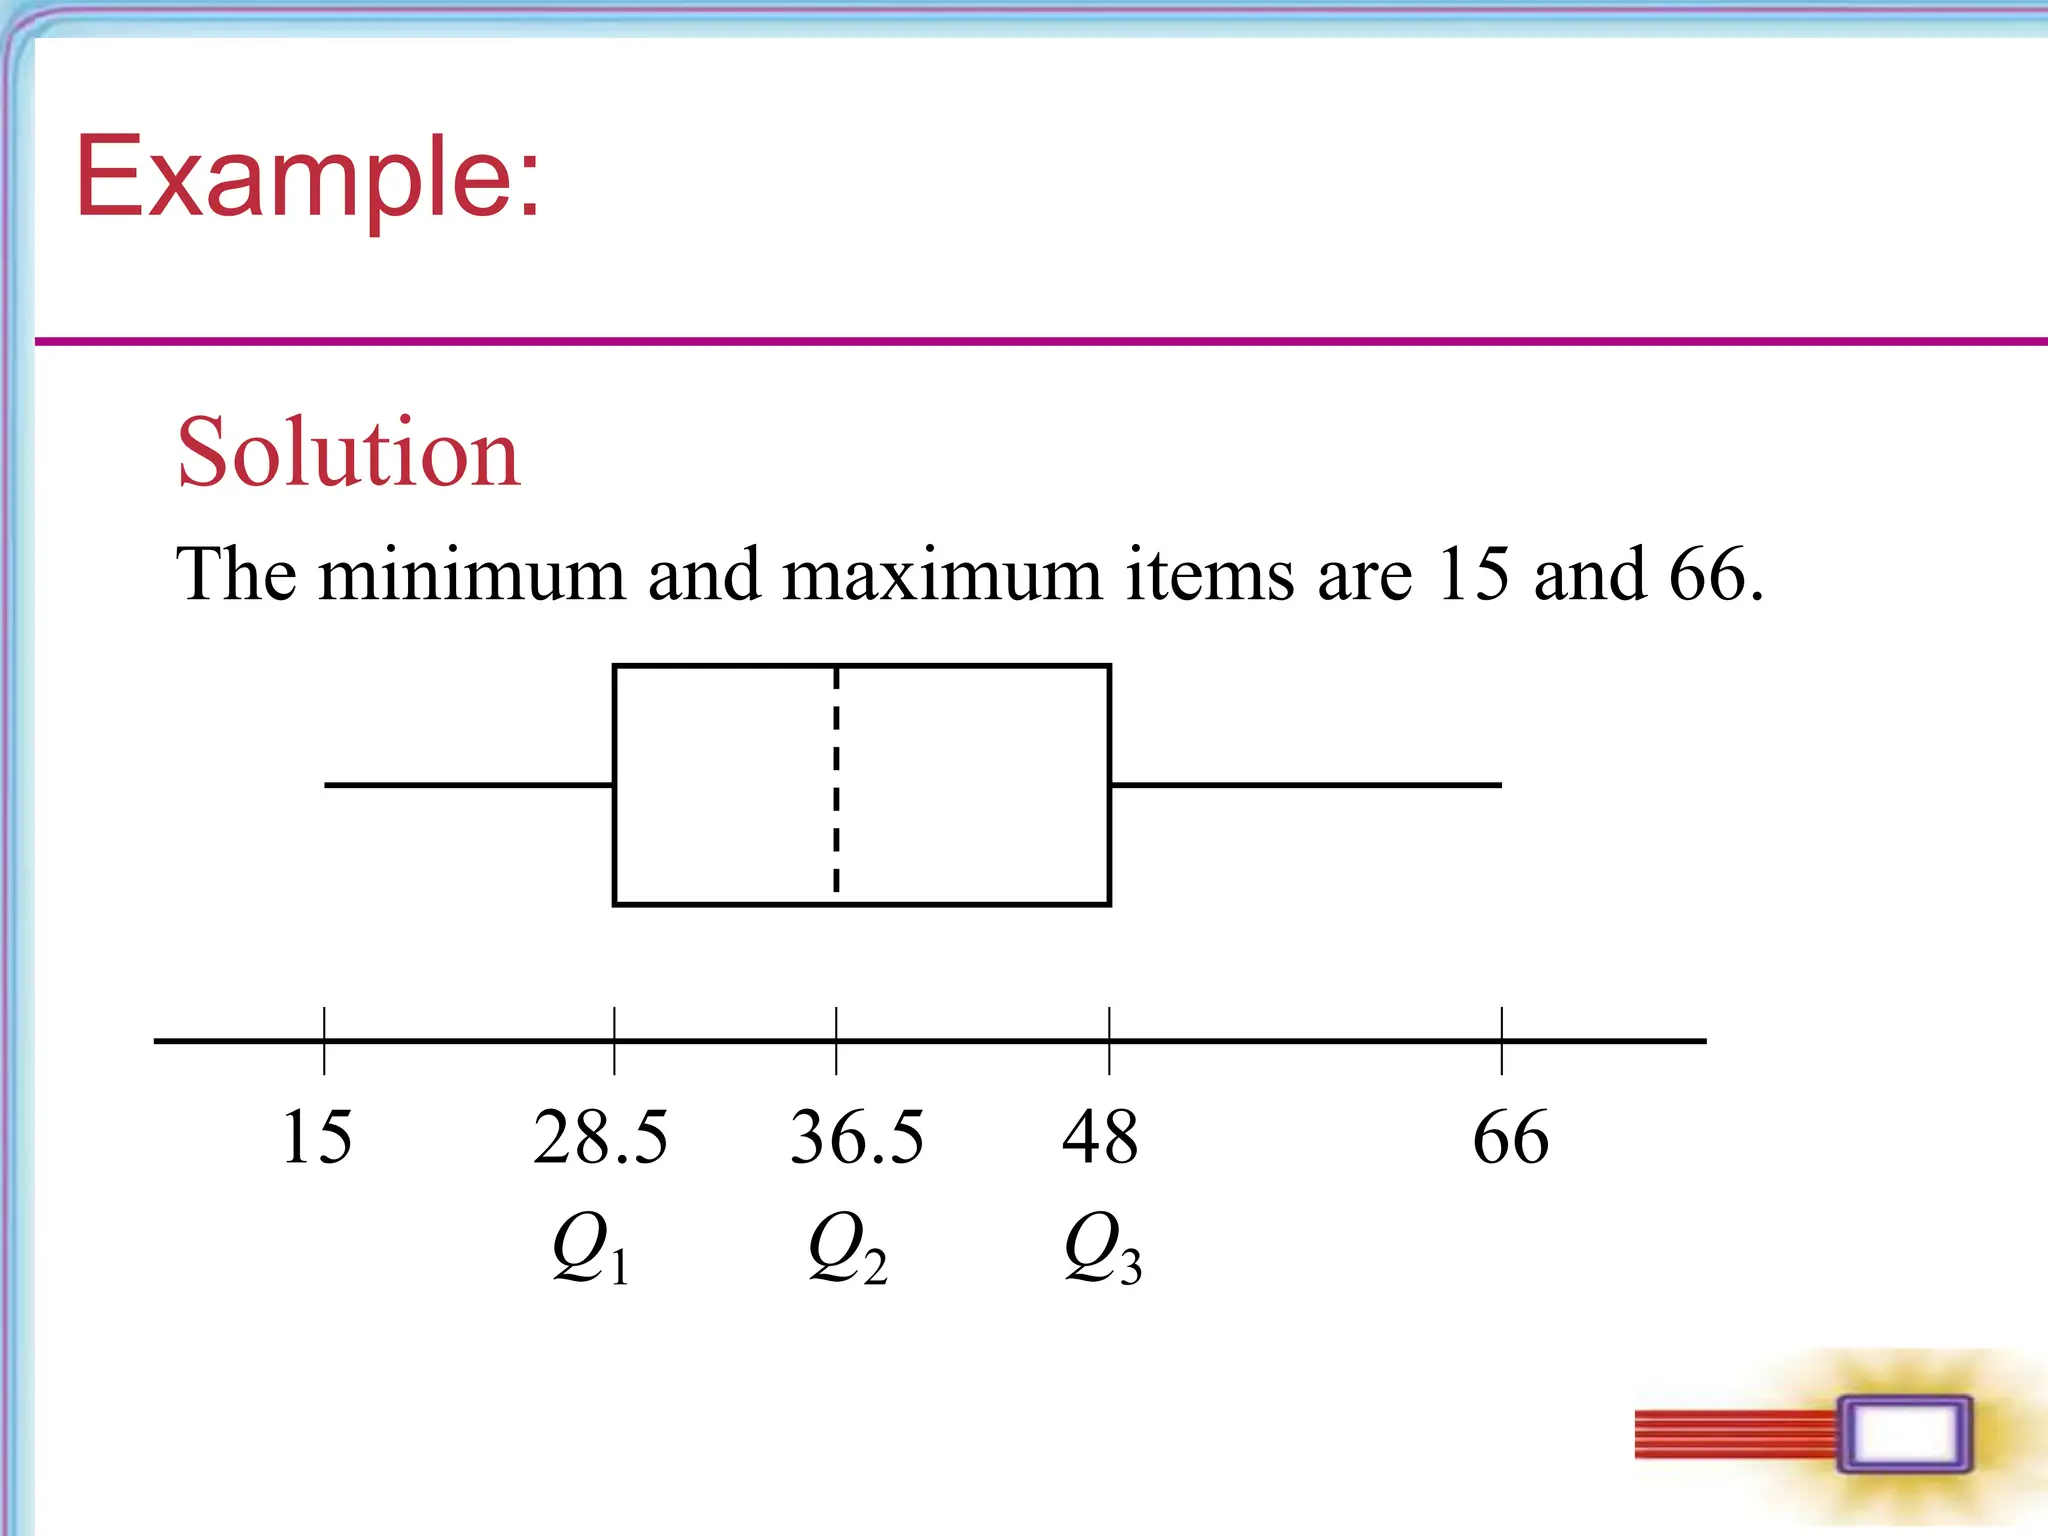
Chapter 13
Statistics
© 2008 Pearson Addison-Wesley.
All rights reserved
Chapter 13: Statistics
13.1 Visual Displays of Data
13.2 Measures of Central Tendency
13.3 Measures of Dispersion
13.4 Measures of Position
13.5 The Normal Distribution
13.6 Regression and Correlation
Chapter 1
Section 13-4
Measures of Position
• The z-Score
• Percentiles
• Deciles and Quartiles
• The Box Plot
Measures of Position
In some cases we are interested in certain individual
items in the data set, rather than in the set as a whole.
We need a way of measuring how an item fits into the
collection, how it compares to other items in the
collection, or even how it compares to another item
in another collection. There are several common
ways of creating such measures and they are usually
called measures of position.
The z-Score
If x is a data item in a sample with mean
and standard deviation s, then the z-score
of x is given by
x
.
x x
z
s


Example: Comparing with z-Scores
Two students, who take different history classes,
had exams on the same day. Jen’s score was 83
while Joy’s score was 78. Which student did
relatively better, given the class data shown below?
Jen Joy
Class mean 78 70
Class standard deviation 4 5
Example: Comparing with z-Scores
Solution
Calculate the z-scores:
83 78
Jen: 1.25
4
z

 
78 70
Joy: 1.6
5
z

 
Since Joy’s z-score is higher, she was positioned
relatively higher within her class than Jen was
within her class.
Percentiles
When you take a standardized test taken by
larger numbers of students, your raw score
is usually converted to a percentile score,
which is defined on the next slide.
Percentiles
If approximately n percent of the items in a
distribution are less than the number x, then x
is the nth percentile of the distribution,
denoted Pn.
Example: Percentiles
The following are test scores (out of 100) for a
particular math class.
44 56 58 62 64 64 70 72
72 72 74 74 75 78 78 79
80 82 82 84 86 87 88 90
92 95 96 96 98 100
Find the fortieth percentile.
Example: Percentiles
Solution
The 40th percentile can be taken as the item below
which 40 percent of the items are ranked. Since 40
percent of 30 is (.40)(30) = 12, we take the
thirteenth item, or 75, as the fortieth percentile.
Deciles and Quartiles
Deciles are the nine values (denoted D1,
D2,…, D9) along the scale that divide a data
set into ten (approximately) equal parts, and
quartiles are the three values (Q1, Q2, Q3)
that divide the data set into four
(approximately) equal parts.
Example: Deciles
The following are test scores (out of 100) for a
particular math class.
44 56 58 62 64 64 70 72
72 72 74 74 75 78 78 79
80 82 82 84 86 87 88 90
92 95 96 96 98 100
Find the sixth decile.
Example: Percentiles
Solution
The sixth decile is the 60th percentile. Since 60
percent of 30 is (.60)(30) = 18, we take the
nineteenth item, or 82, as the sixth decile.
Finding Quartiles
For any set of data (ranked in order from least
to greatest):
The second quartile, Q2, is just the median.
The first quartile, Q1, is the median of all
items below Q2.
The third quartile, Q3, is the median of all
items above Q2.
Example: Quartiles
The following are test scores (out of 100) for a
particular math class.
44 56 58 62 64 64 70 72
72 72 74 74 75 78 78 79
80 82 82 84 86 87 88 90
92 95 96 96 98 100
Find the three quartiles.
Example: Percentiles
Solution
The two middle numbers are 78 and 79 so
Q2 = (78 + 79)/2 = 78.5.
There are 15 numbers above and 15 numbers below
Q2, the middle number for the lower group is
Q1 = 72, and for the upper group is
Q3 = 88.
The Box Plot
A box plot, or box-and-whisker plot,
involves the median (a measure of central
tendency), the range (a measure of dispersion),
and the first and third quartiles (measures of
position), all incorporated into a simple visual
display.
The Box Plot
For a given set of data, a box plot (or box-
and-whisker plot) consists of a rectangular
box positioned above a numerical scale,
extending from Q1 to Q3, with the value of Q2
(the median) indicated within the box, and
with “whiskers” (line segments) extending to
the left and right from the box out to the
minimum and maximum data items.
Example:
1 5 8
2 0 7 8 9 9
3 2 6 6 7
4 0 2 2 7 9
5
6
1 5 6
6
Construct a box plot for the weekly study times data
shown below.
Example:
The minimum and maximum items are 15 and 66.
36.5 48
28.5 66
15
Solution
Q1 Q2 Q3

mmi11_ppt_1304.pptnnnnnnnnnnnnnnnnnnnnnn

  • 1.
    Chapter 13 Statistics © 2008Pearson Addison-Wesley. All rights reserved
  • 2.
    Chapter 13: Statistics 13.1Visual Displays of Data 13.2 Measures of Central Tendency 13.3 Measures of Dispersion 13.4 Measures of Position 13.5 The Normal Distribution 13.6 Regression and Correlation
  • 3.
  • 4.
    Measures of Position •The z-Score • Percentiles • Deciles and Quartiles • The Box Plot
  • 5.
    Measures of Position Insome cases we are interested in certain individual items in the data set, rather than in the set as a whole. We need a way of measuring how an item fits into the collection, how it compares to other items in the collection, or even how it compares to another item in another collection. There are several common ways of creating such measures and they are usually called measures of position.
  • 6.
    The z-Score If xis a data item in a sample with mean and standard deviation s, then the z-score of x is given by x . x x z s  
  • 7.
    Example: Comparing withz-Scores Two students, who take different history classes, had exams on the same day. Jen’s score was 83 while Joy’s score was 78. Which student did relatively better, given the class data shown below? Jen Joy Class mean 78 70 Class standard deviation 4 5
  • 8.
    Example: Comparing withz-Scores Solution Calculate the z-scores: 83 78 Jen: 1.25 4 z    78 70 Joy: 1.6 5 z    Since Joy’s z-score is higher, she was positioned relatively higher within her class than Jen was within her class.
  • 9.
    Percentiles When you takea standardized test taken by larger numbers of students, your raw score is usually converted to a percentile score, which is defined on the next slide.
  • 10.
    Percentiles If approximately npercent of the items in a distribution are less than the number x, then x is the nth percentile of the distribution, denoted Pn.
  • 11.
    Example: Percentiles The followingare test scores (out of 100) for a particular math class. 44 56 58 62 64 64 70 72 72 72 74 74 75 78 78 79 80 82 82 84 86 87 88 90 92 95 96 96 98 100 Find the fortieth percentile.
  • 12.
    Example: Percentiles Solution The 40thpercentile can be taken as the item below which 40 percent of the items are ranked. Since 40 percent of 30 is (.40)(30) = 12, we take the thirteenth item, or 75, as the fortieth percentile.
  • 13.
    Deciles and Quartiles Decilesare the nine values (denoted D1, D2,…, D9) along the scale that divide a data set into ten (approximately) equal parts, and quartiles are the three values (Q1, Q2, Q3) that divide the data set into four (approximately) equal parts.
  • 14.
    Example: Deciles The followingare test scores (out of 100) for a particular math class. 44 56 58 62 64 64 70 72 72 72 74 74 75 78 78 79 80 82 82 84 86 87 88 90 92 95 96 96 98 100 Find the sixth decile.
  • 15.
    Example: Percentiles Solution The sixthdecile is the 60th percentile. Since 60 percent of 30 is (.60)(30) = 18, we take the nineteenth item, or 82, as the sixth decile.
  • 16.
    Finding Quartiles For anyset of data (ranked in order from least to greatest): The second quartile, Q2, is just the median. The first quartile, Q1, is the median of all items below Q2. The third quartile, Q3, is the median of all items above Q2.
  • 17.
    Example: Quartiles The followingare test scores (out of 100) for a particular math class. 44 56 58 62 64 64 70 72 72 72 74 74 75 78 78 79 80 82 82 84 86 87 88 90 92 95 96 96 98 100 Find the three quartiles.
  • 18.
    Example: Percentiles Solution The twomiddle numbers are 78 and 79 so Q2 = (78 + 79)/2 = 78.5. There are 15 numbers above and 15 numbers below Q2, the middle number for the lower group is Q1 = 72, and for the upper group is Q3 = 88.
  • 19.
    The Box Plot Abox plot, or box-and-whisker plot, involves the median (a measure of central tendency), the range (a measure of dispersion), and the first and third quartiles (measures of position), all incorporated into a simple visual display.
  • 20.
    The Box Plot Fora given set of data, a box plot (or box- and-whisker plot) consists of a rectangular box positioned above a numerical scale, extending from Q1 to Q3, with the value of Q2 (the median) indicated within the box, and with “whiskers” (line segments) extending to the left and right from the box out to the minimum and maximum data items.
  • 21.
    Example: 1 5 8 20 7 8 9 9 3 2 6 6 7 4 0 2 2 7 9 5 6 1 5 6 6 Construct a box plot for the weekly study times data shown below.
  • 22.
    Example: The minimum andmaximum items are 15 and 66. 36.5 48 28.5 66 15 Solution Q1 Q2 Q3