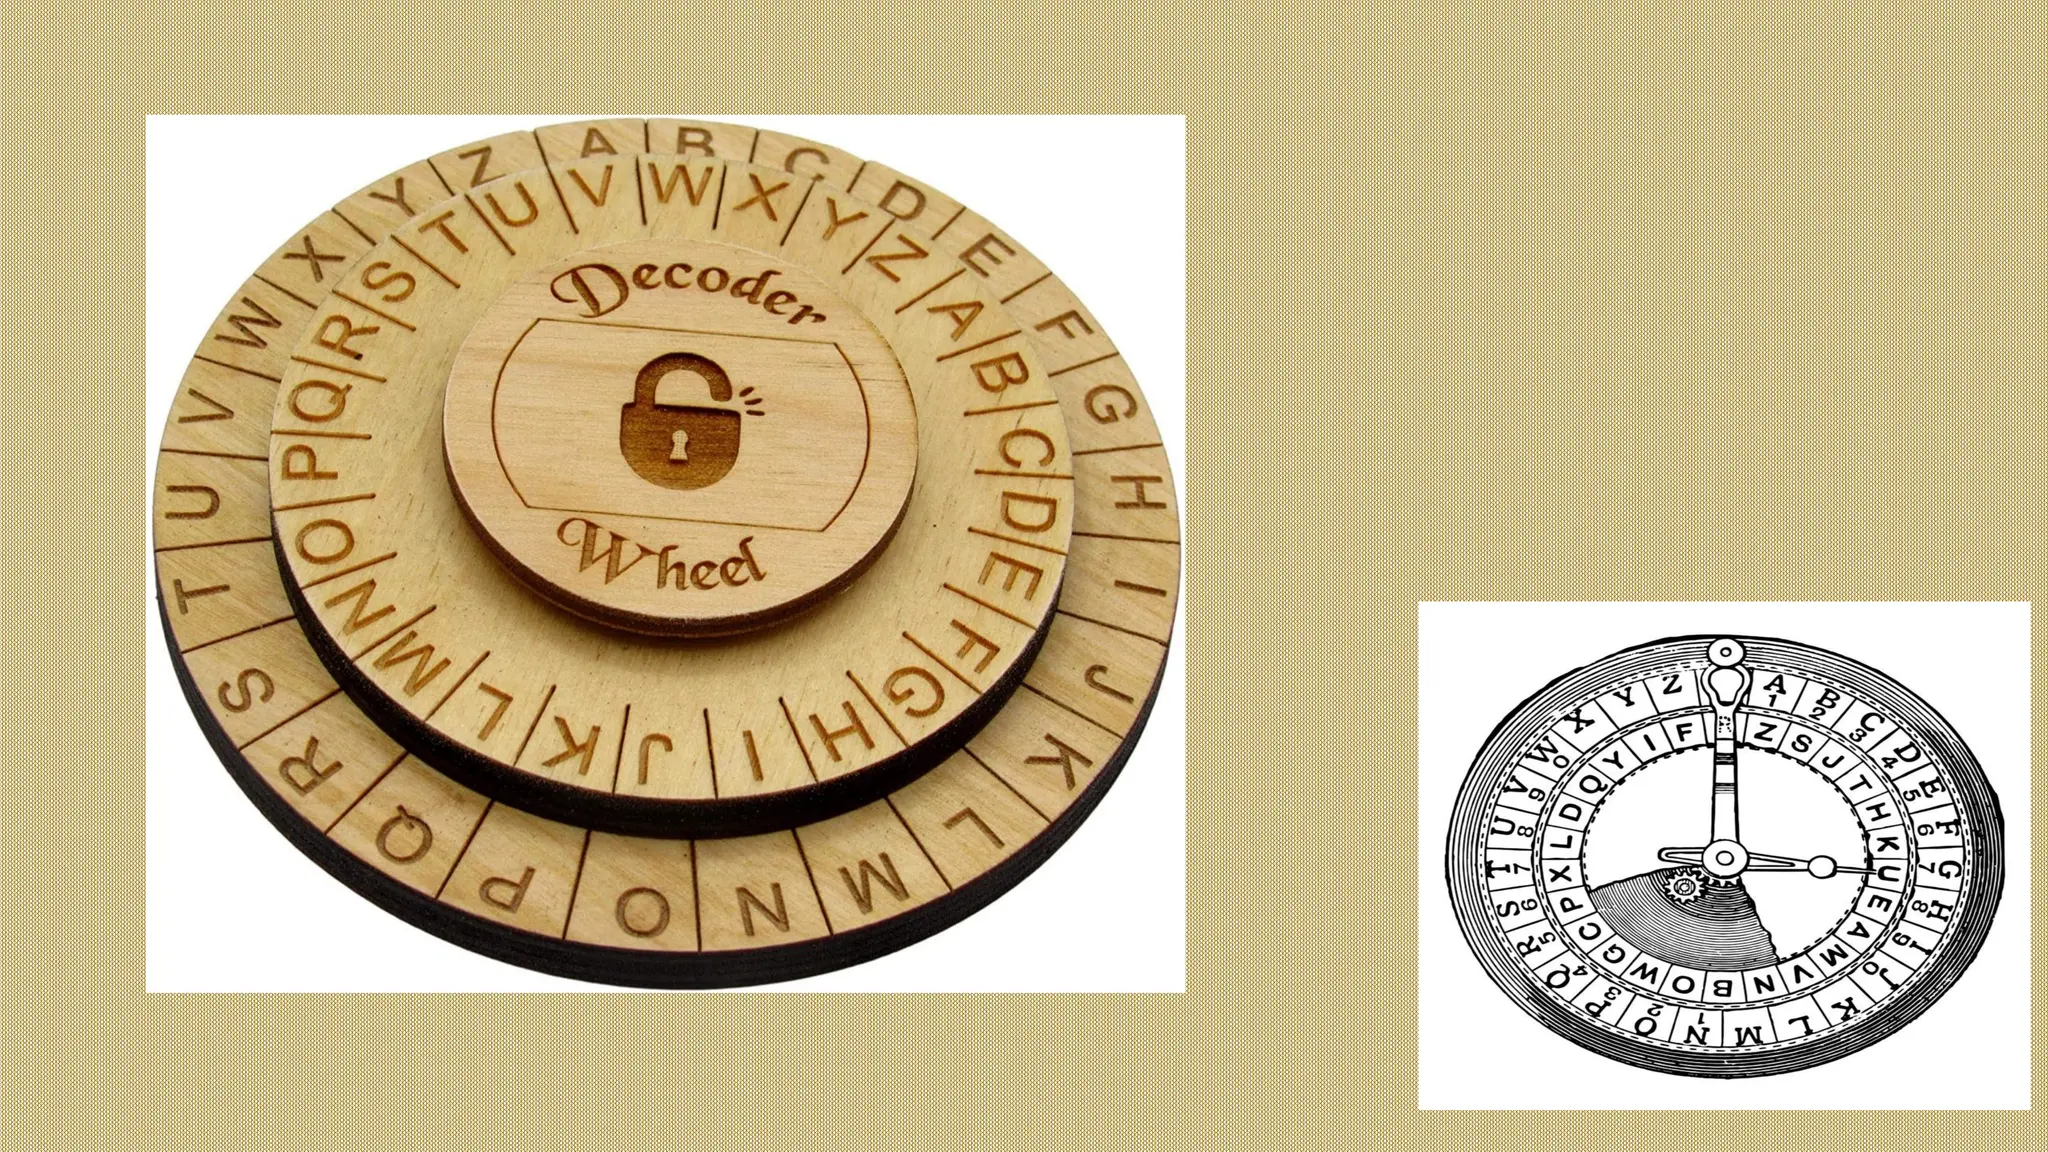
Q4_Week1_Measures of Position(ungrouped data).pptx
It discusses about the measures of positions for ungrouped data. It shows how to solve for quartiles, deciles and percentiles. It gives examples for each quantiles. Showing step-by-step procedures including the Linear Interpolation.
Q4_Week1_Measures of Position(ungrouped data).pptx
2.
THE PROBABILITY CIPHER
1.Probability of drawing a red card OR a face card from a standard
deck.
2. Probability that the sum of two dice is at least 10.
3. Mariel has 24 different colored balls in a jar. 8 of these balls are
green, 6 are orange, and 10 are violet. What is the probability that
Mariel draws a ball that is either green or not violet
4. Probability of flipping tails AND rolling an odd number on a six-
sided die.
5. A letter is randomly chosen from the word “MATHEMATICS”. Find
the probability that a letter A or T is selected.
3.
6.Probability that arandomly selected student from a group of 30
(where 12 play soccer, 15 play basketball, and 6 play both) plays at
least one sport.
7.Probability of spinning an even number OR a number greater than 5
on an 8-section spinner.
8.Probability of rolling two dice and getting a sum of AT LEAST 12.
9.Probability of drawing two green balls from a bag of 4 red, 6 blue,
and 10 green balls (without replacement).
10.Probability of drawing a queen or a heart from a standard deck of
52 cards.
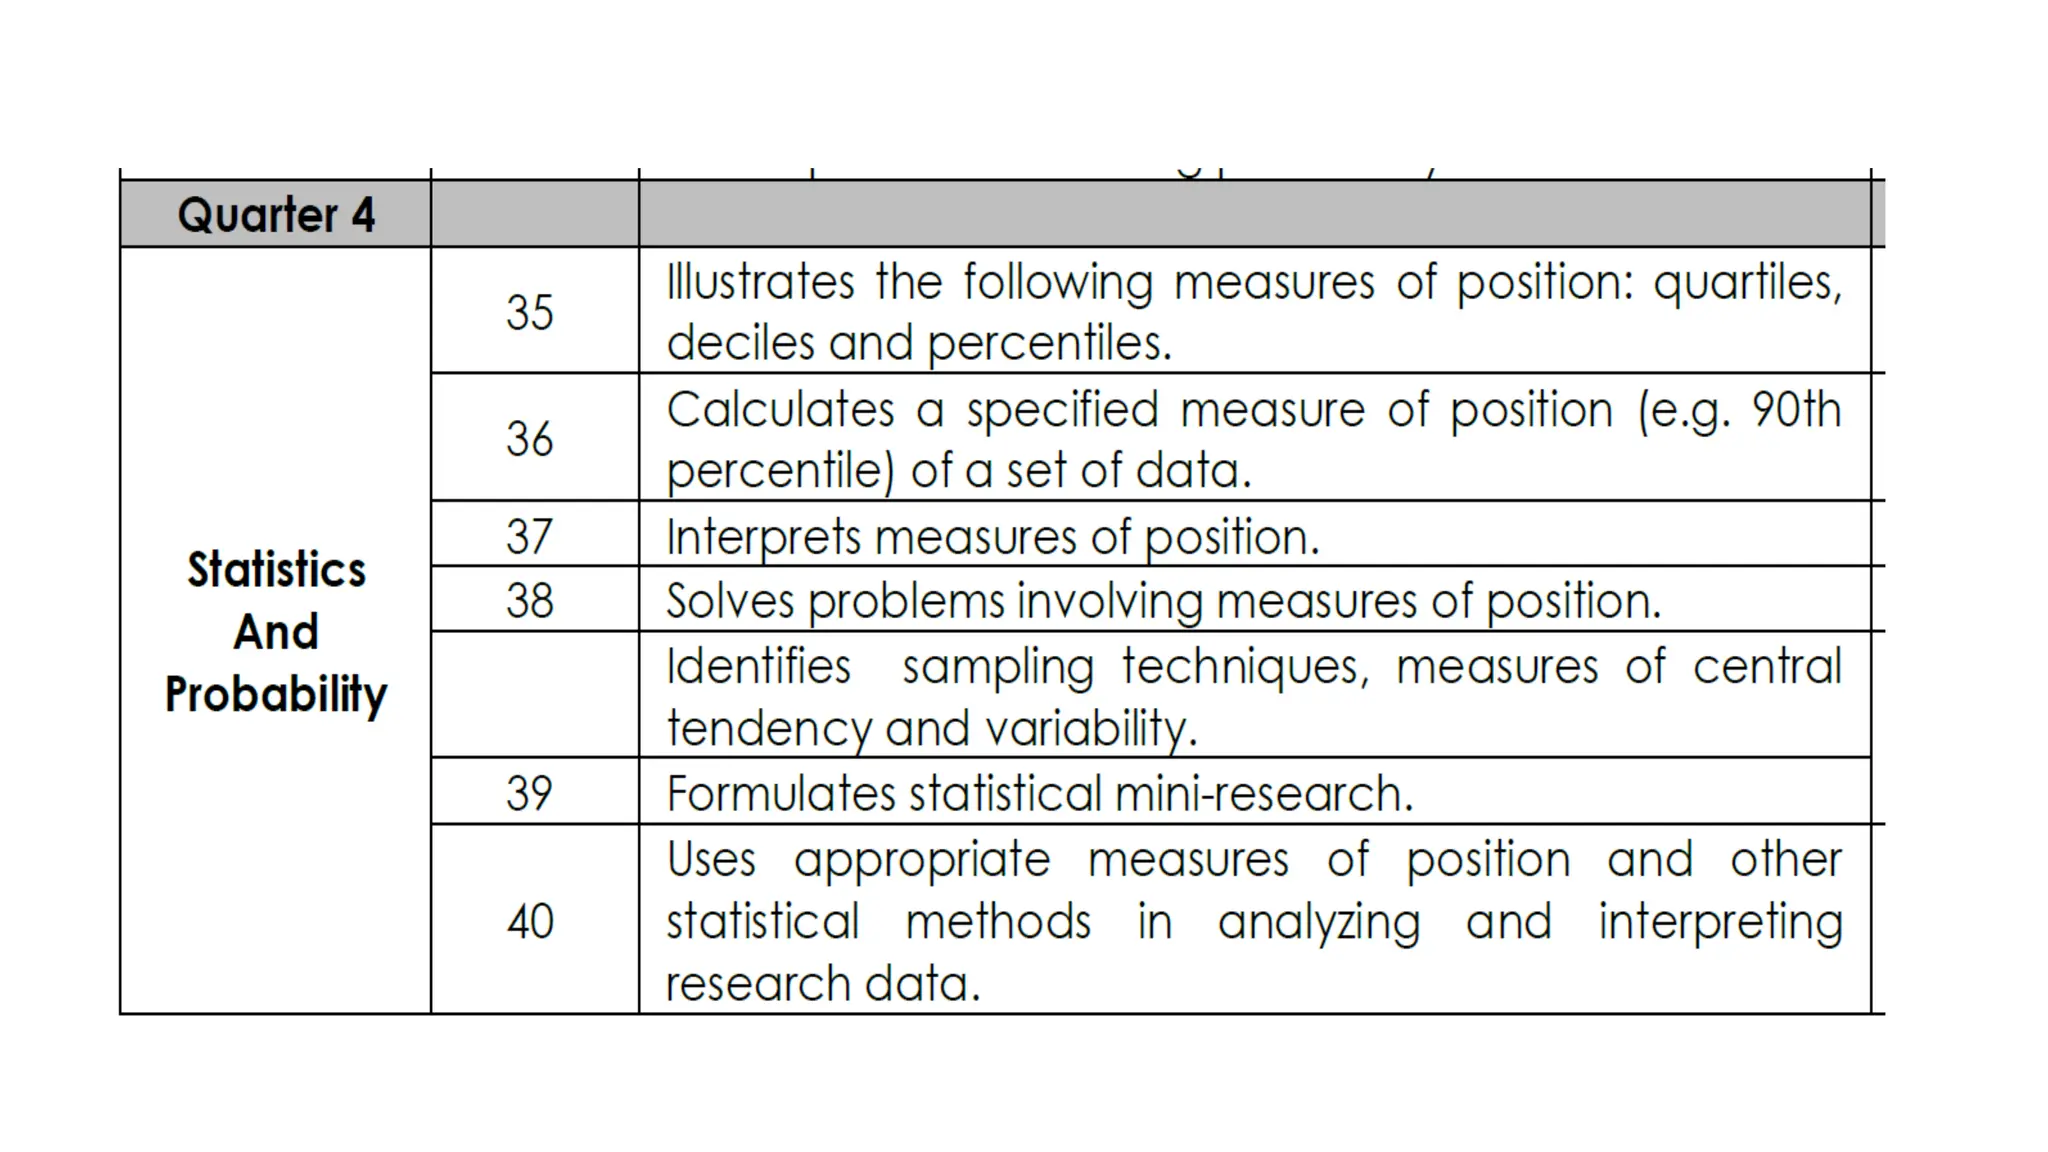
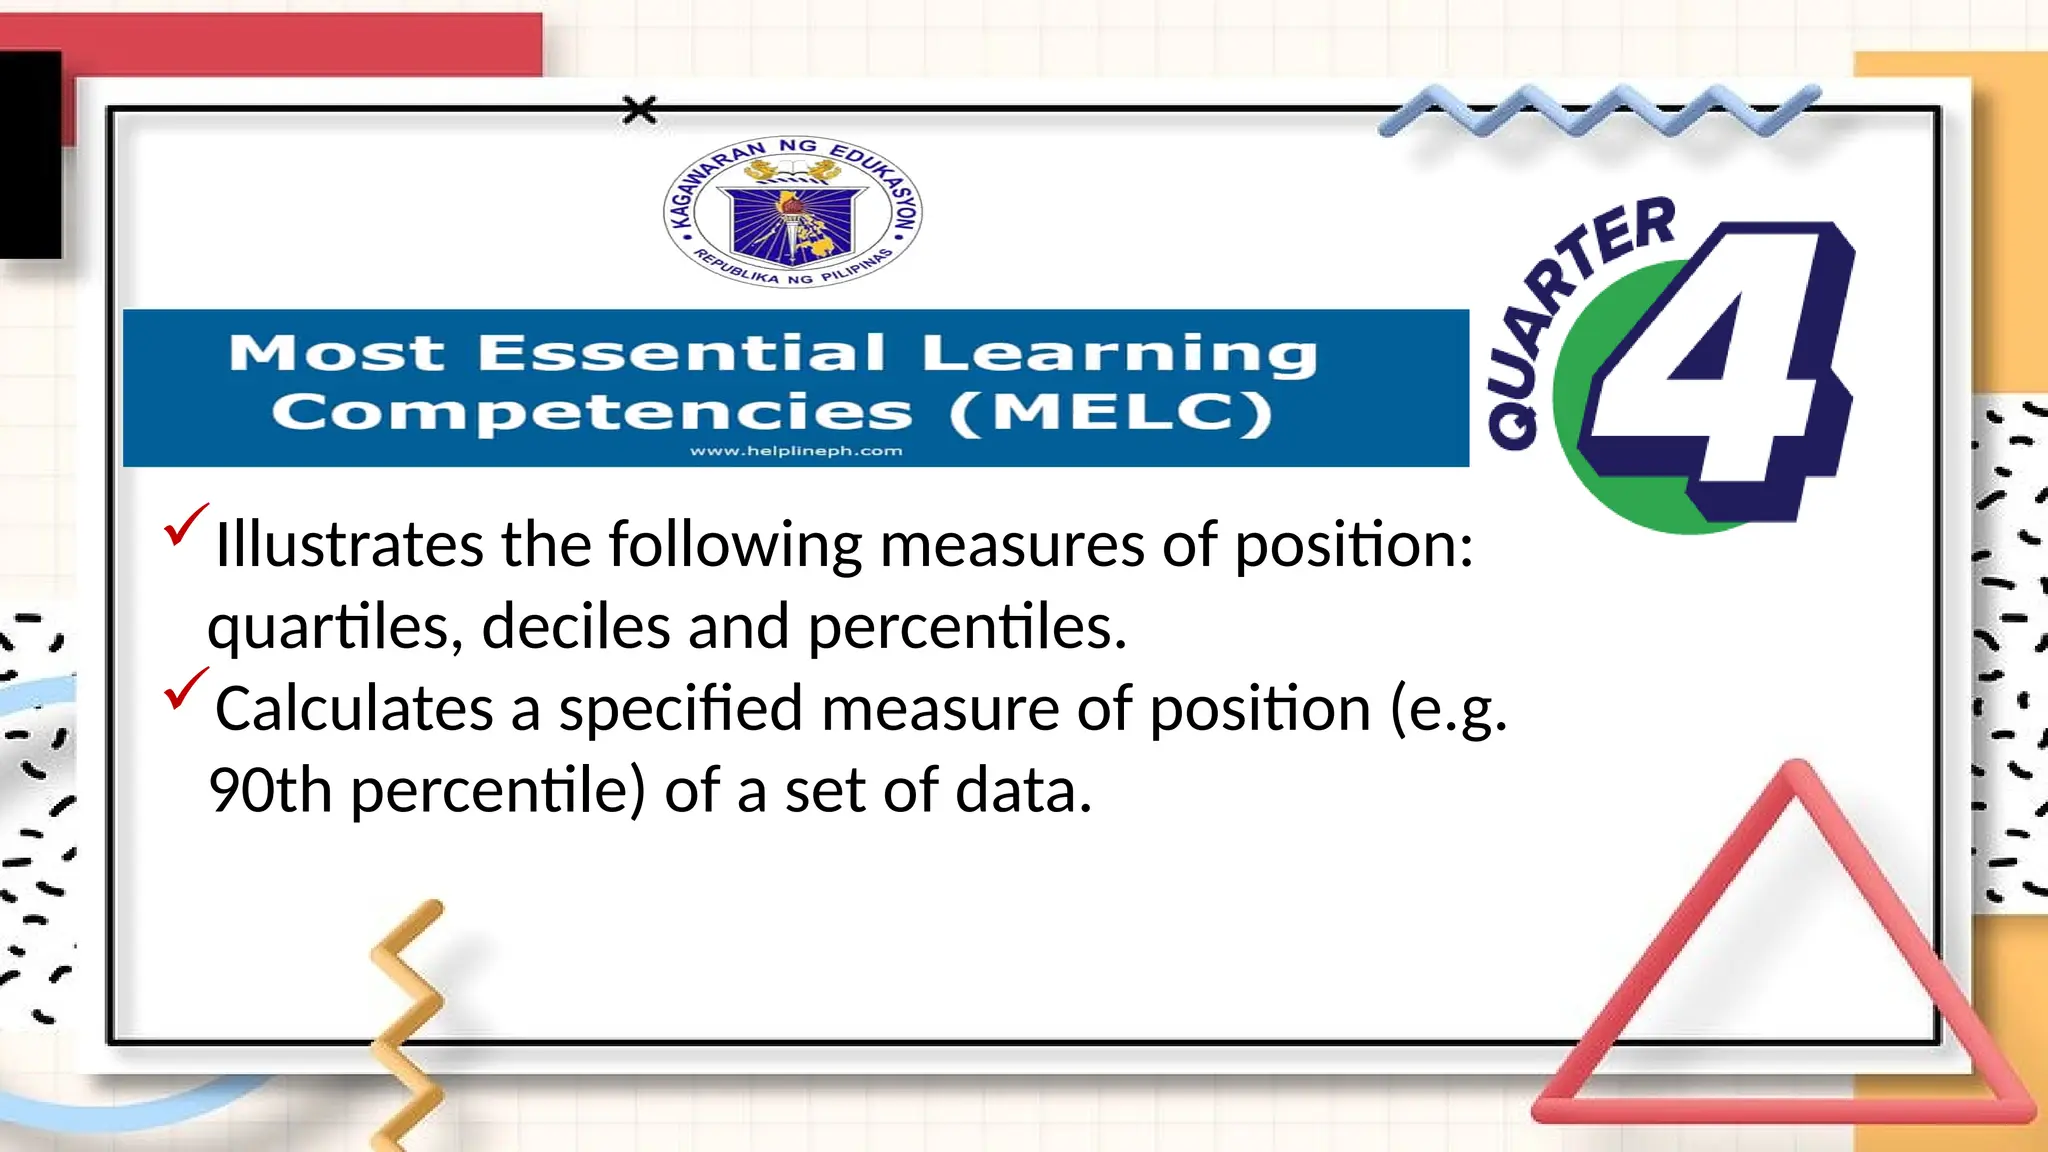
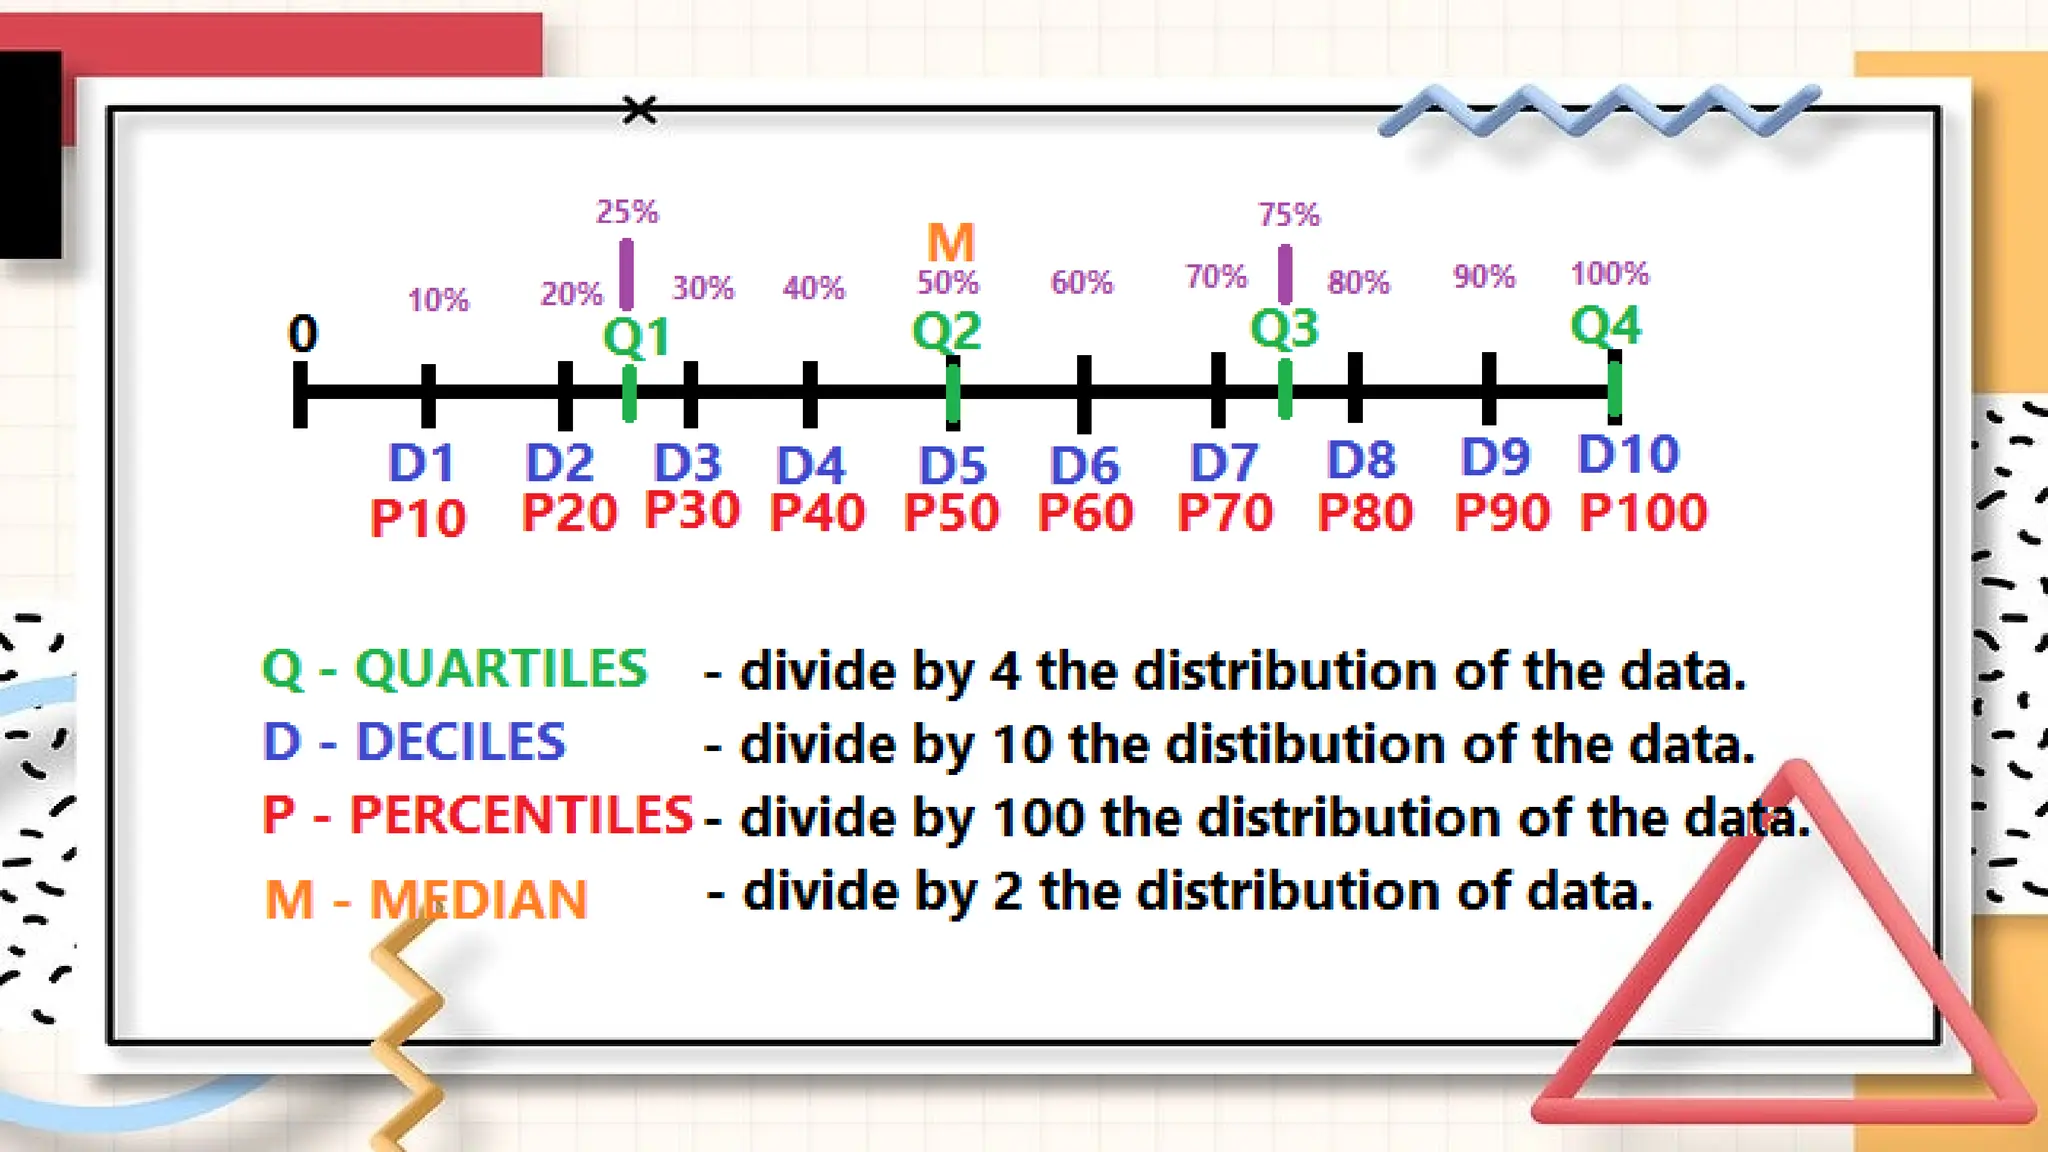
Illustrates the followingmeasures of position:
quartiles, deciles and percentiles.
Calculates a specified measure of position (e.g.
90th percentile) of a set of data.
12.
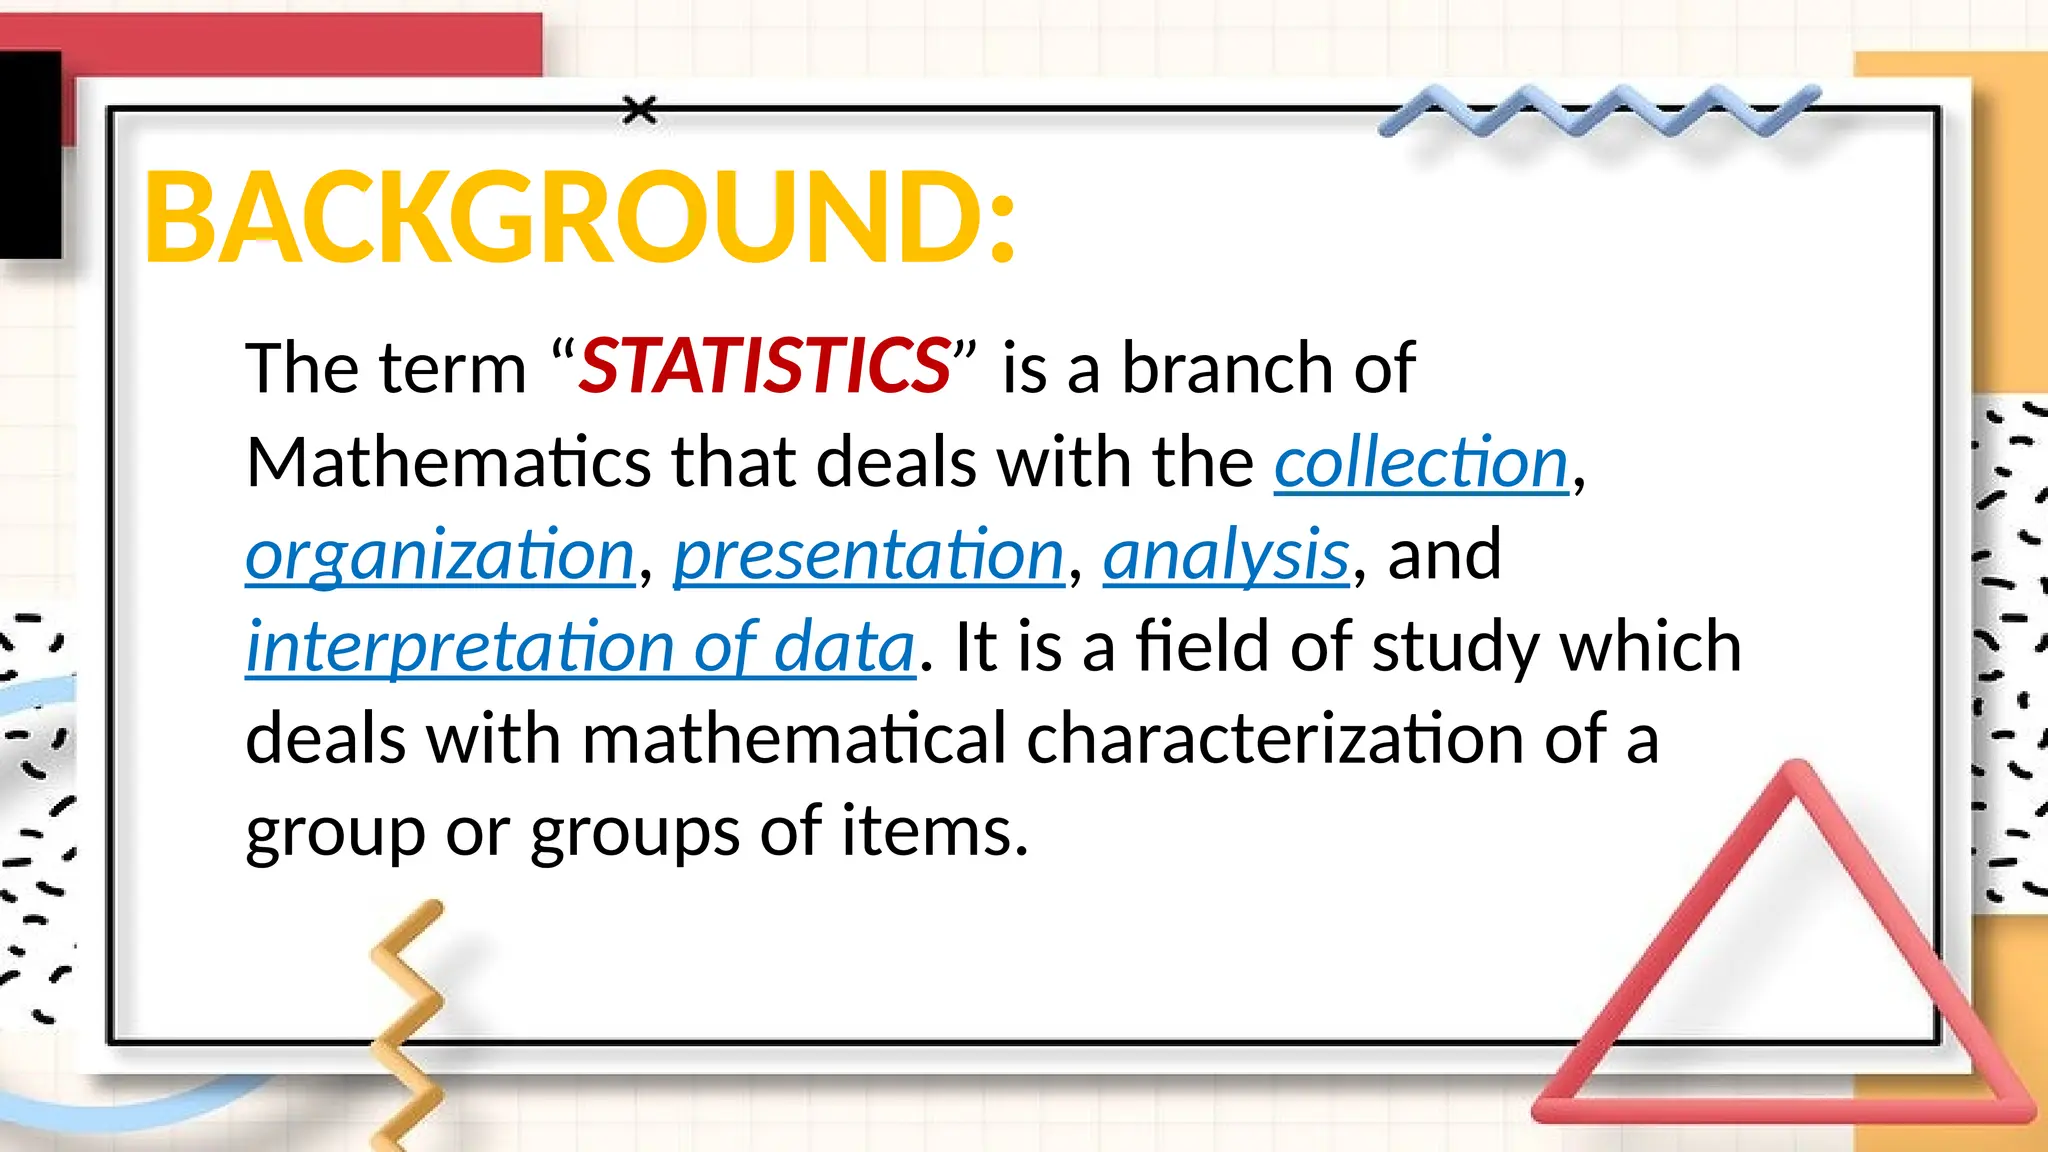
BACKGROUND:
The term “STATISTICS”is a branch of
Mathematics that deals with the collection,
organization, presentation, analysis, and
interpretation of data. It is a field of study which
deals with mathematical characterization of a
group or groups of items.
13.
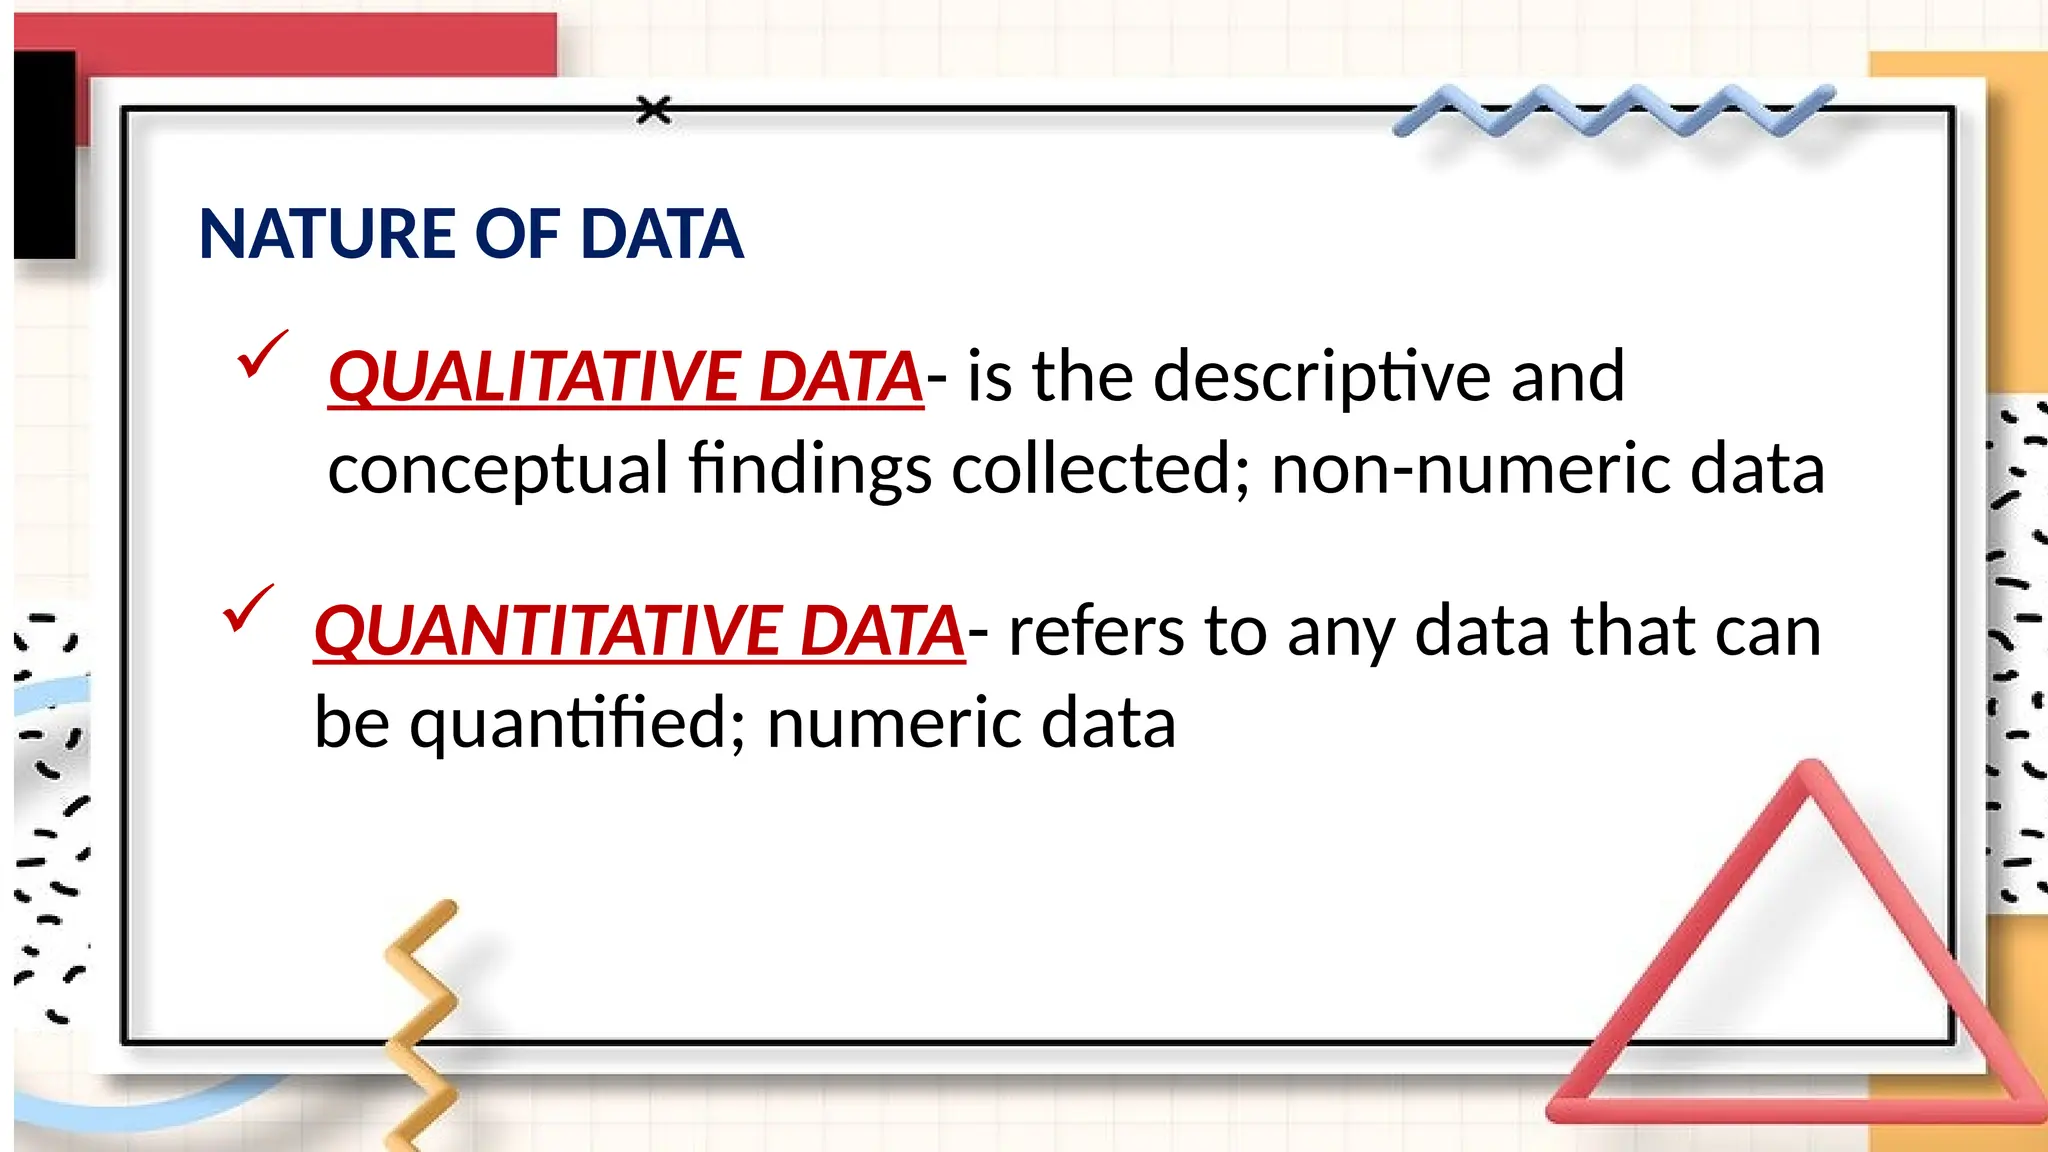
NATURE OF DATA
QUALITATIVE DATA- is the descriptive and
conceptual findings collected; non-numeric data
QUANTITATIVE DATA- refers to any data that can
be quantified; numeric data
14.
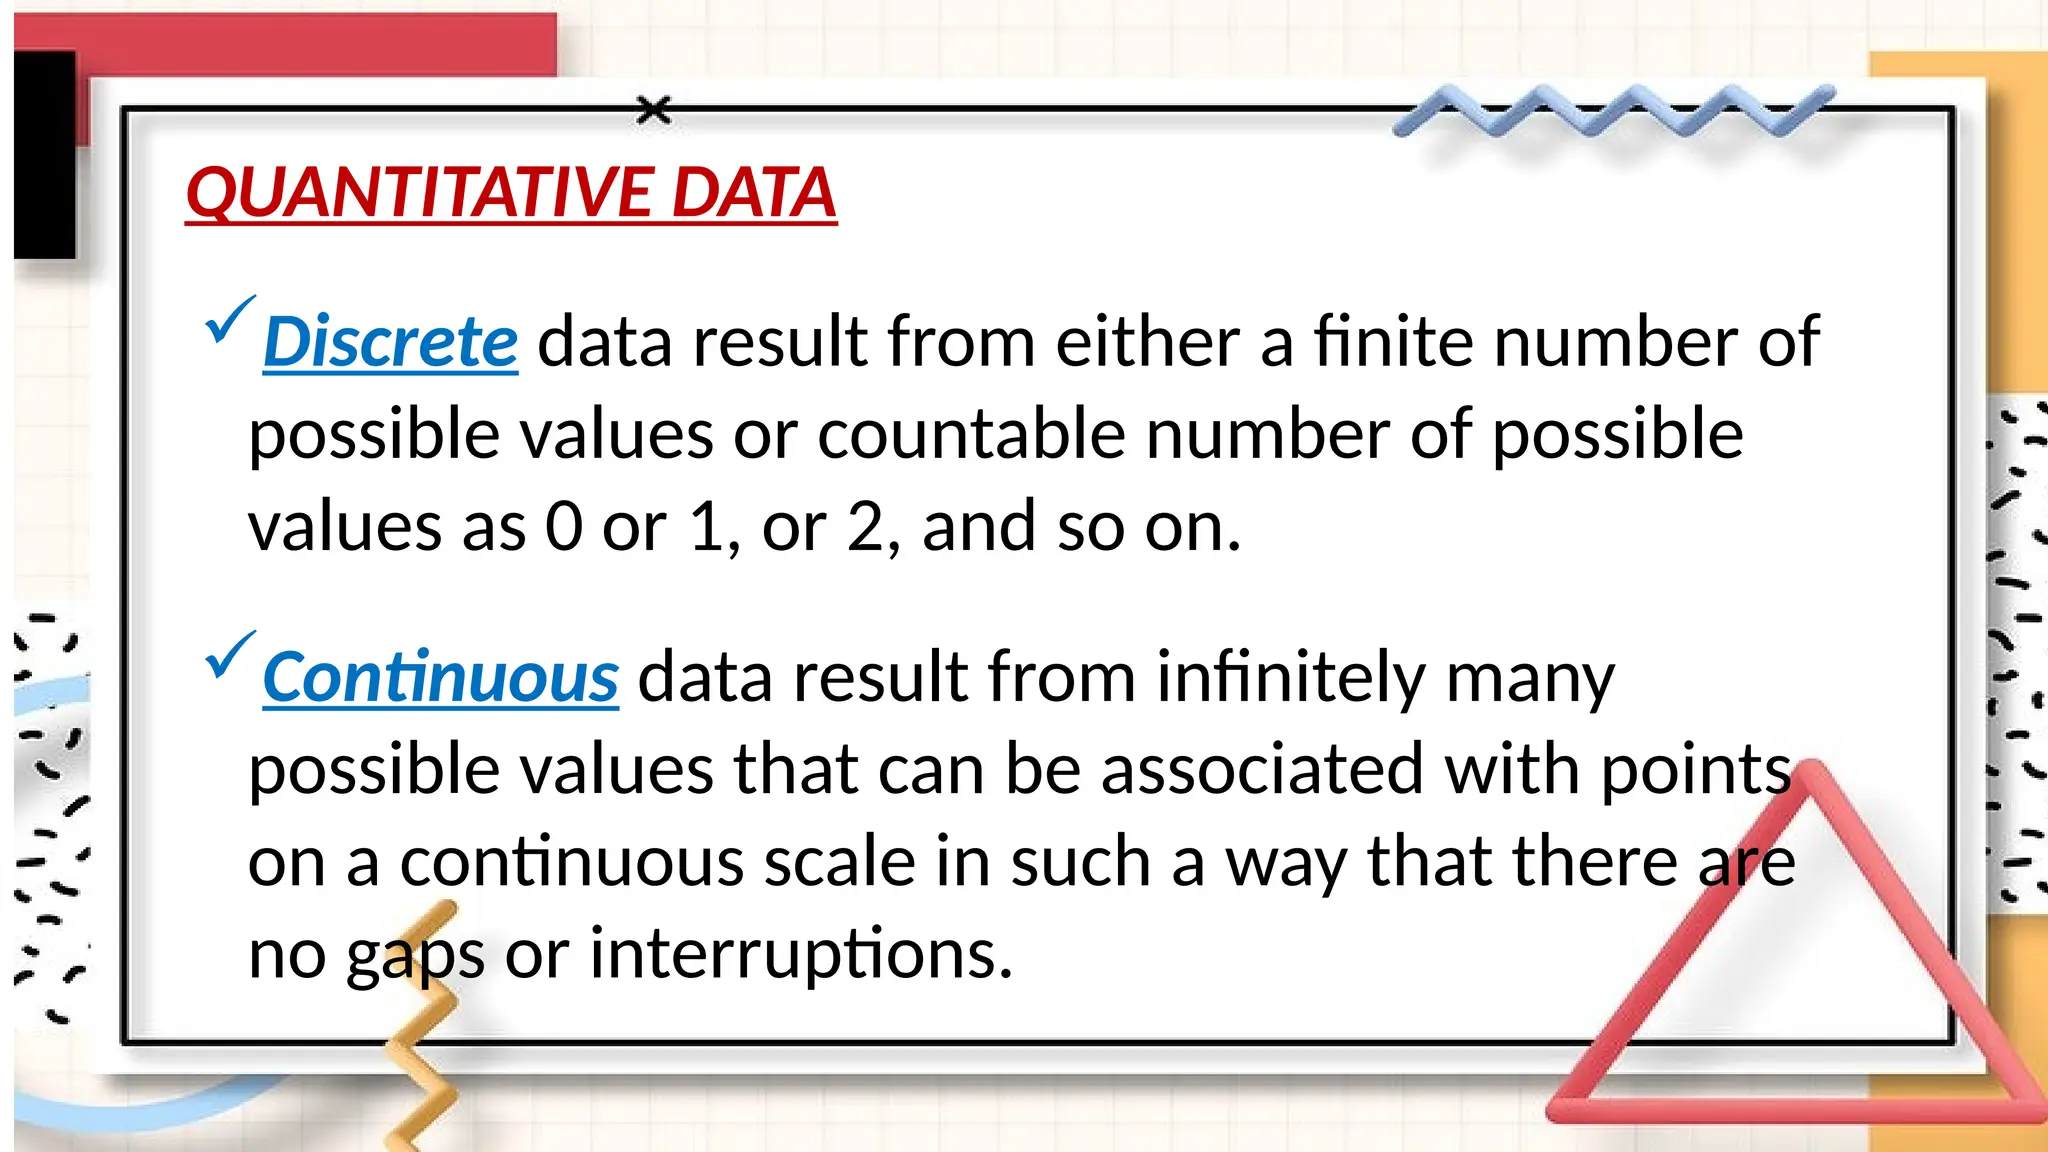
QUANTITATIVE DATA
Discrete dataresult from either a finite number of
possible values or countable number of possible
values as 0 or 1, or 2, and so on.
Continuous data result from infinitely many
possible values that can be associated with points
on a continuous scale in such a way that there are
no gaps or interruptions.
15.
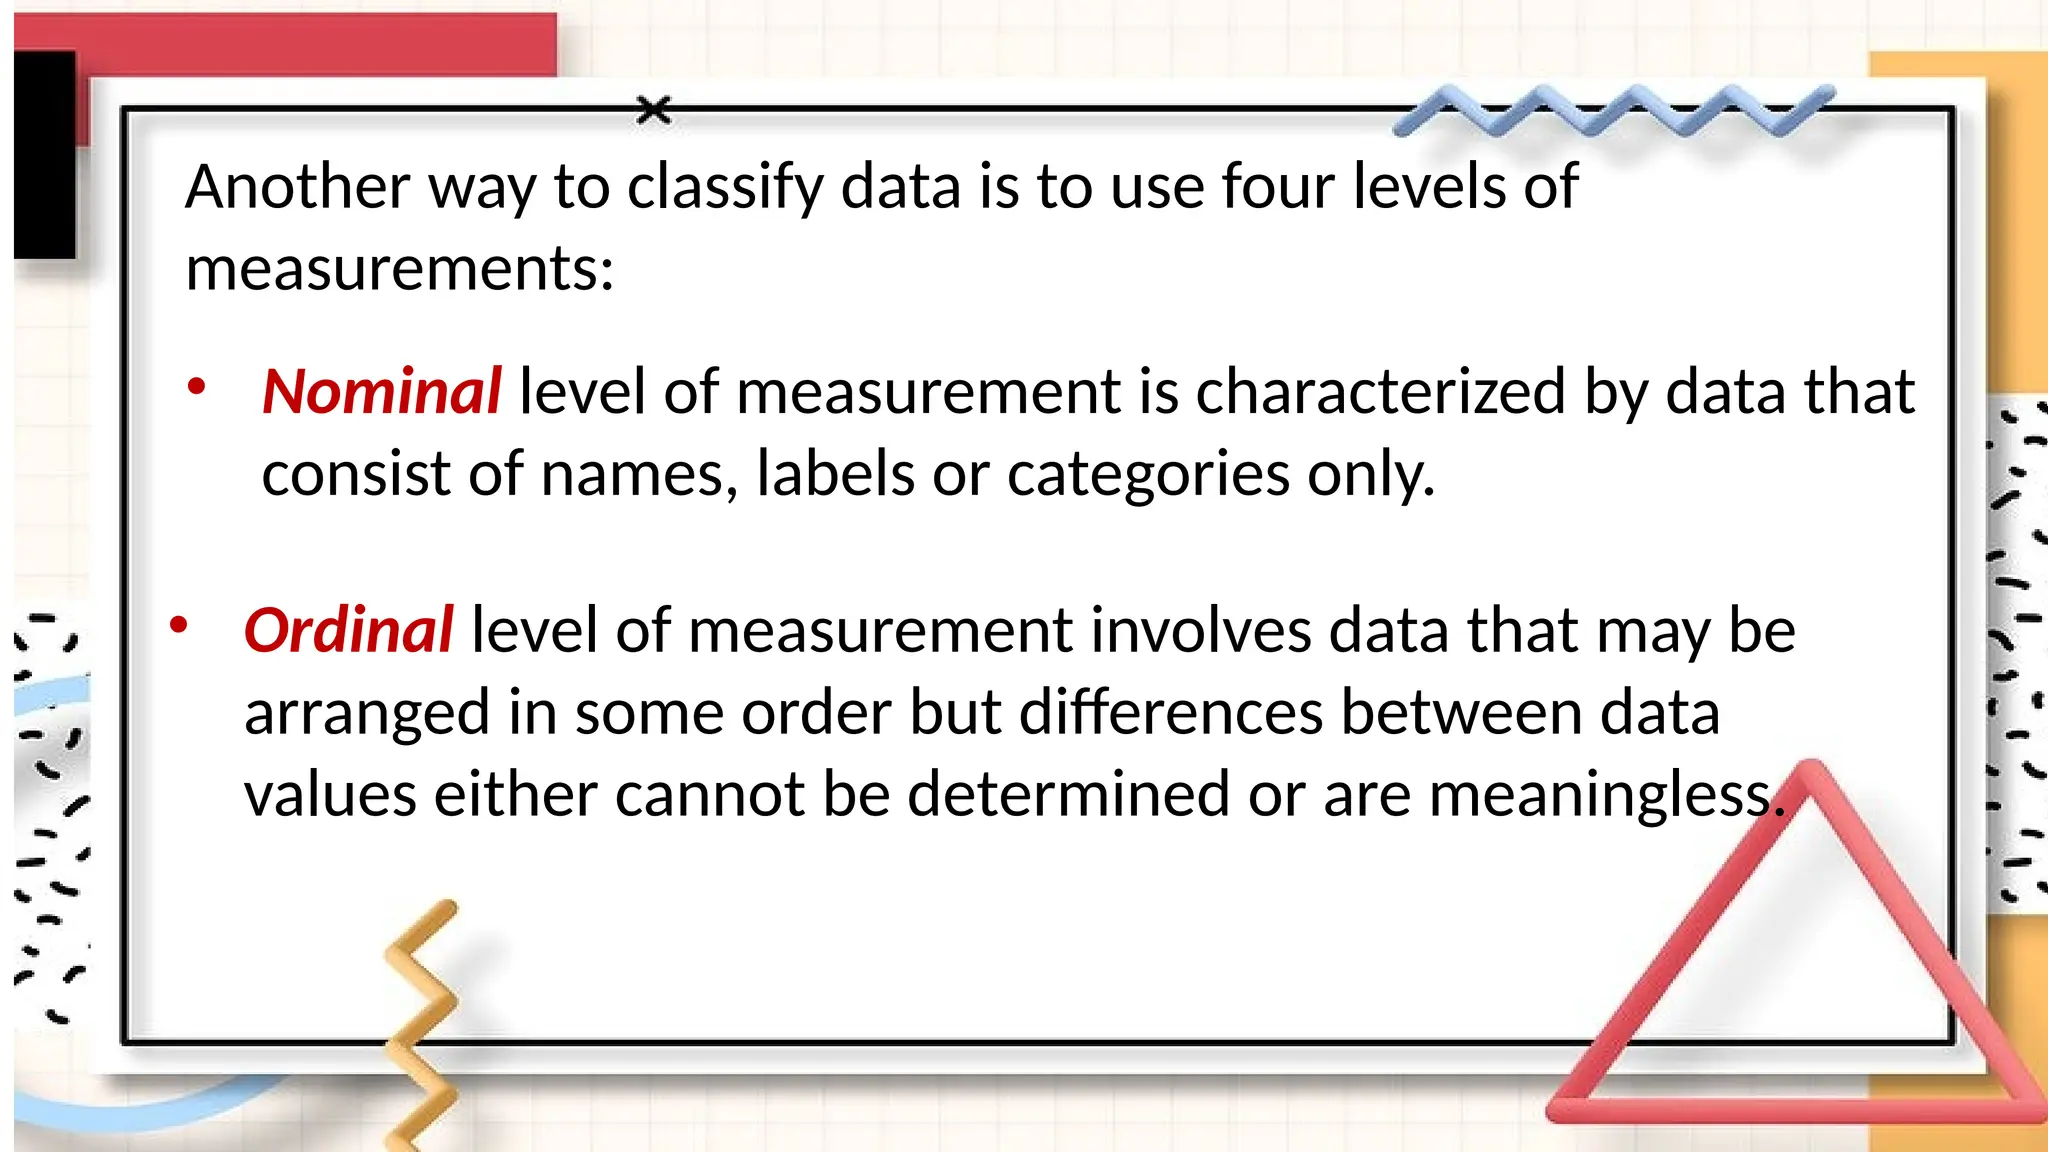
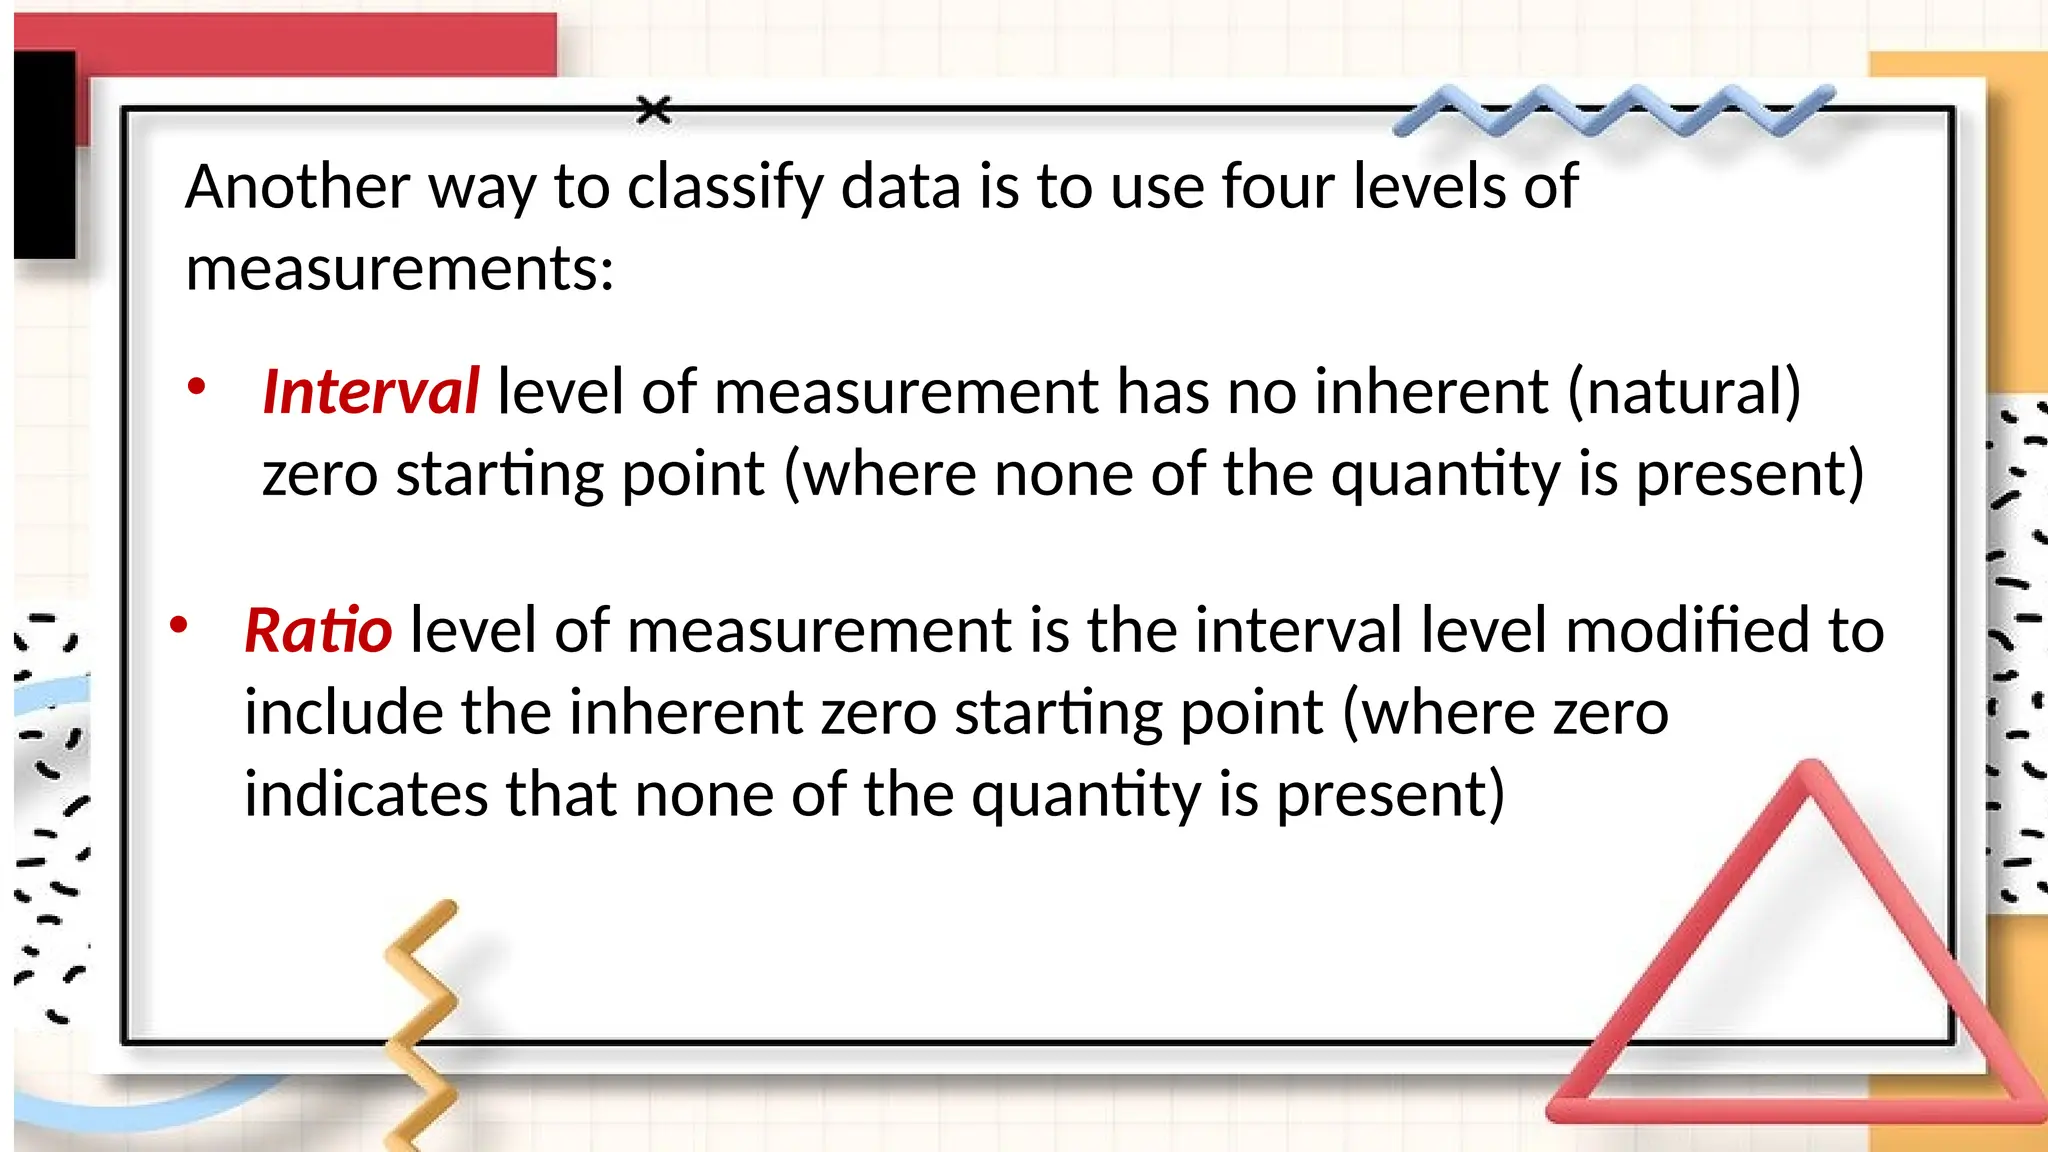
Another way toclassify data is to use four levels of
measurements:
• Nominal level of measurement is characterized by data that
consist of names, labels or categories only.
• Ordinal level of measurement involves data that may be
arranged in some order but differences between data
values either cannot be determined or are meaningless.
16.
Another way toclassify data is to use four levels of
measurements:
• Interval level of measurement has no inherent (natural)
zero starting point (where none of the quantity is present)
• Ratio level of measurement is the interval level modified to
include the inherent zero starting point (where zero
indicates that none of the quantity is present)
17.
BACKGROUND:
Collection of datarefers to the process of
gathering numerical information. This includes
interview, questionnaire, experiments,
observation and documentary analysis.
18.
BACKGROUND:
Once the dataare gathered, the next step in
statistical inquiry is the presentation of data in
appropriate tables and graphs. Such tables refer
to frequency distribution which may either be
one-dimensional or two dimensional. Graphical
presentation includes bar graphs, frequency
polygon, pie graph and many others.
19.
BACKGROUND:
Analysis of datarefers to the activity of
describing the properties or behavior of the data
or the possible correlation of different quantities
or variables.
20.
BACKGROUND:
Finally, interpretation hasto be made based on
the preliminary activities and other statistical
methods. Such methods involve testing the
significance of the results.
21.
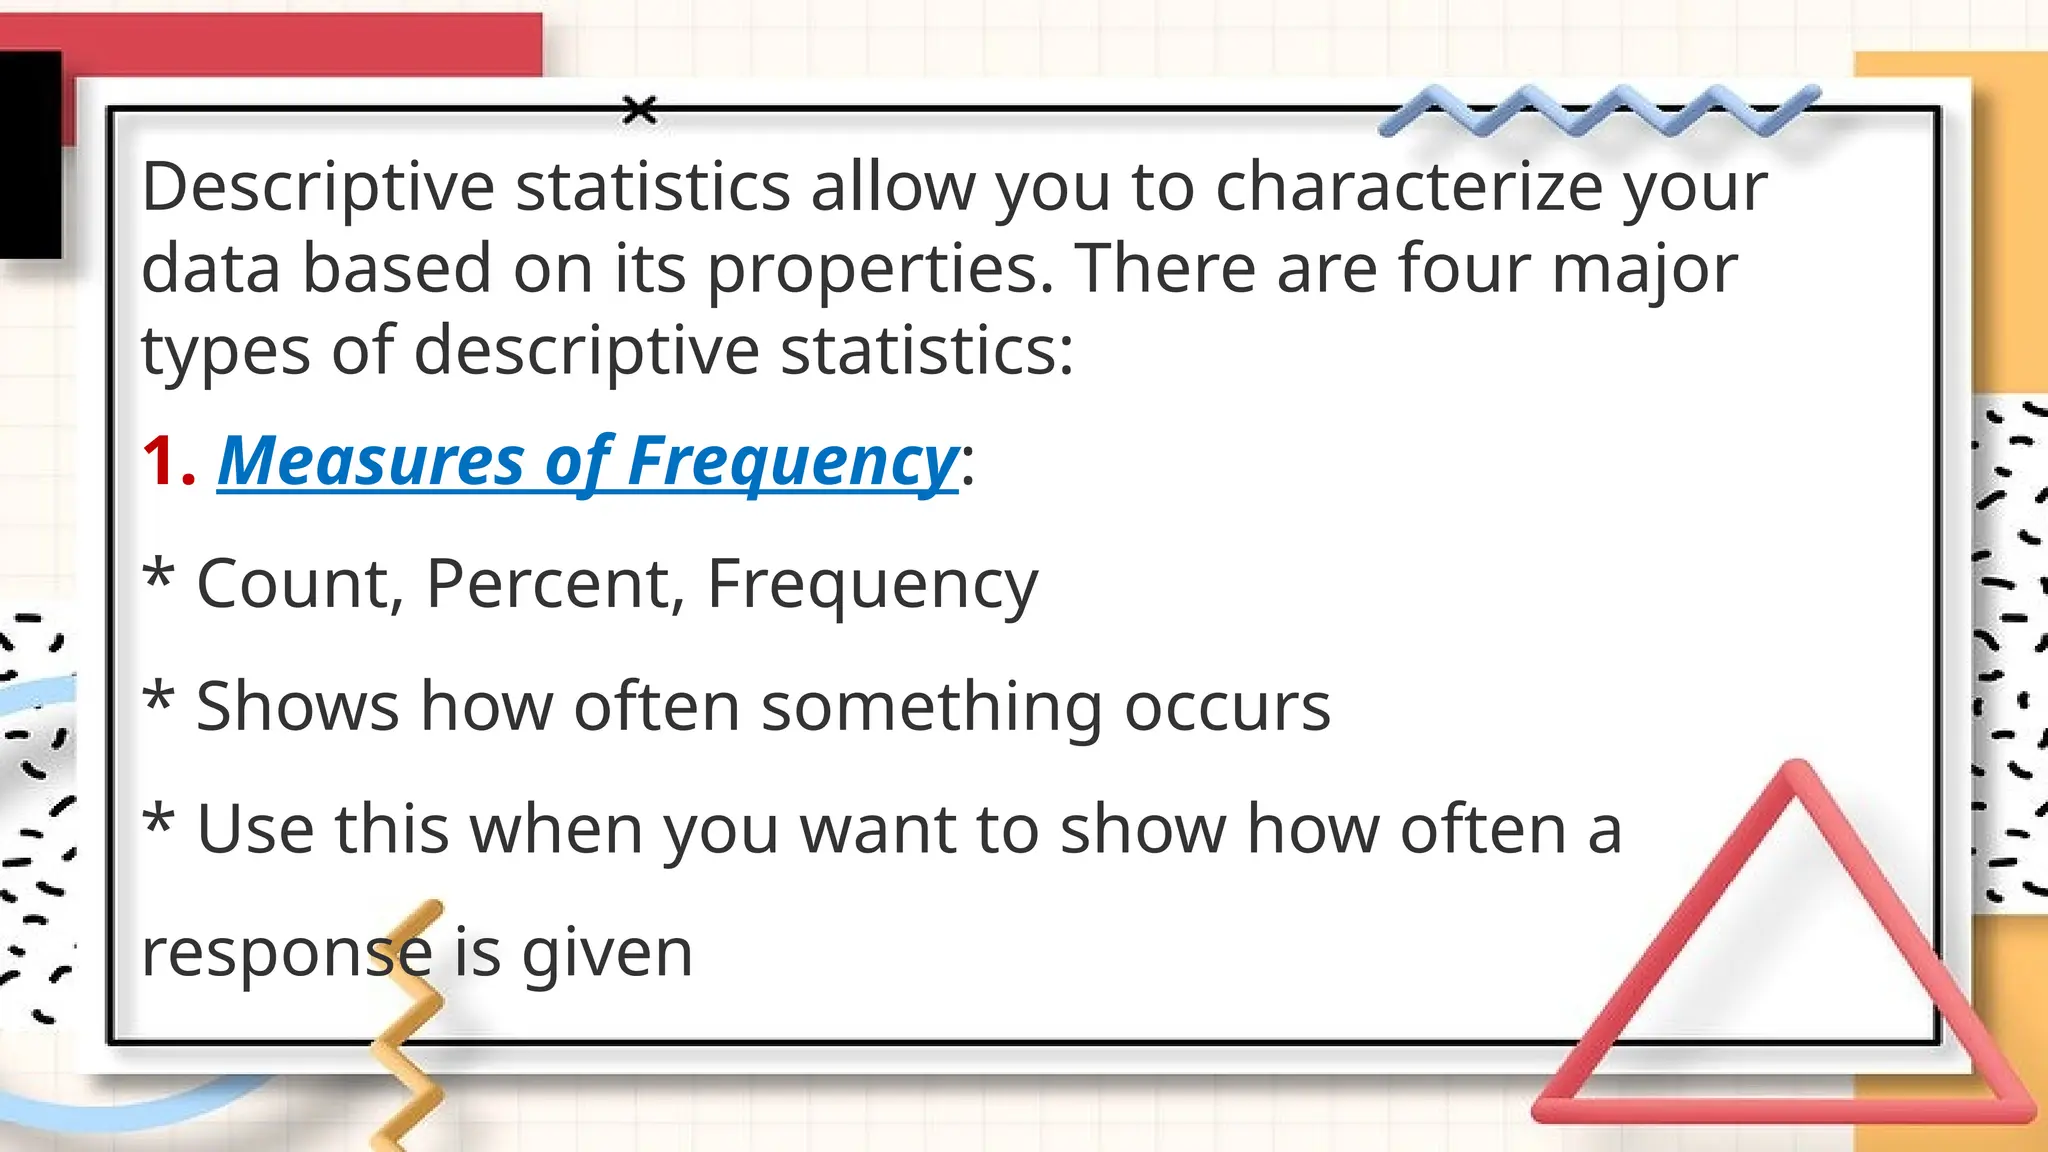
Descriptive statistics allowyou to characterize your
data based on its properties. There are four major
types of descriptive statistics:
1. Measures of Frequency:
* Count, Percent, Frequency
* Shows how often something occurs
* Use this when you want to show how often a
response is given
22.
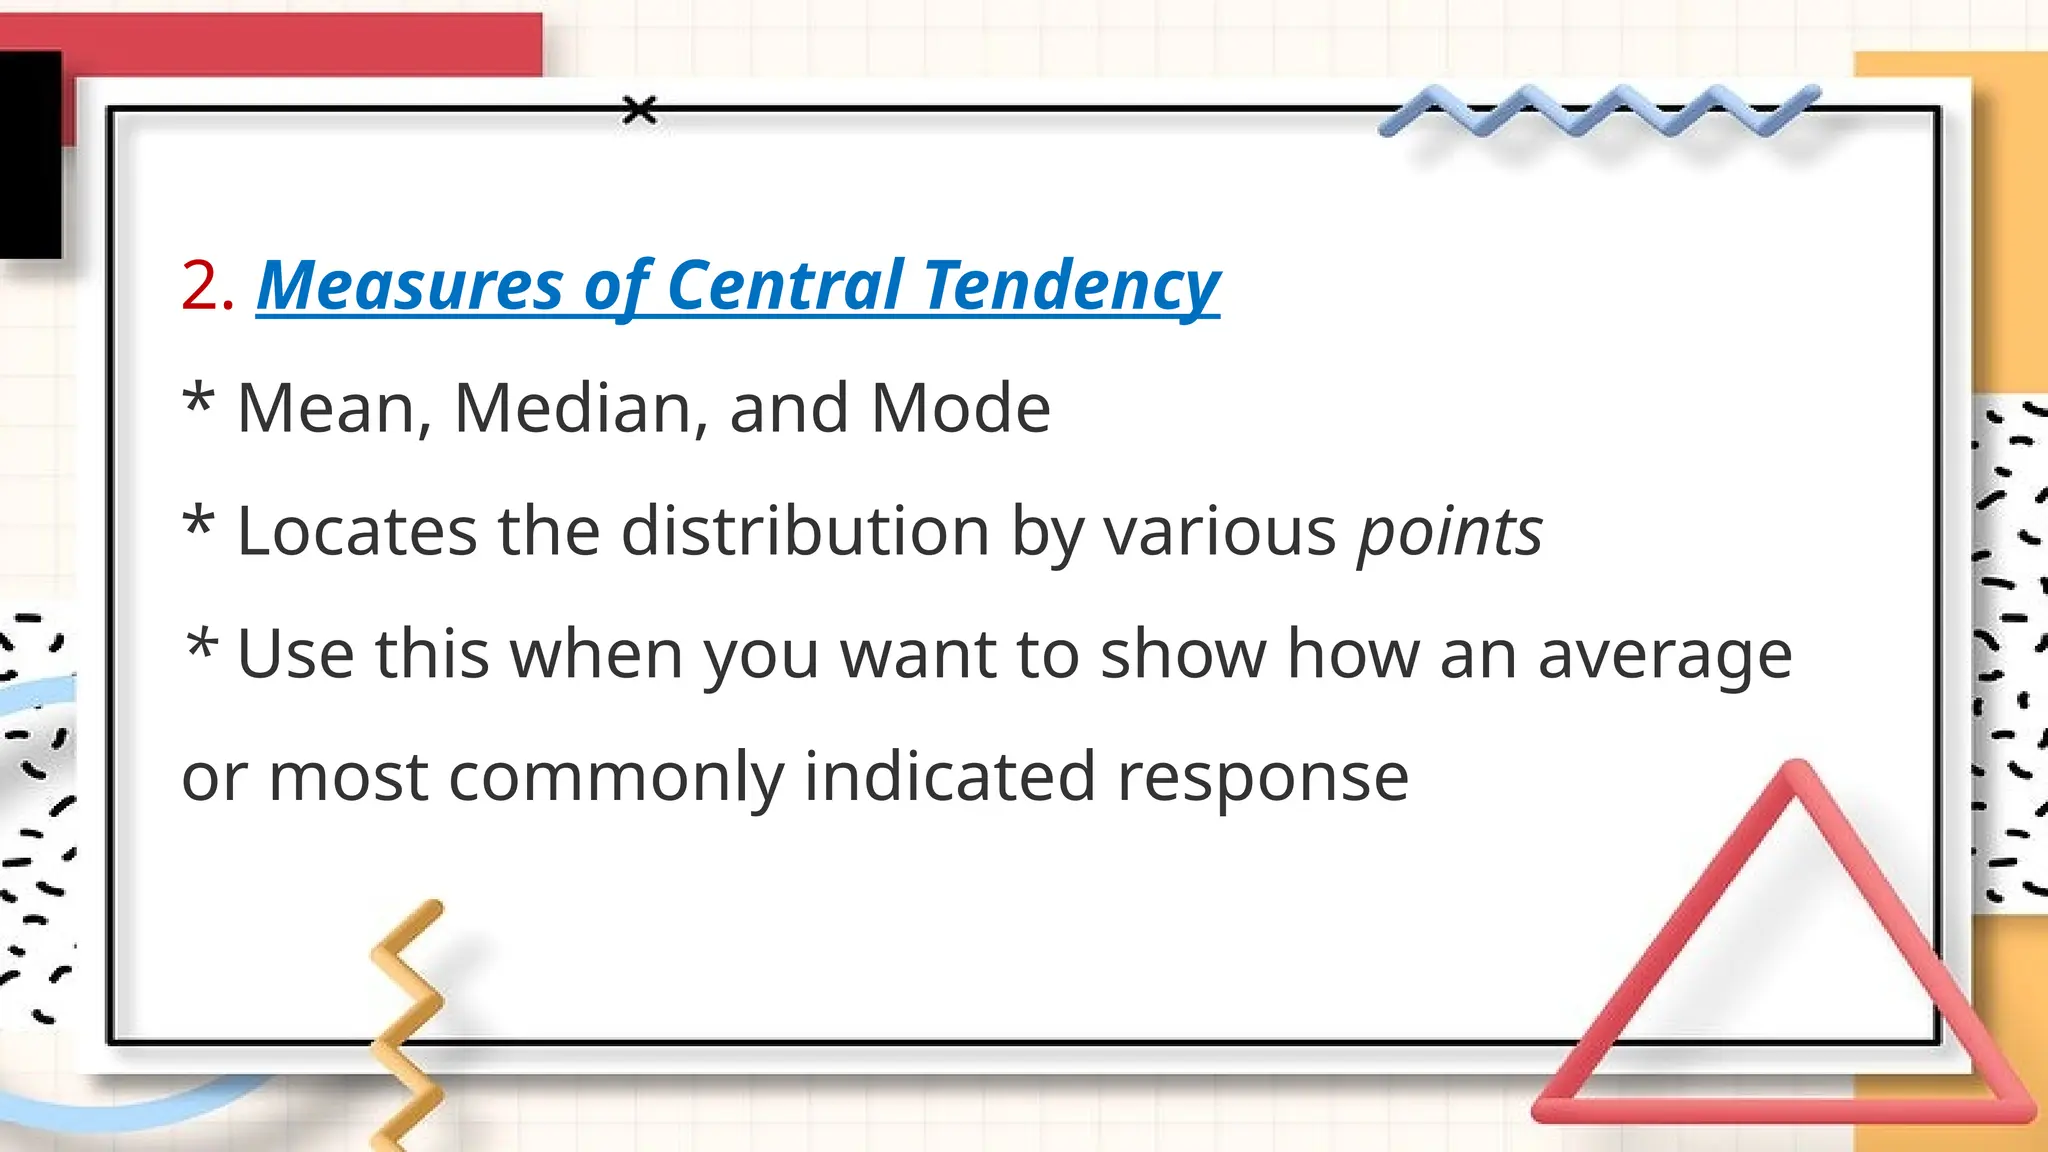
2. Measures ofCentral Tendency
* Mean, Median, and Mode
* Locates the distribution by various points
* Use this when you want to show how an average
or most commonly indicated response
23.
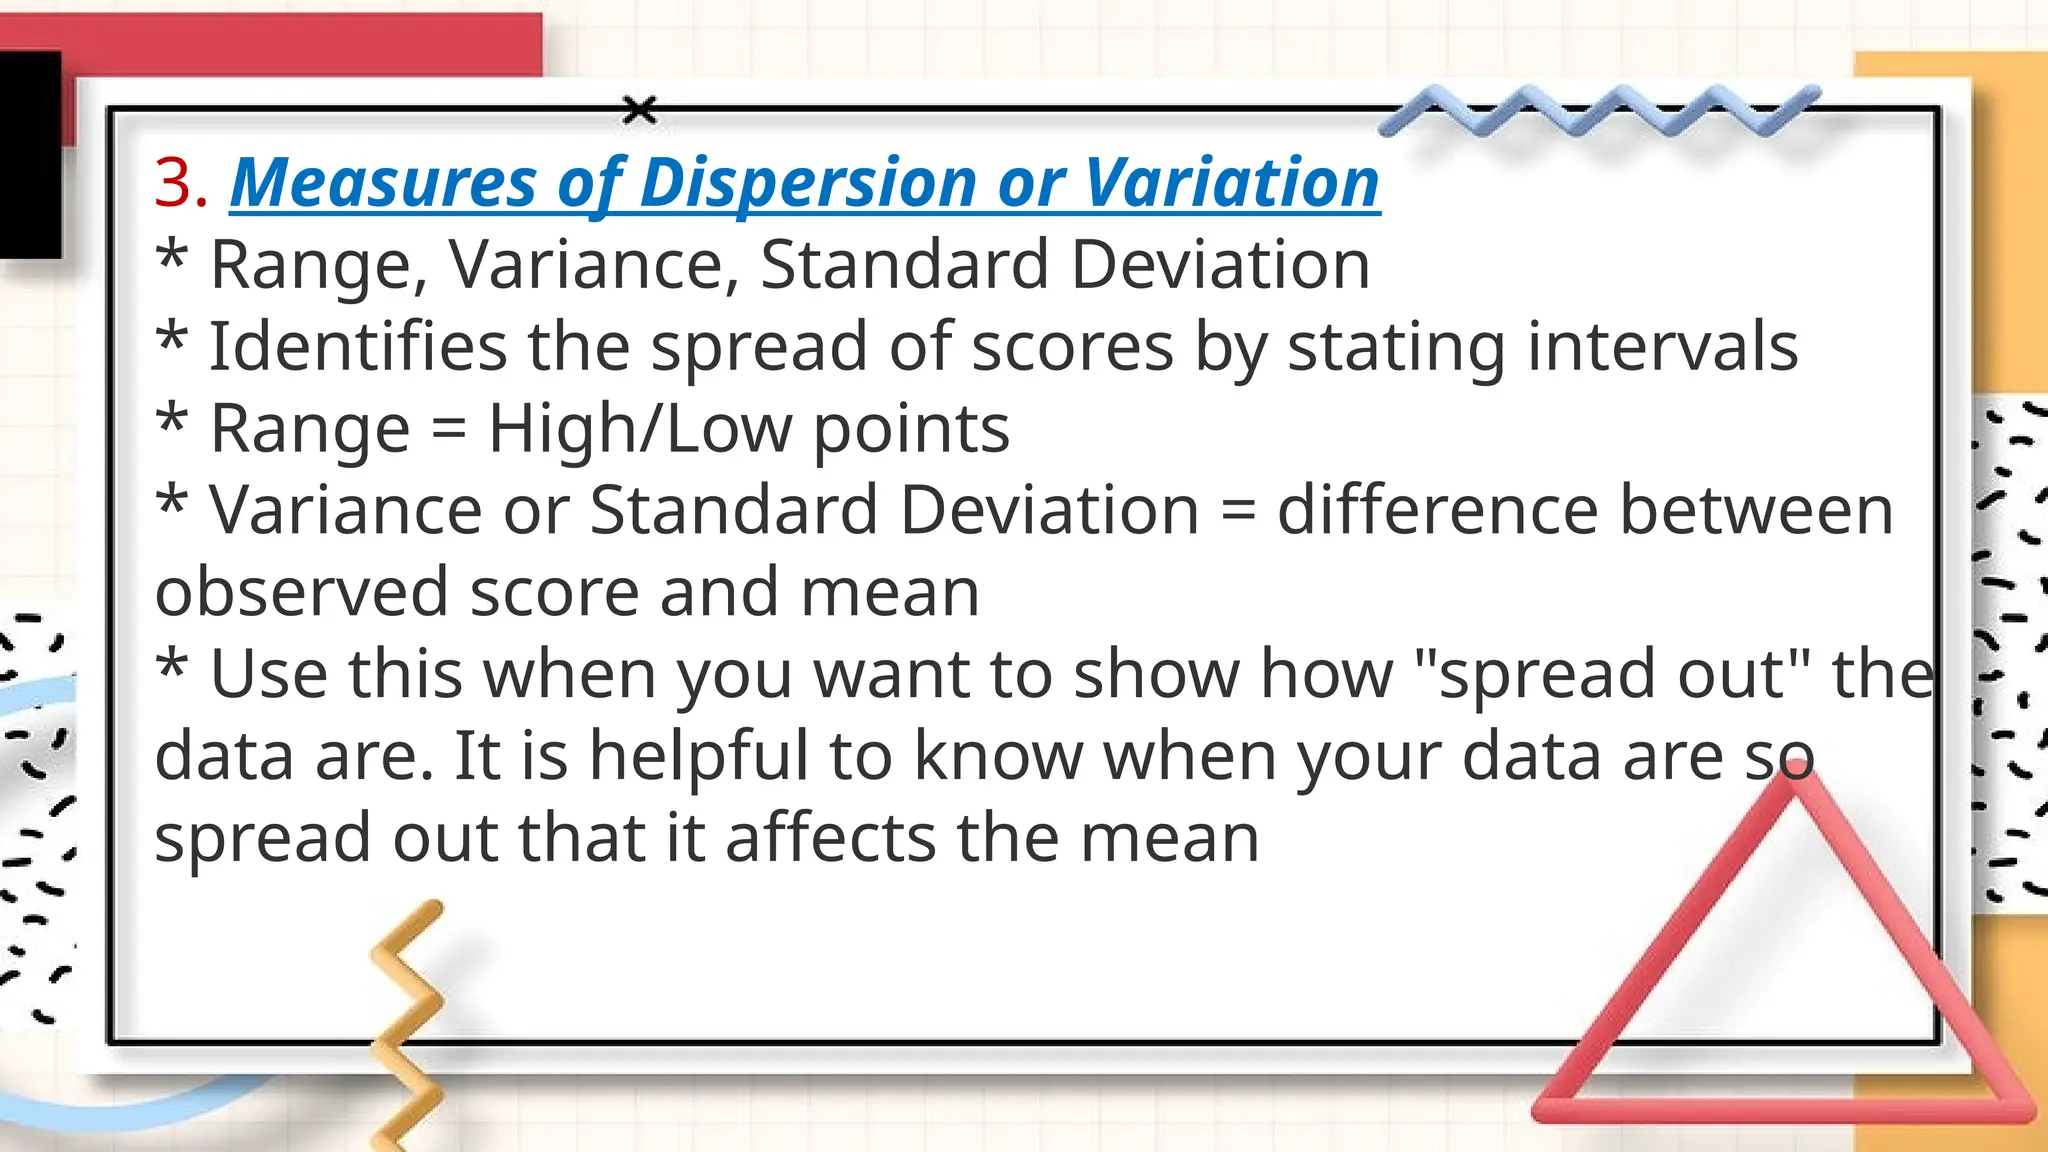
3. Measures ofDispersion or Variation
* Range, Variance, Standard Deviation
* Identifies the spread of scores by stating intervals
* Range = High/Low points
* Variance or Standard Deviation = difference between
observed score and mean
* Use this when you want to show how "spread out" the
data are. It is helpful to know when your data are so
spread out that it affects the mean
24.
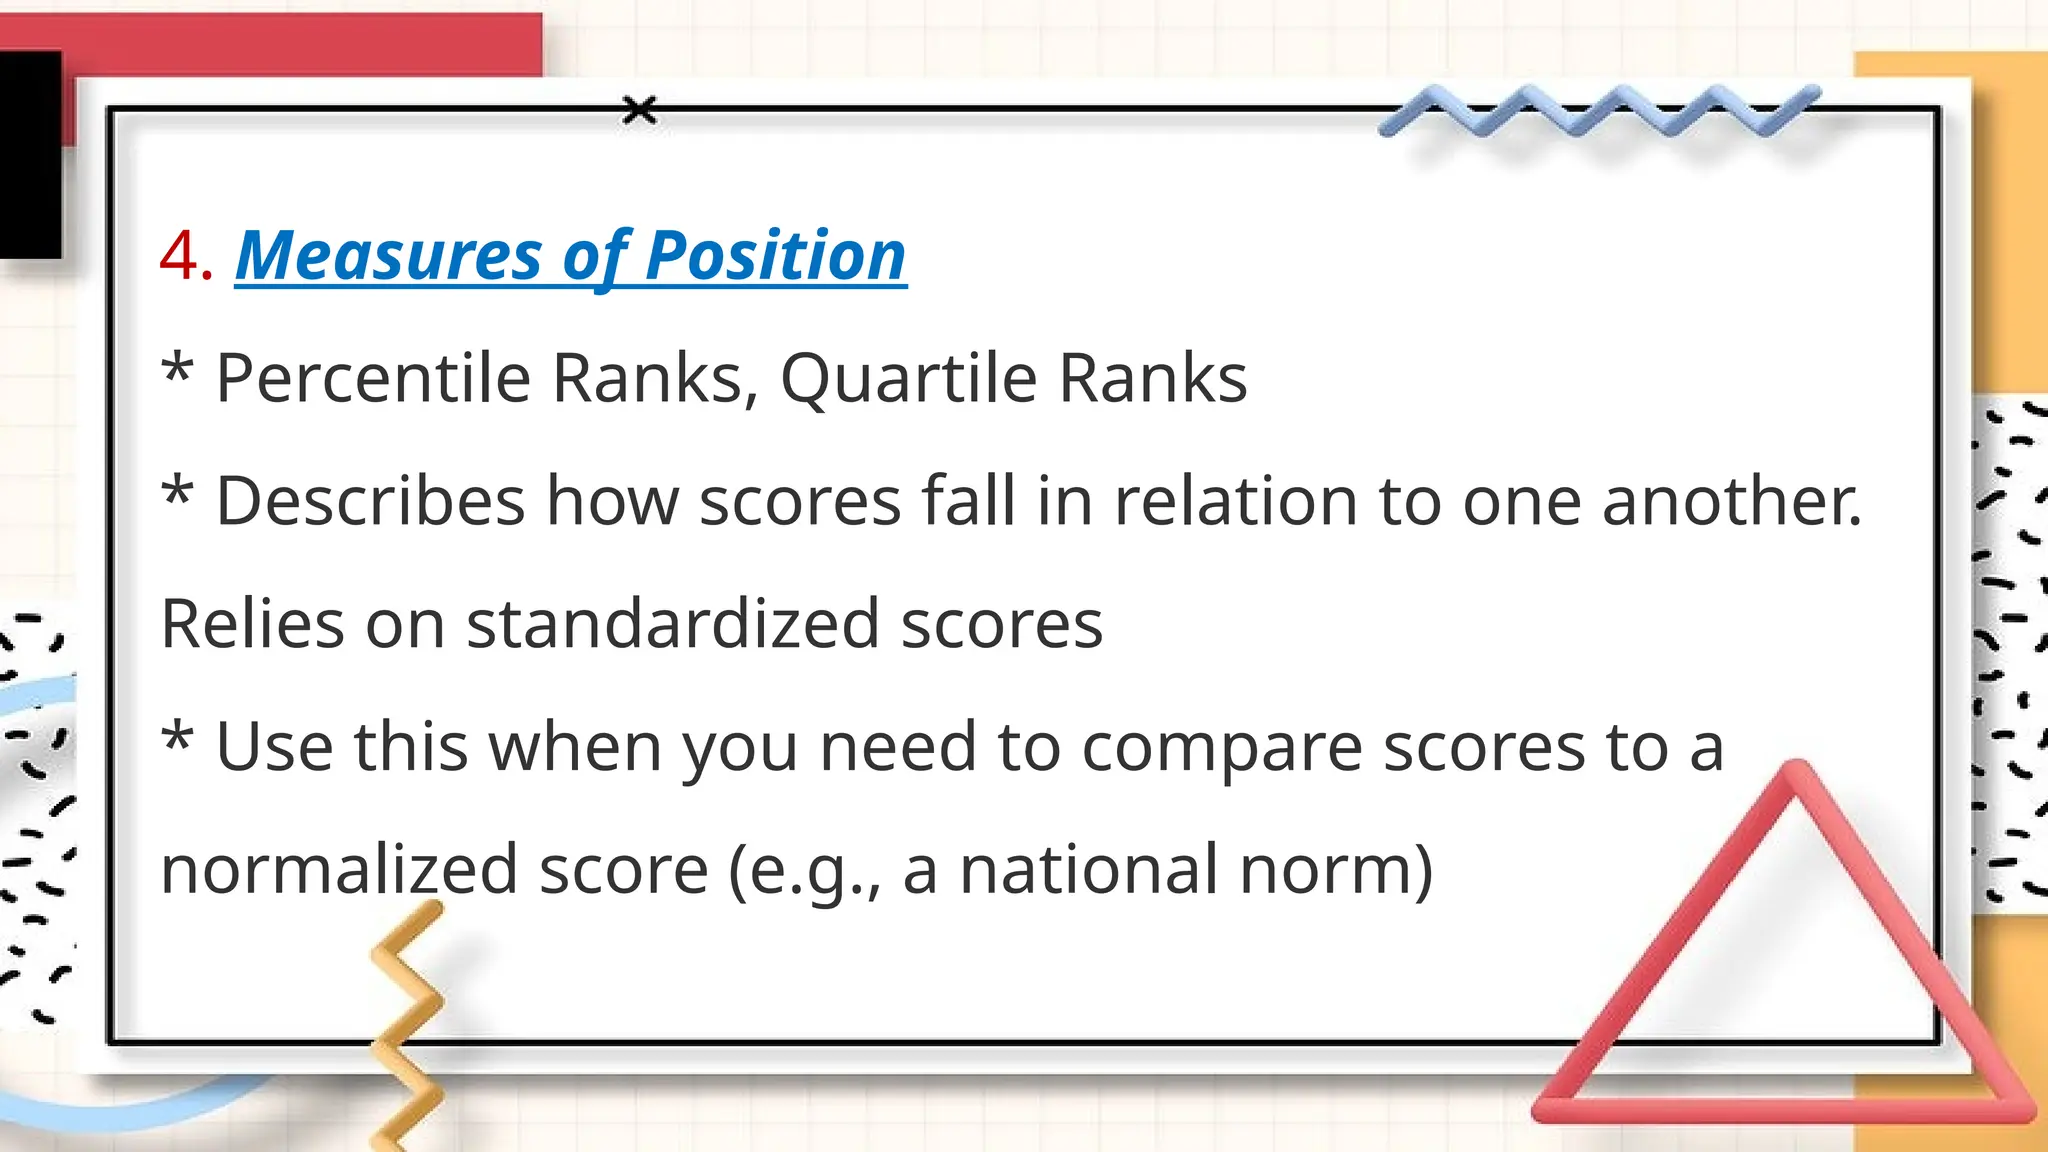
4. Measures ofPosition
* Percentile Ranks, Quartile Ranks
* Describes how scores fall in relation to one another.
Relies on standardized scores
* Use this when you need to compare scores to a
normalized score (e.g., a national norm)
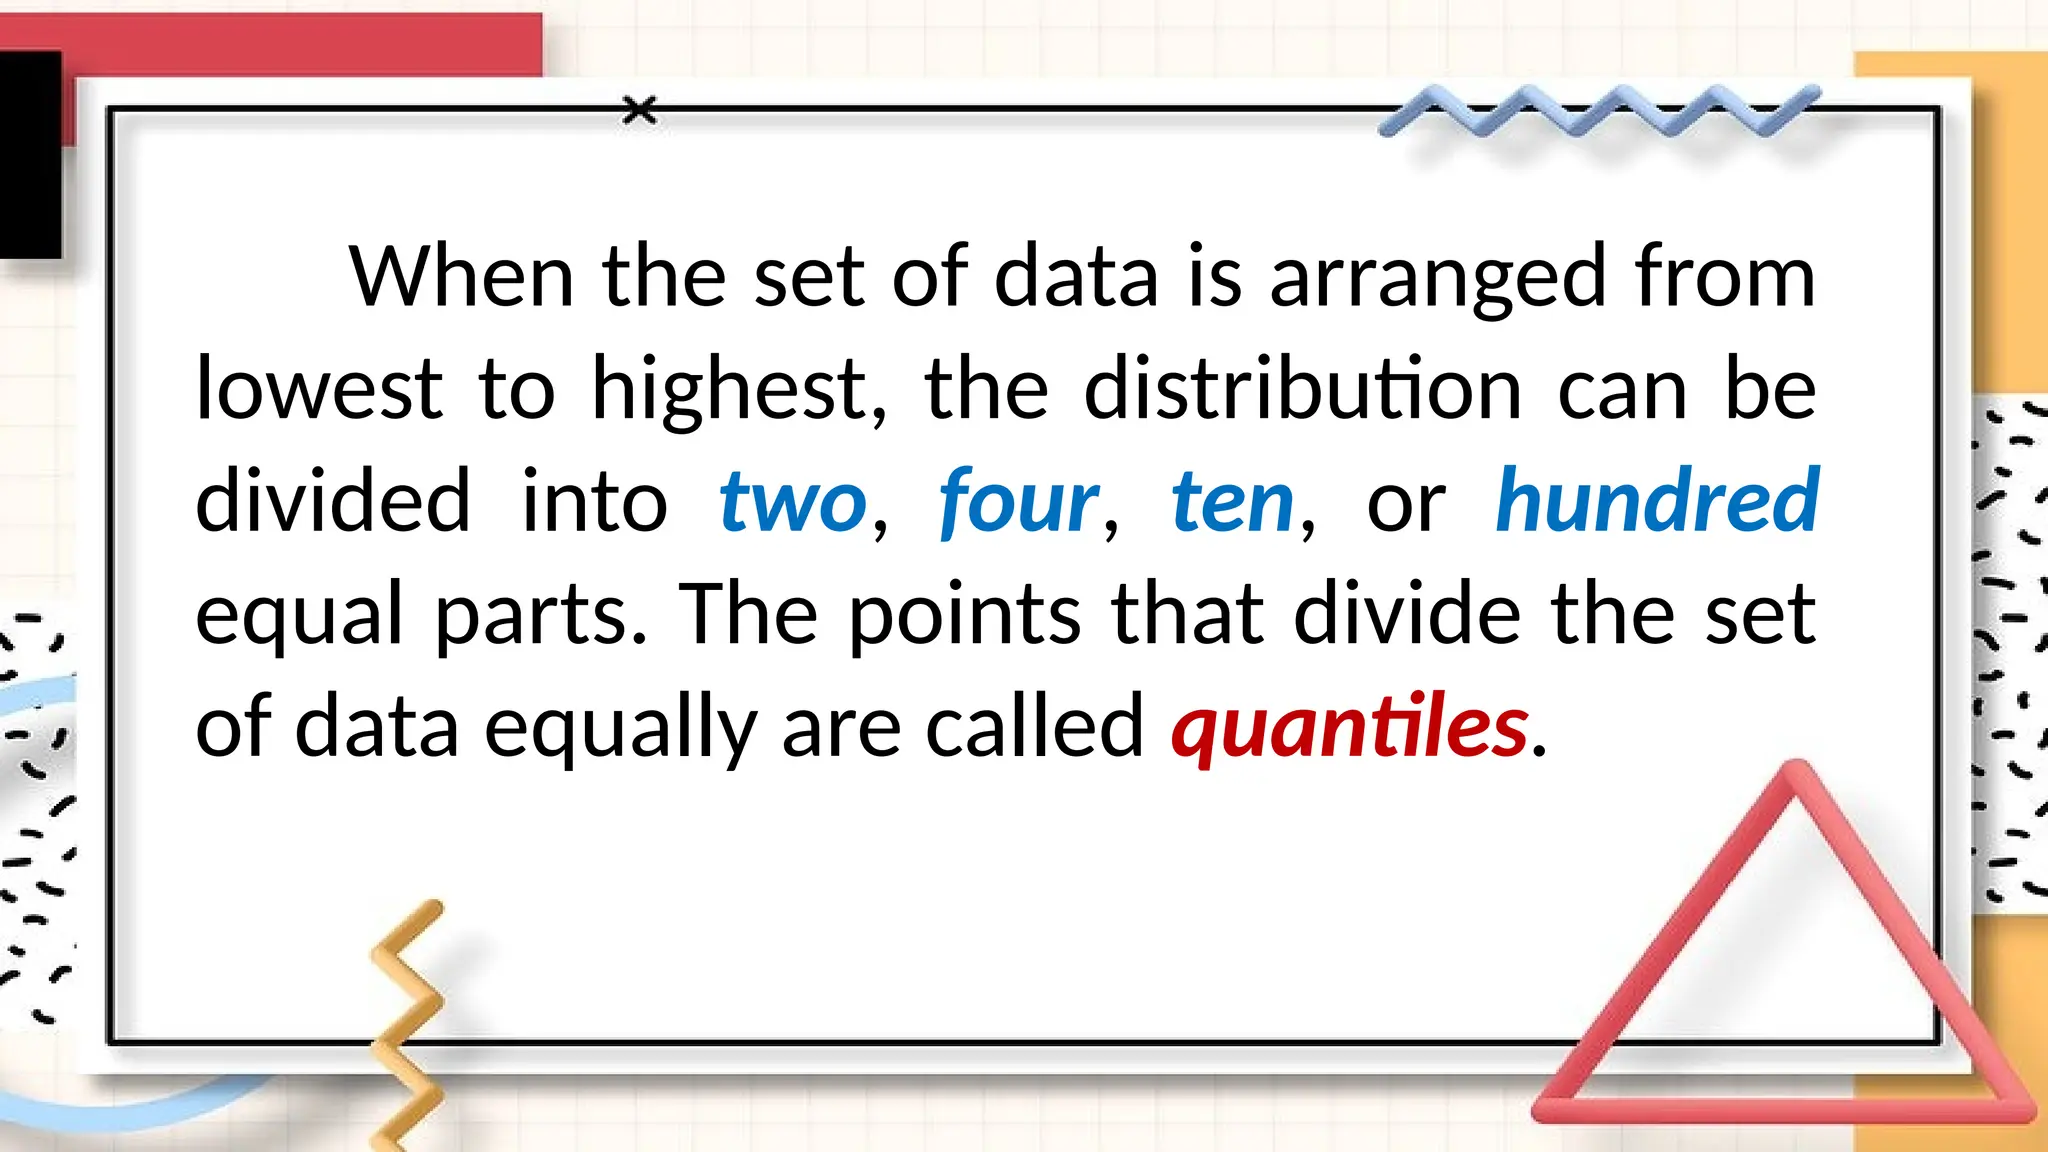
When the setof data is arranged from
lowest to highest, the distribution can be
divided into two, four, ten, or hundred
equal parts. The points that divide the set
of data equally are called quantiles.
28.
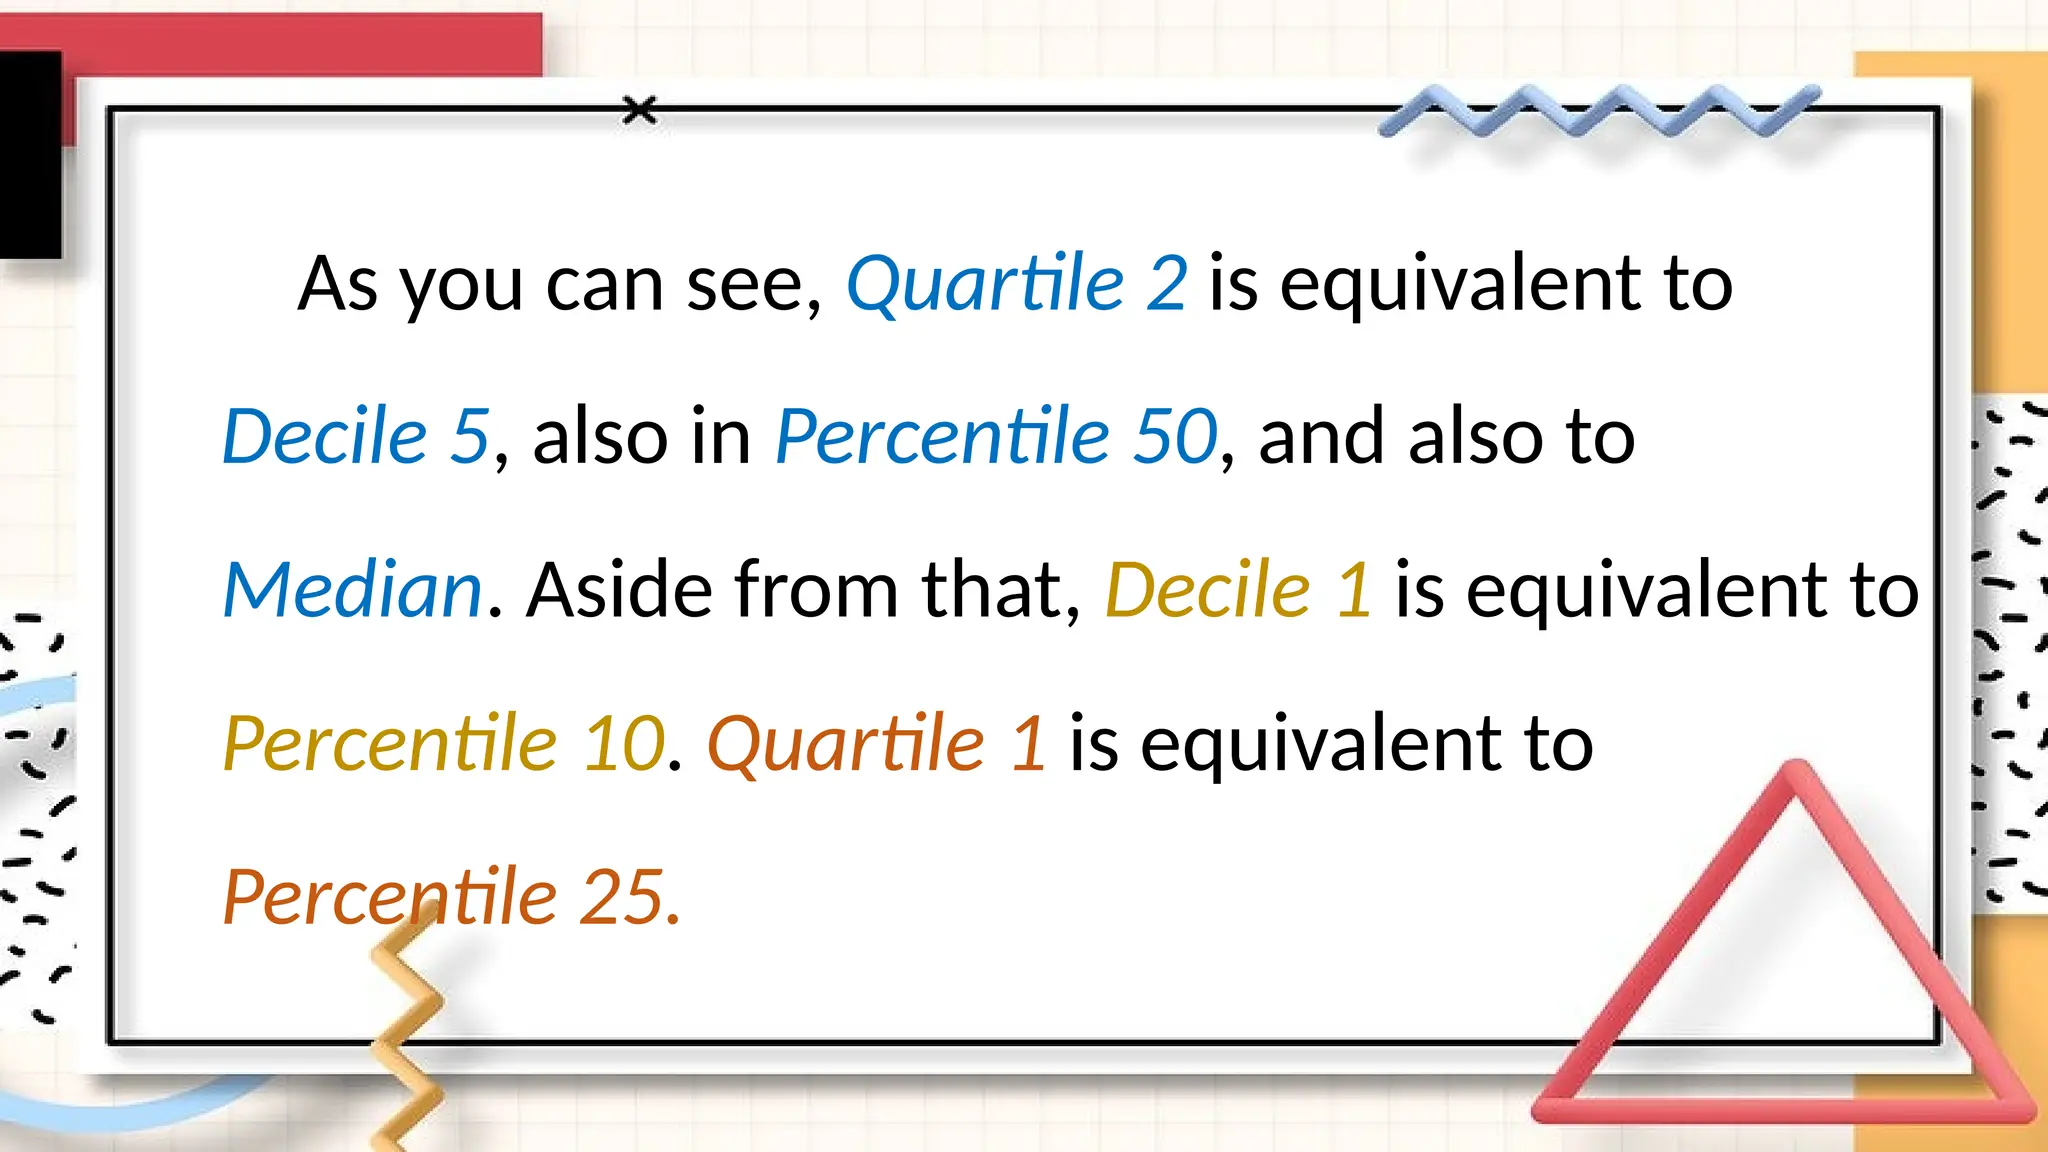
As you cansee, Quartile 2 is equivalent to
Decile 5, also in Percentile 50, and also to
Median. Aside from that, Decile 1 is equivalent to
Percentile 10. Quartile 1 is equivalent to
Percentile 25.
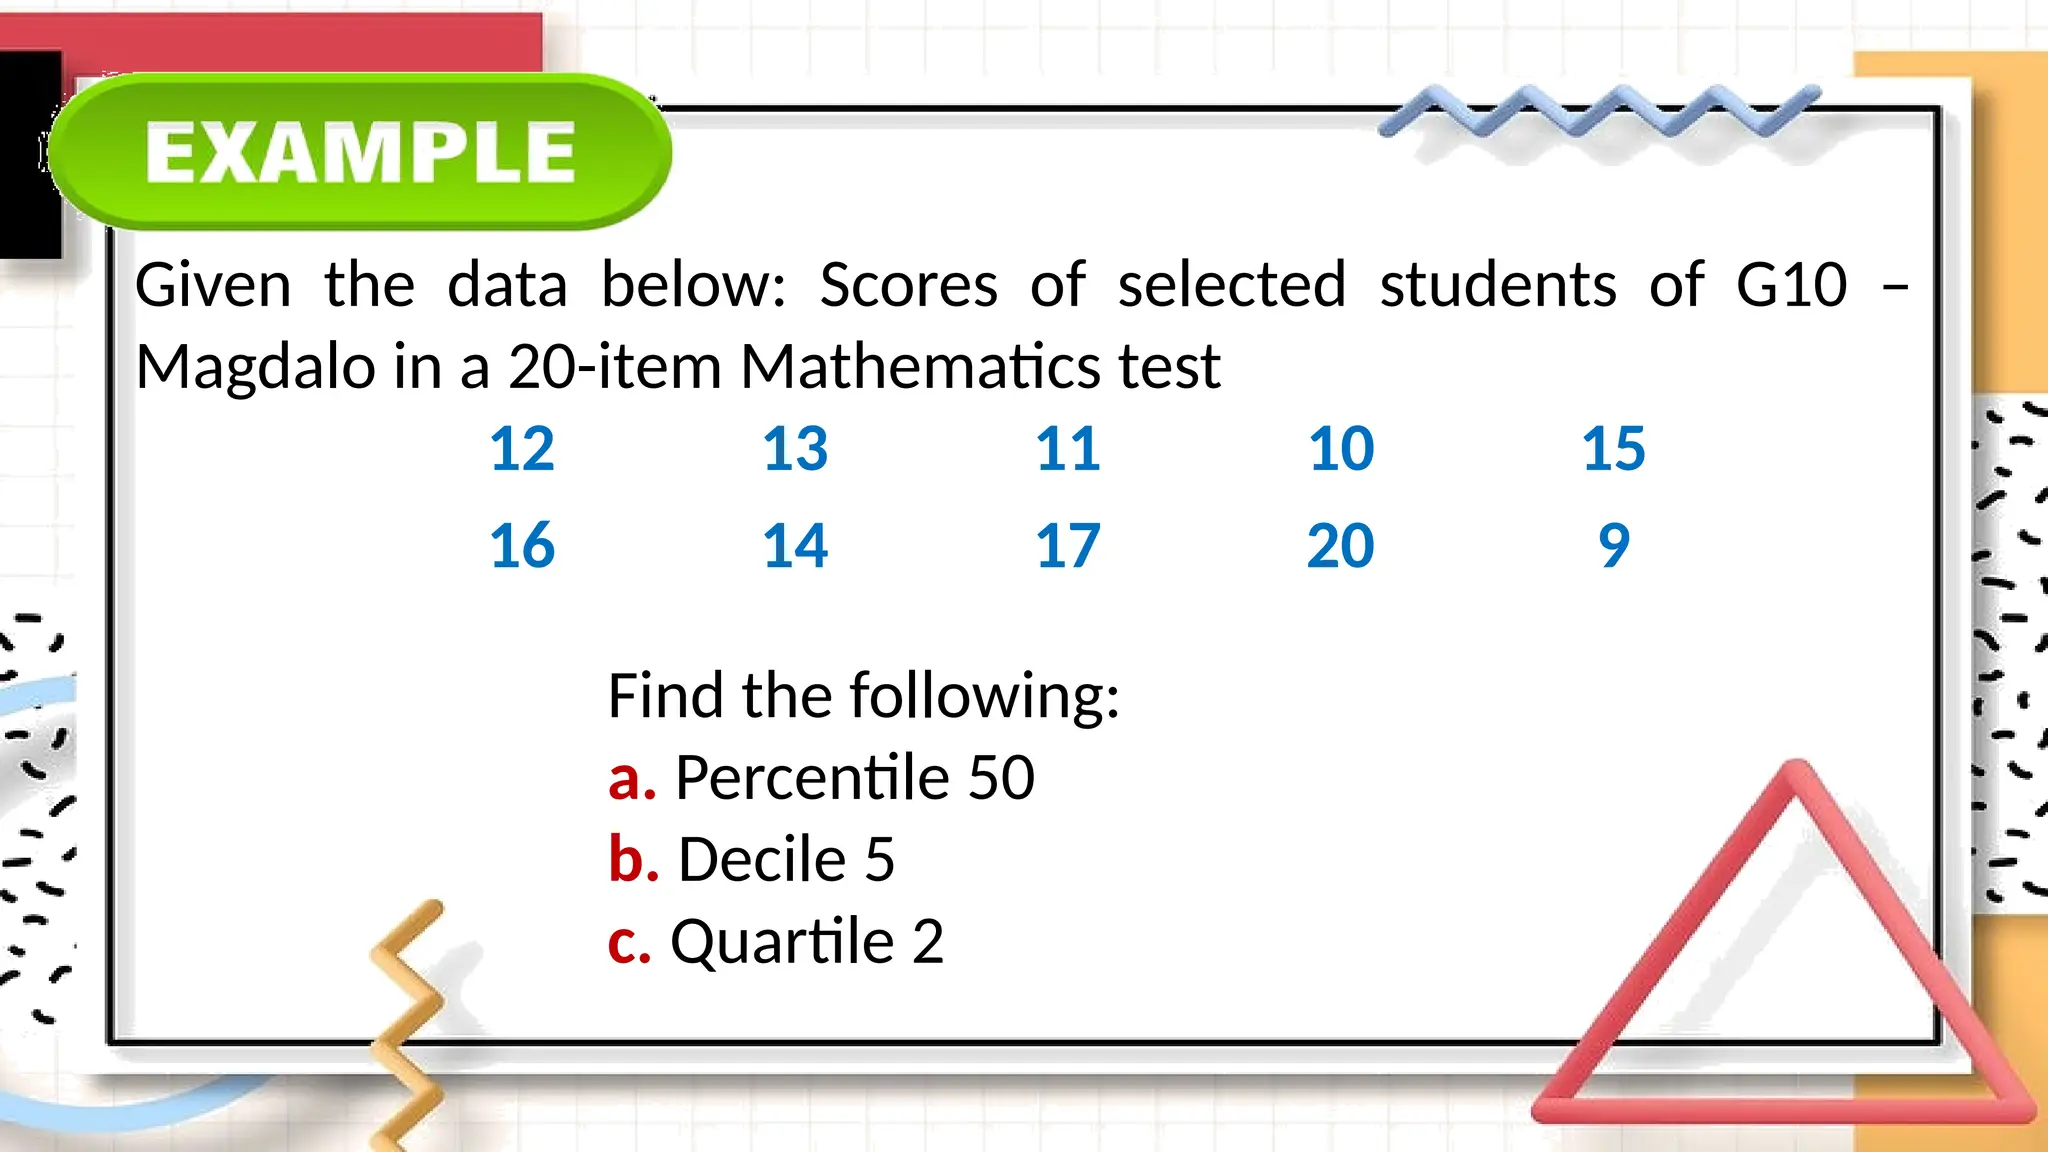
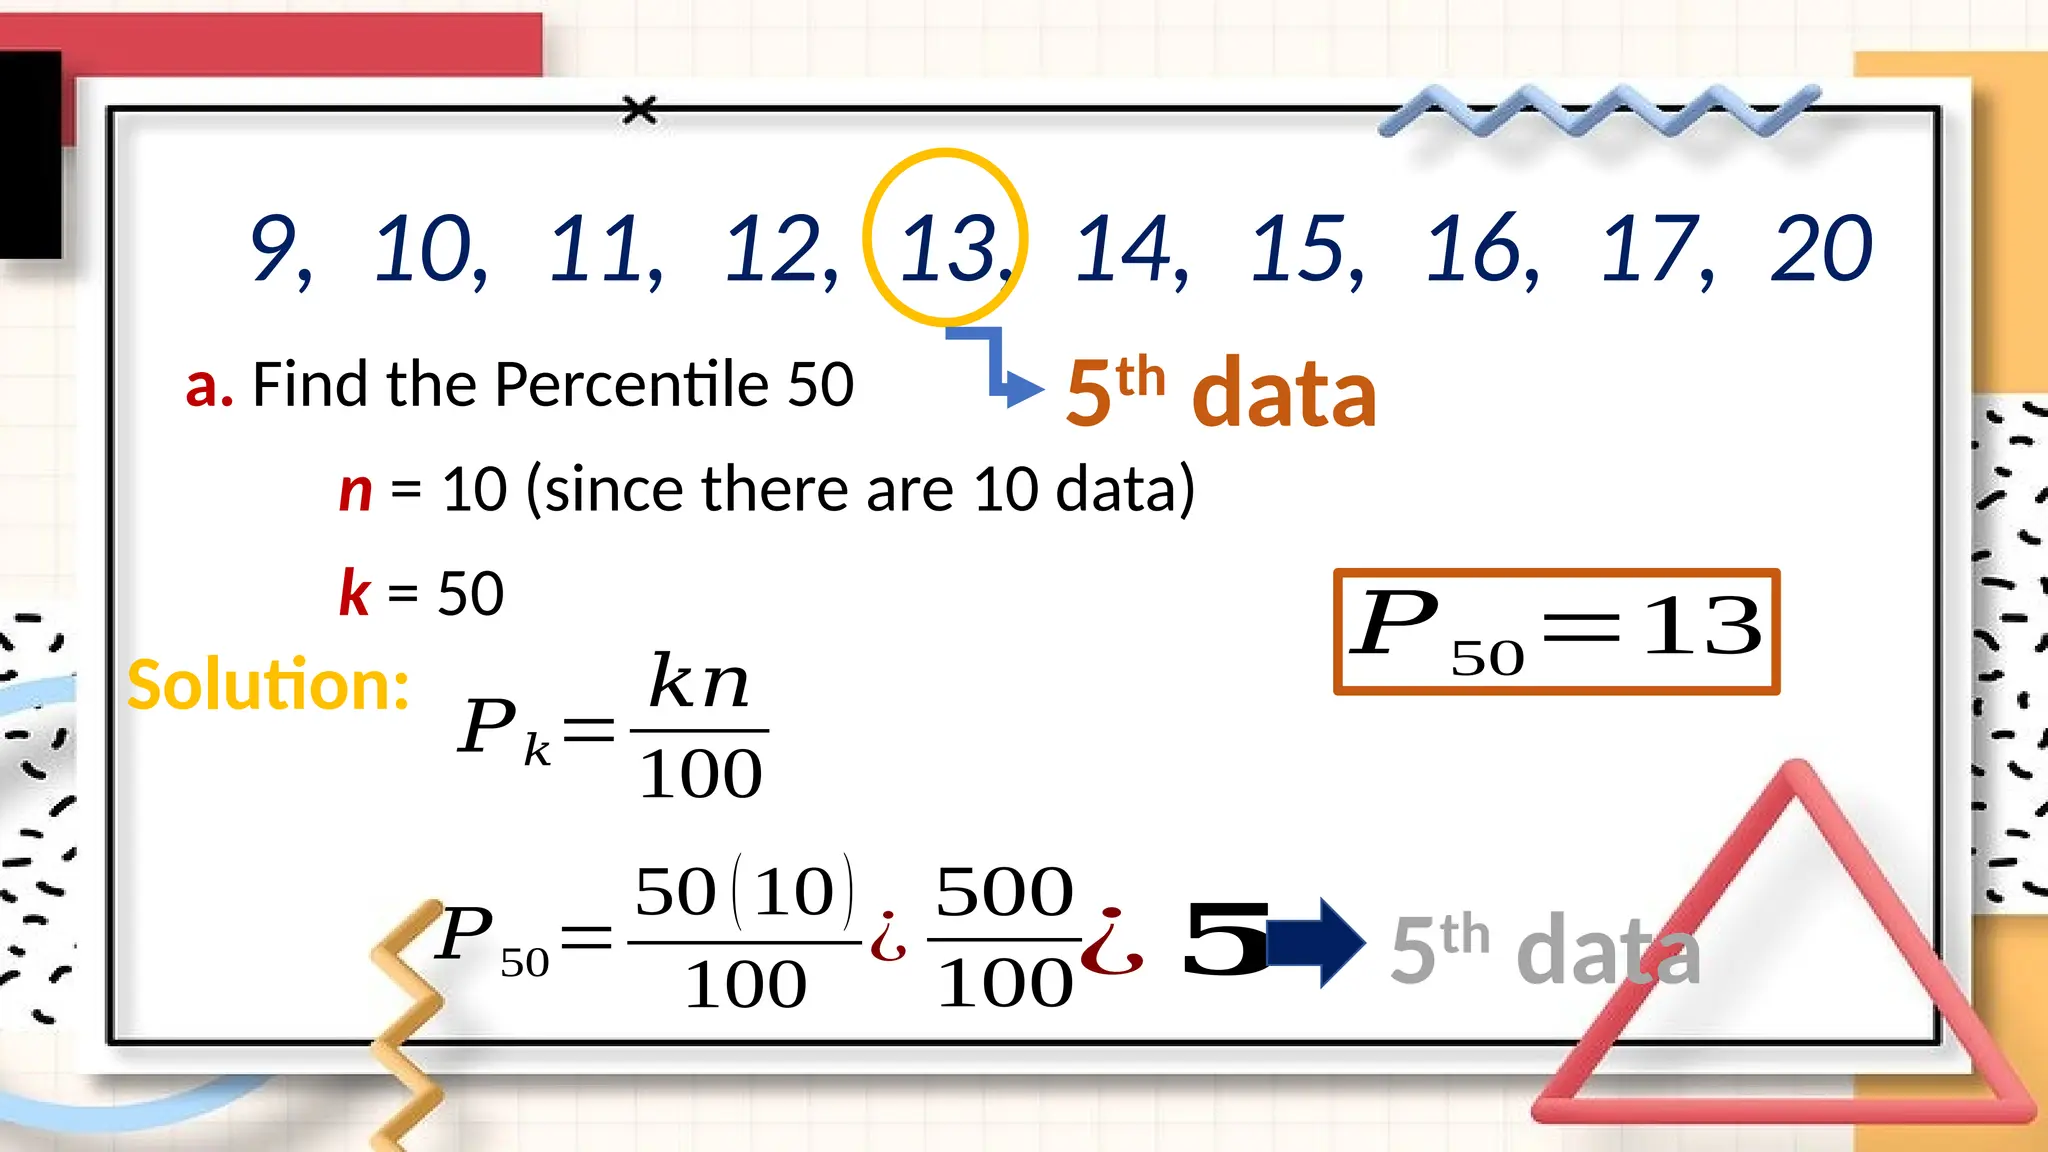
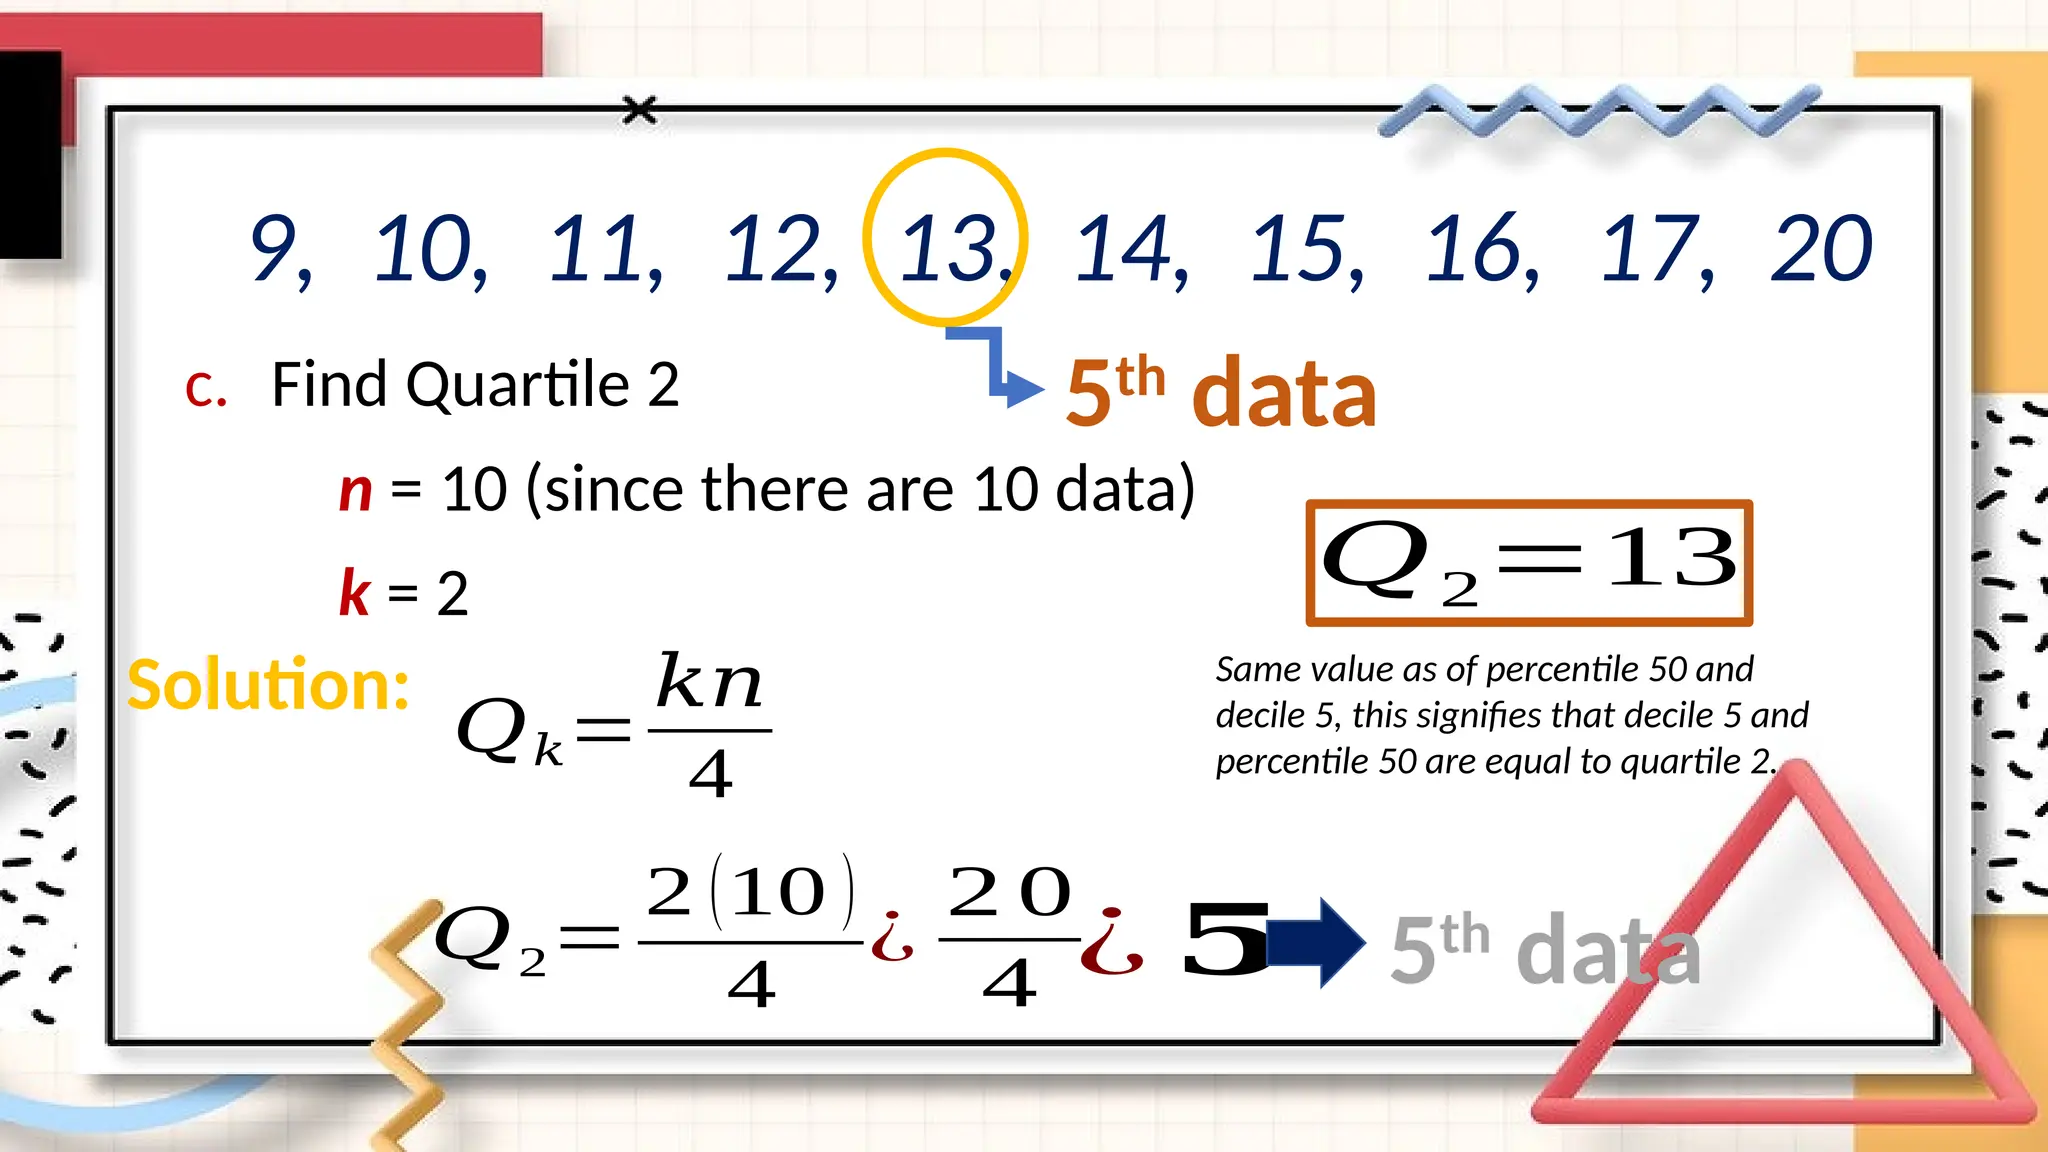
Given the databelow: Scores of selected students of G10 –
Magdalo in a 20-item Mathematics test
12 13 11 10 15
16 14 17 20 9
Find the following:
a. Percentile 50
b. Decile 5
c. Quartile 2
31.
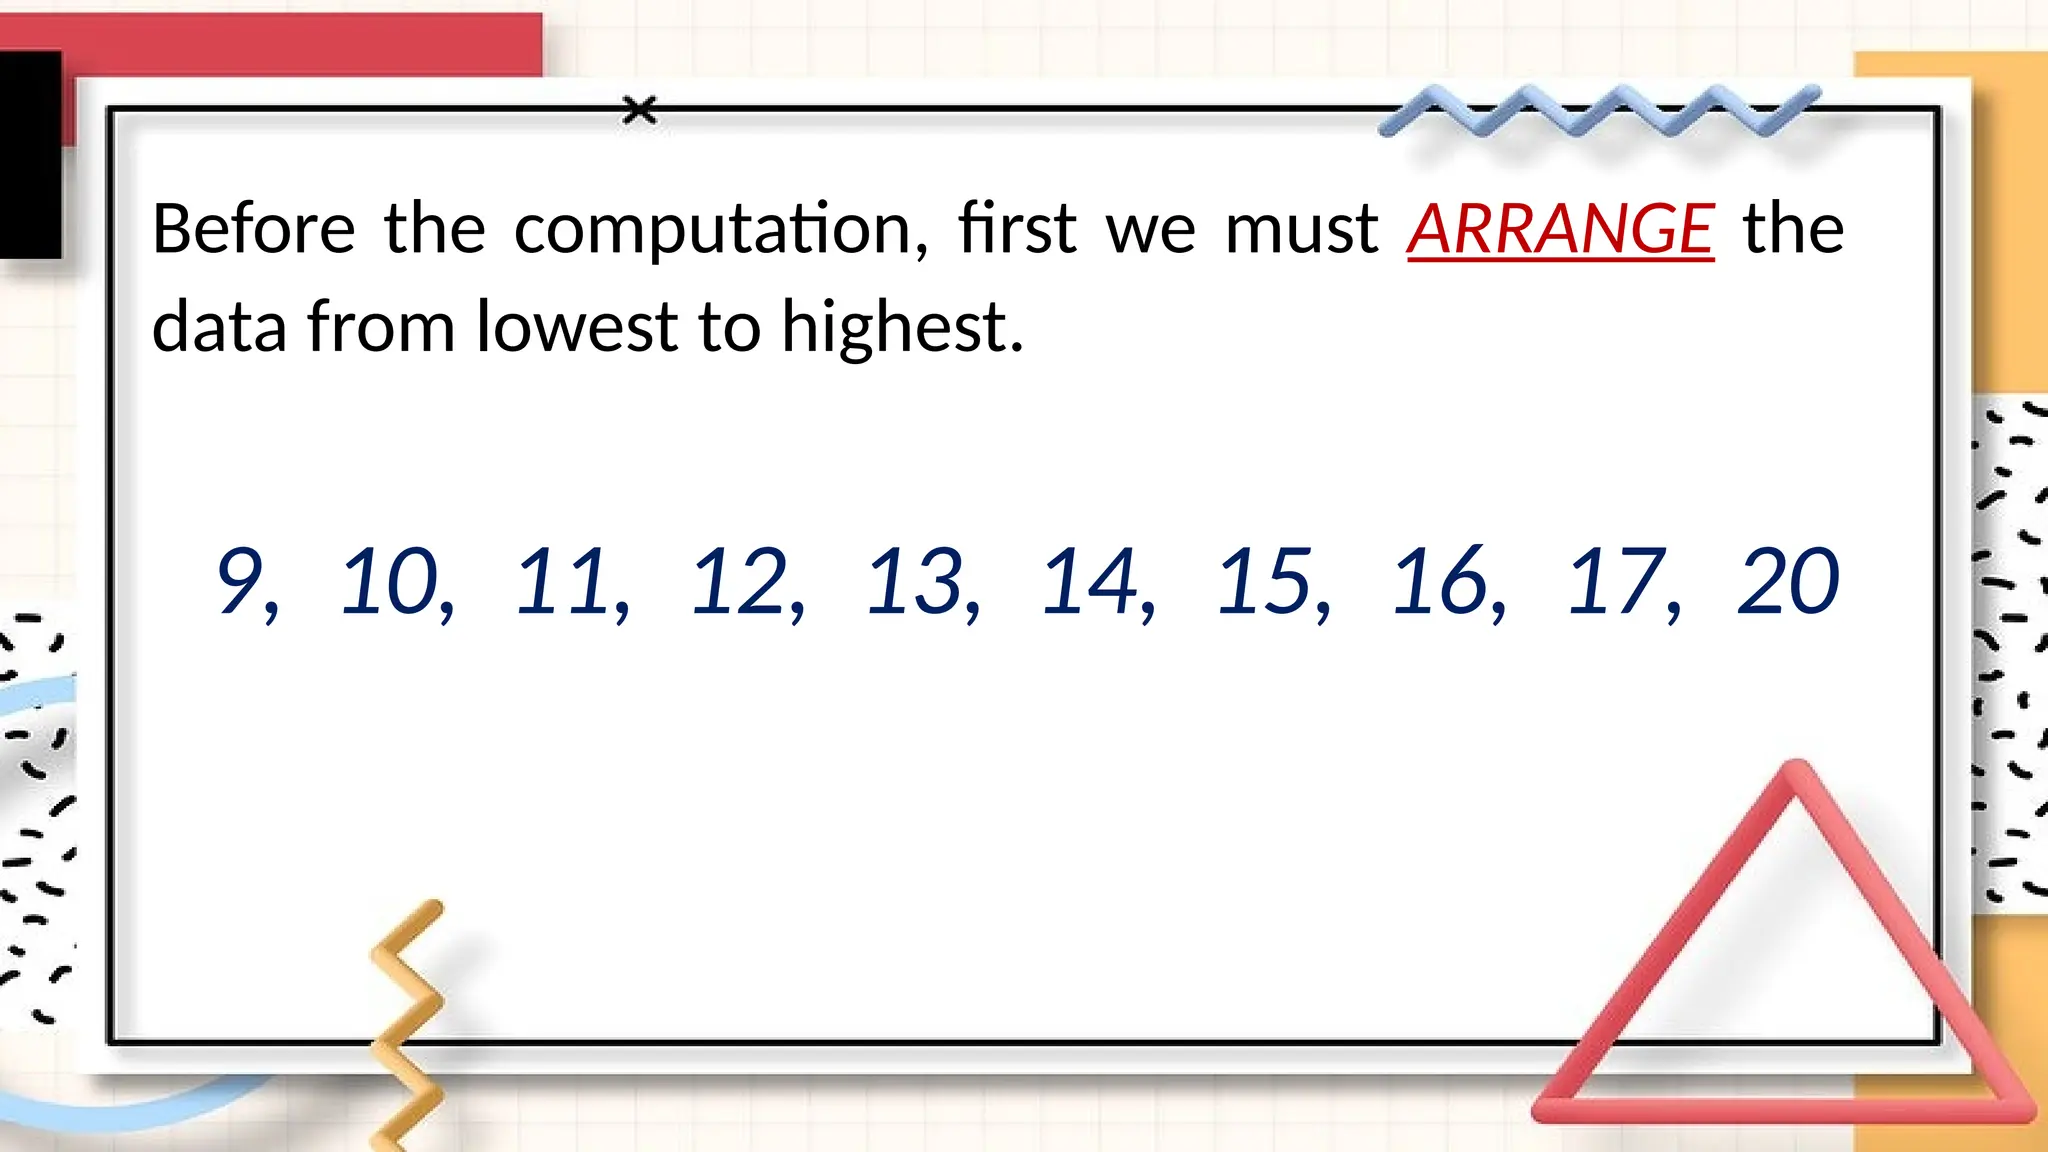
Before the computation,first we must ARRANGE the
data from lowest to highest.
9, 10, 11, 12, 13, 14, 15, 16, 17, 20
32.
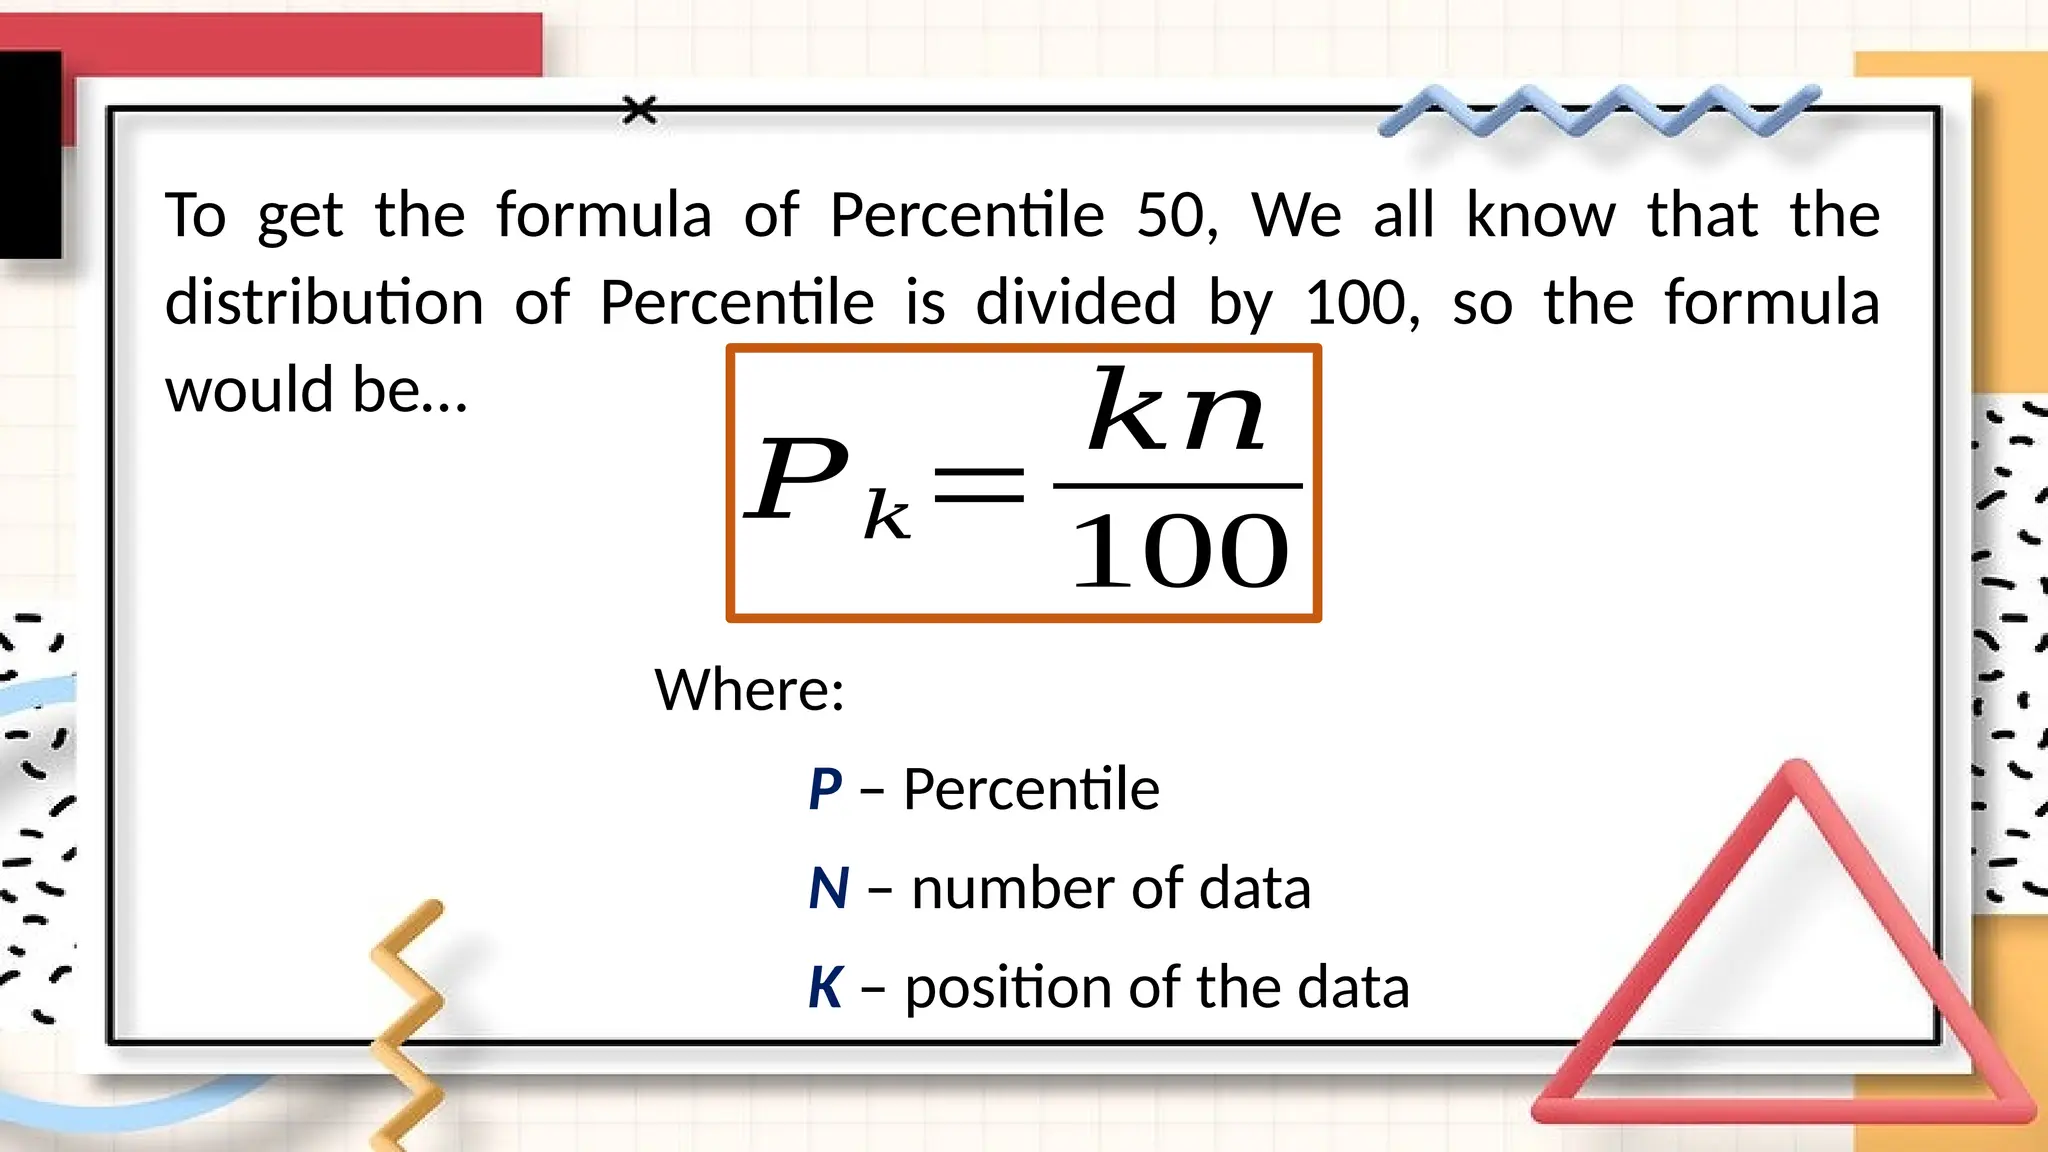
To get theformula of Percentile 50, We all know that the
distribution of Percentile is divided by 100, so the formula
would be…
𝑃𝑘=
𝑘𝑛
100
Where:
P – Percentile
N – number of data
K – position of the data
33.
a. Find thePercentile 50
n = 10 (since there are 10 data)
k = 50
9, 10, 11, 12, 13, 14, 15, 16, 17, 20
𝑃50=
50 (10)
100
Solution:
𝑃𝑘=
𝑘𝑛
100
¿
500
100¿ 𝟓 5th
data
𝑃50=13
5th
data
34.
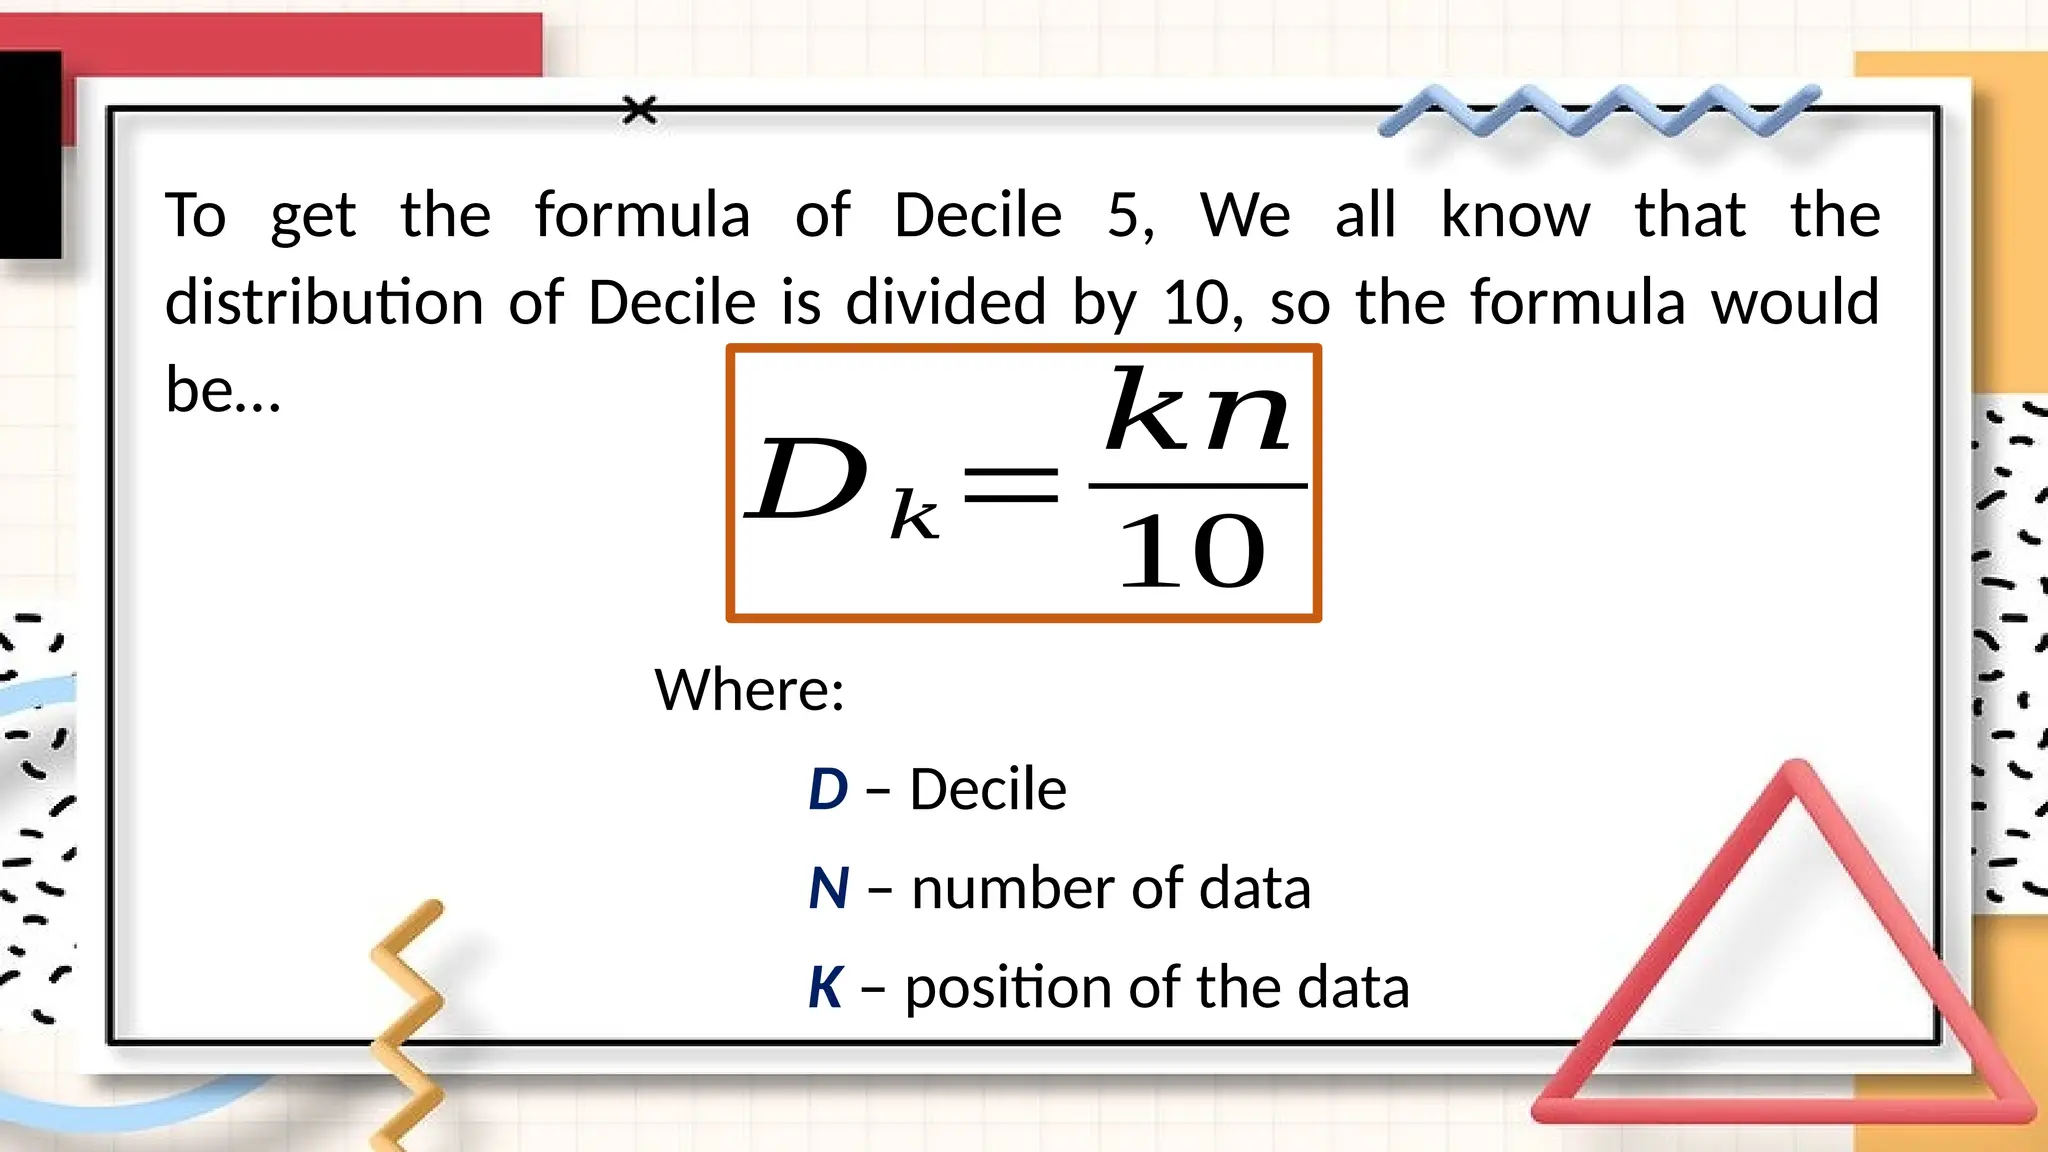
To get theformula of Decile 5, We all know that the
distribution of Decile is divided by 10, so the formula would
be…
𝐷𝑘=
𝑘𝑛
10
Where:
D – Decile
N – number of data
K – position of the data
35.
b. Find Decile5
n = 10 (since there are 10 data)
k = 5
9, 10, 11, 12, 13, 14, 15, 16, 17, 20
𝐷5 =
5 (10 )
10
Solution:
𝐷𝑘=
𝑘𝑛
10
¿
50
10¿ 𝟓 5th
data
𝐷5 =13
5th
data
Same value as of percentile 50, this
signifies that decile 5 and percentile 50
are equal or the same.
36.
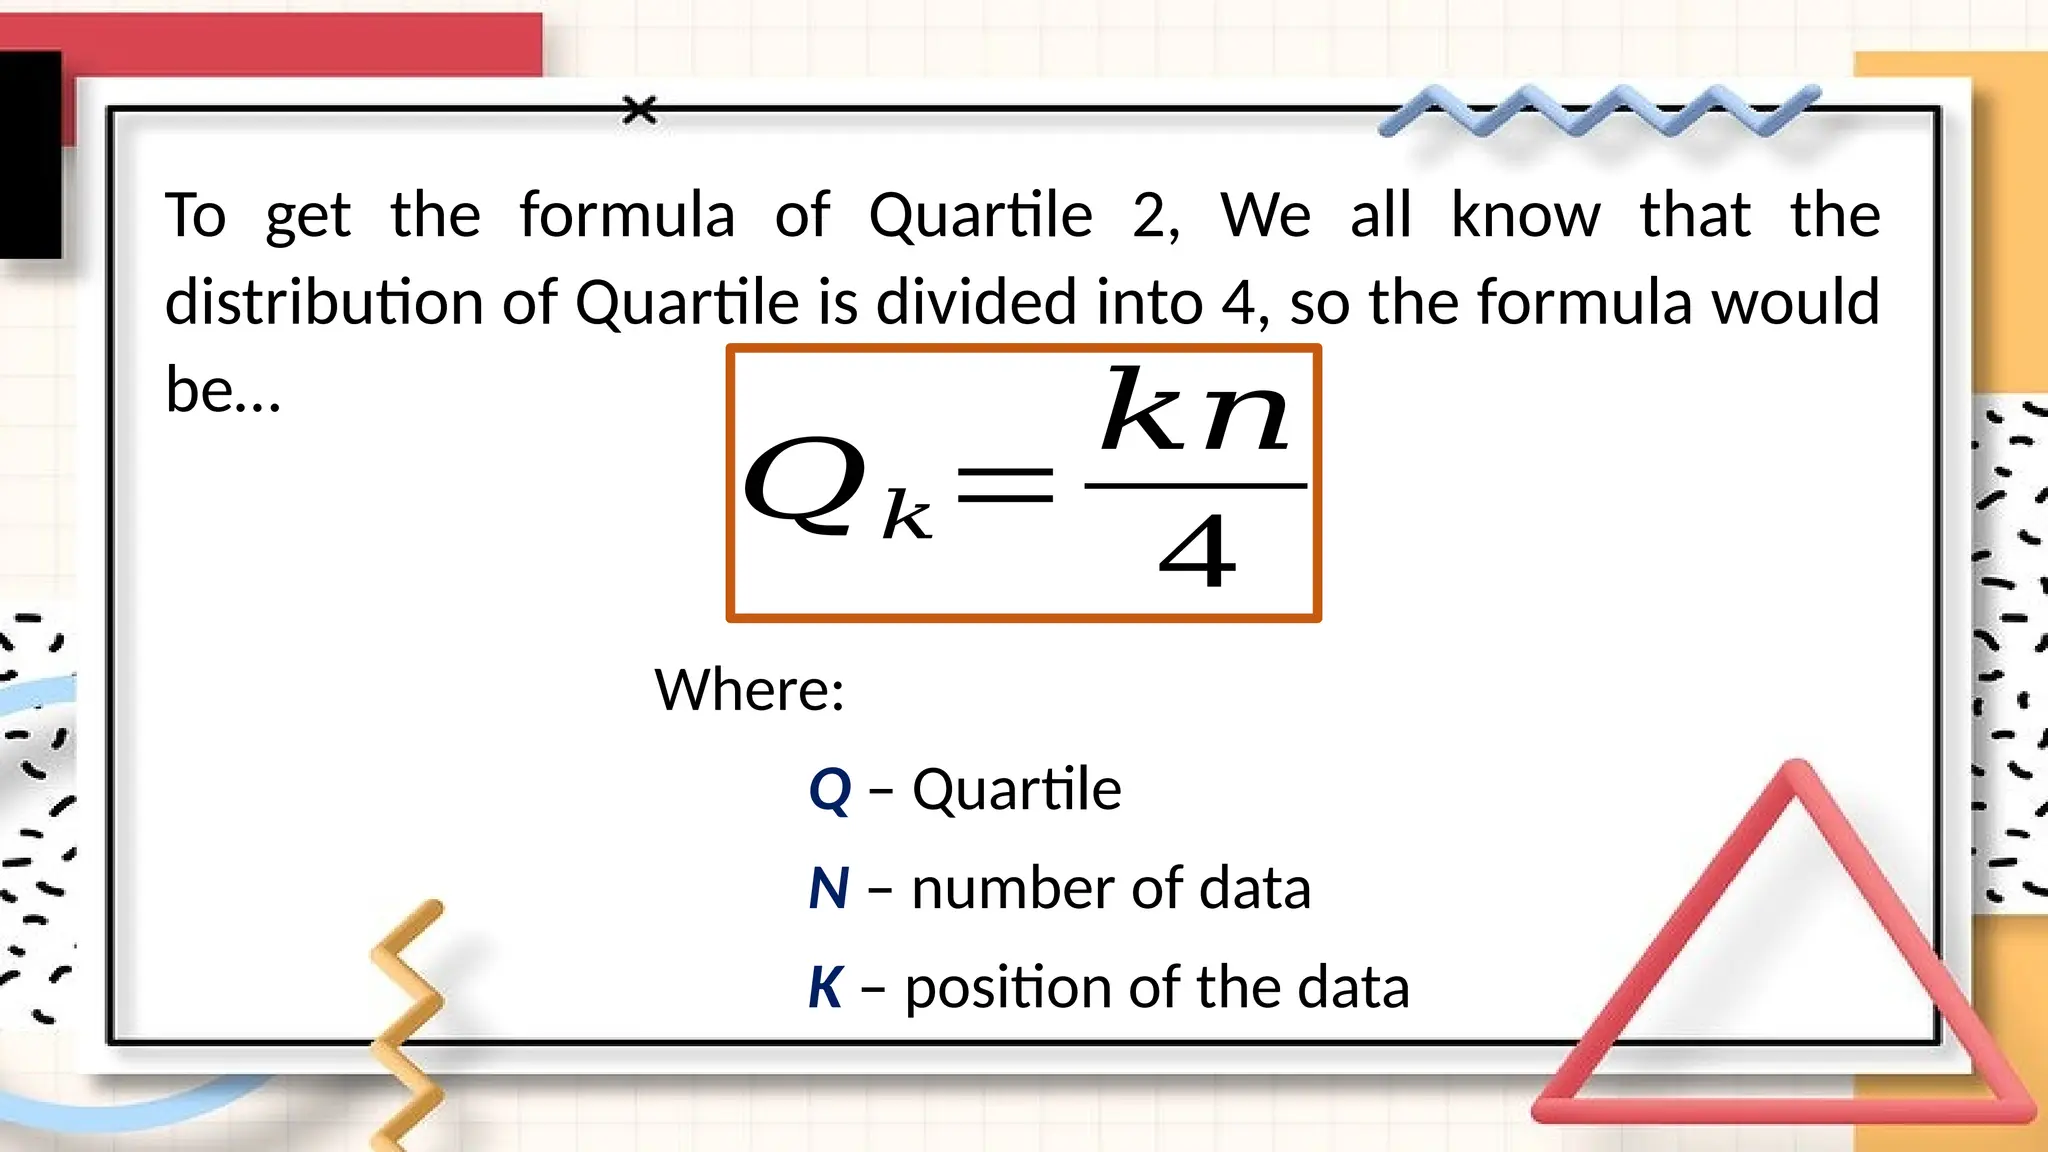
To get theformula of Quartile 2, We all know that the
distribution of Quartile is divided into 4, so the formula would
be…
𝑄𝑘=
𝑘𝑛
4
Where:
Q – Quartile
N – number of data
K – position of the data
37.
c. Find Quartile2
n = 10 (since there are 10 data)
k = 2
9, 10, 11, 12, 13, 14, 15, 16, 17, 20
𝑄2=
2 (10 )
4
Solution:
𝑄𝑘=
𝑘𝑛
4
¿
2 0
4 ¿ 𝟓 5th
data
𝑄2=13
5th
data
Same value as of percentile 50 and
decile 5, this signifies that decile 5 and
percentile 50 are equal to quartile 2.
38.
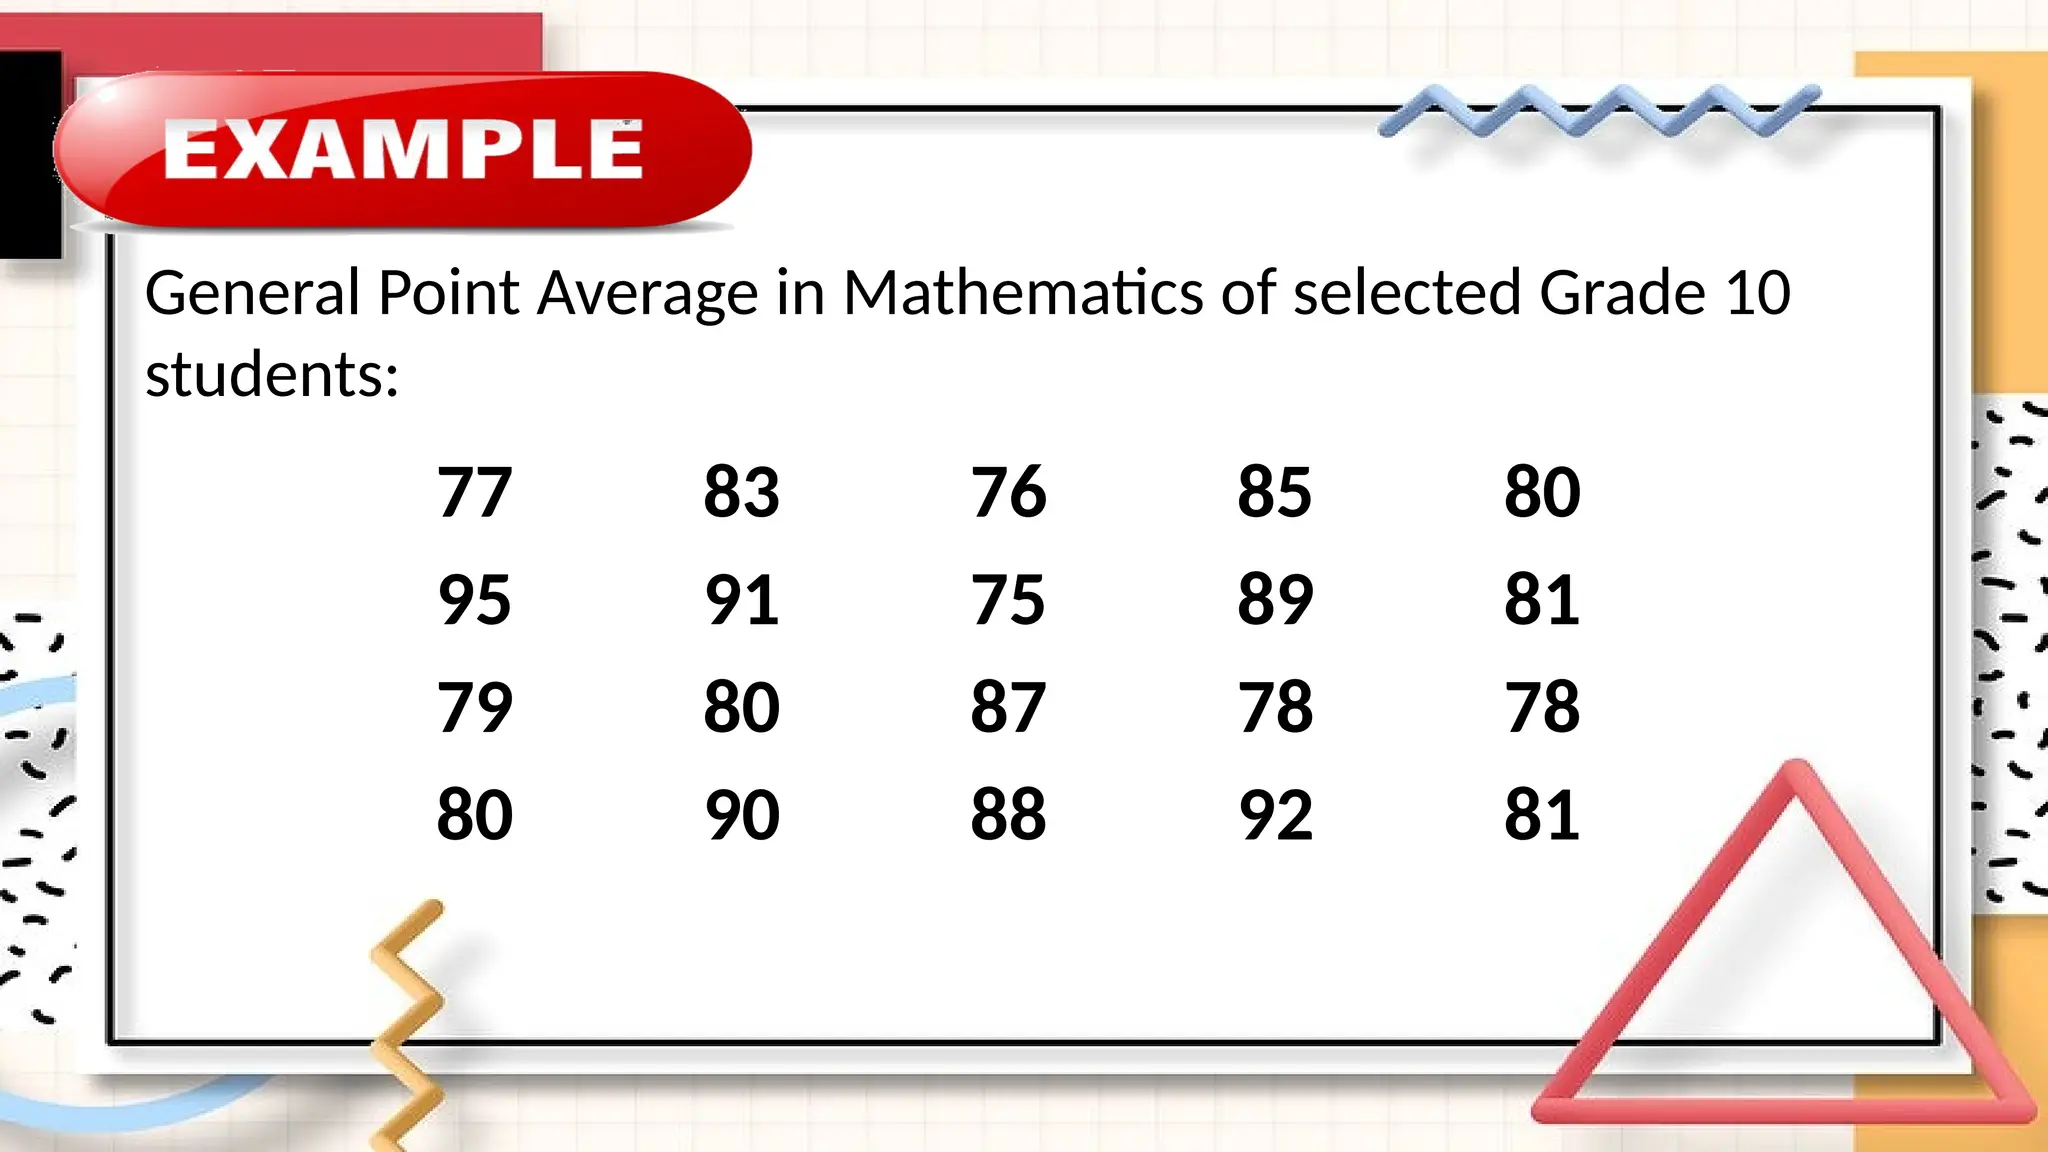
General Point Averagein Mathematics of selected Grade 10
students:
77 83 76 85 80
95 91 75 89 81
79 80 87 78 78
80 90 88 92 81
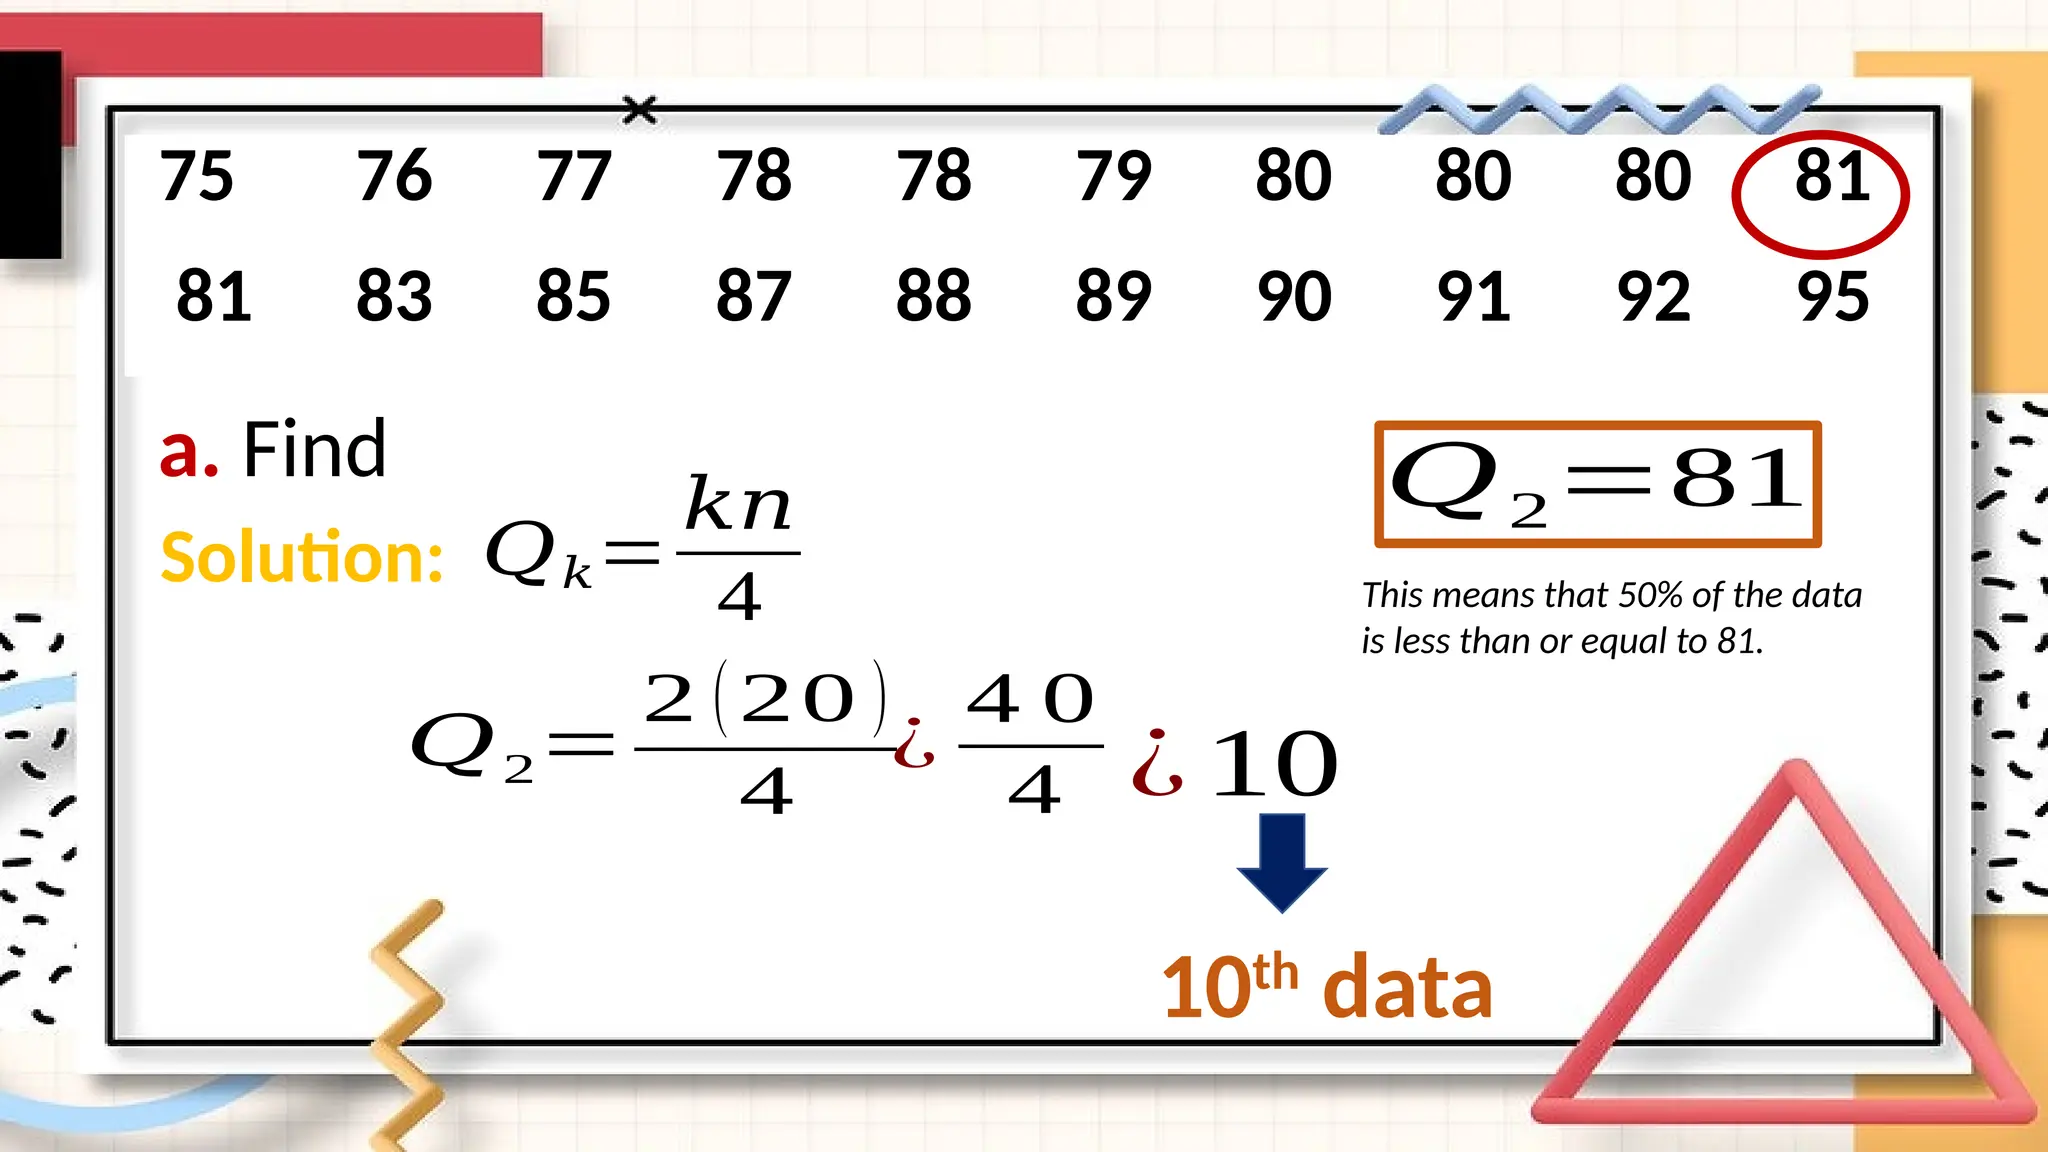
a. Find
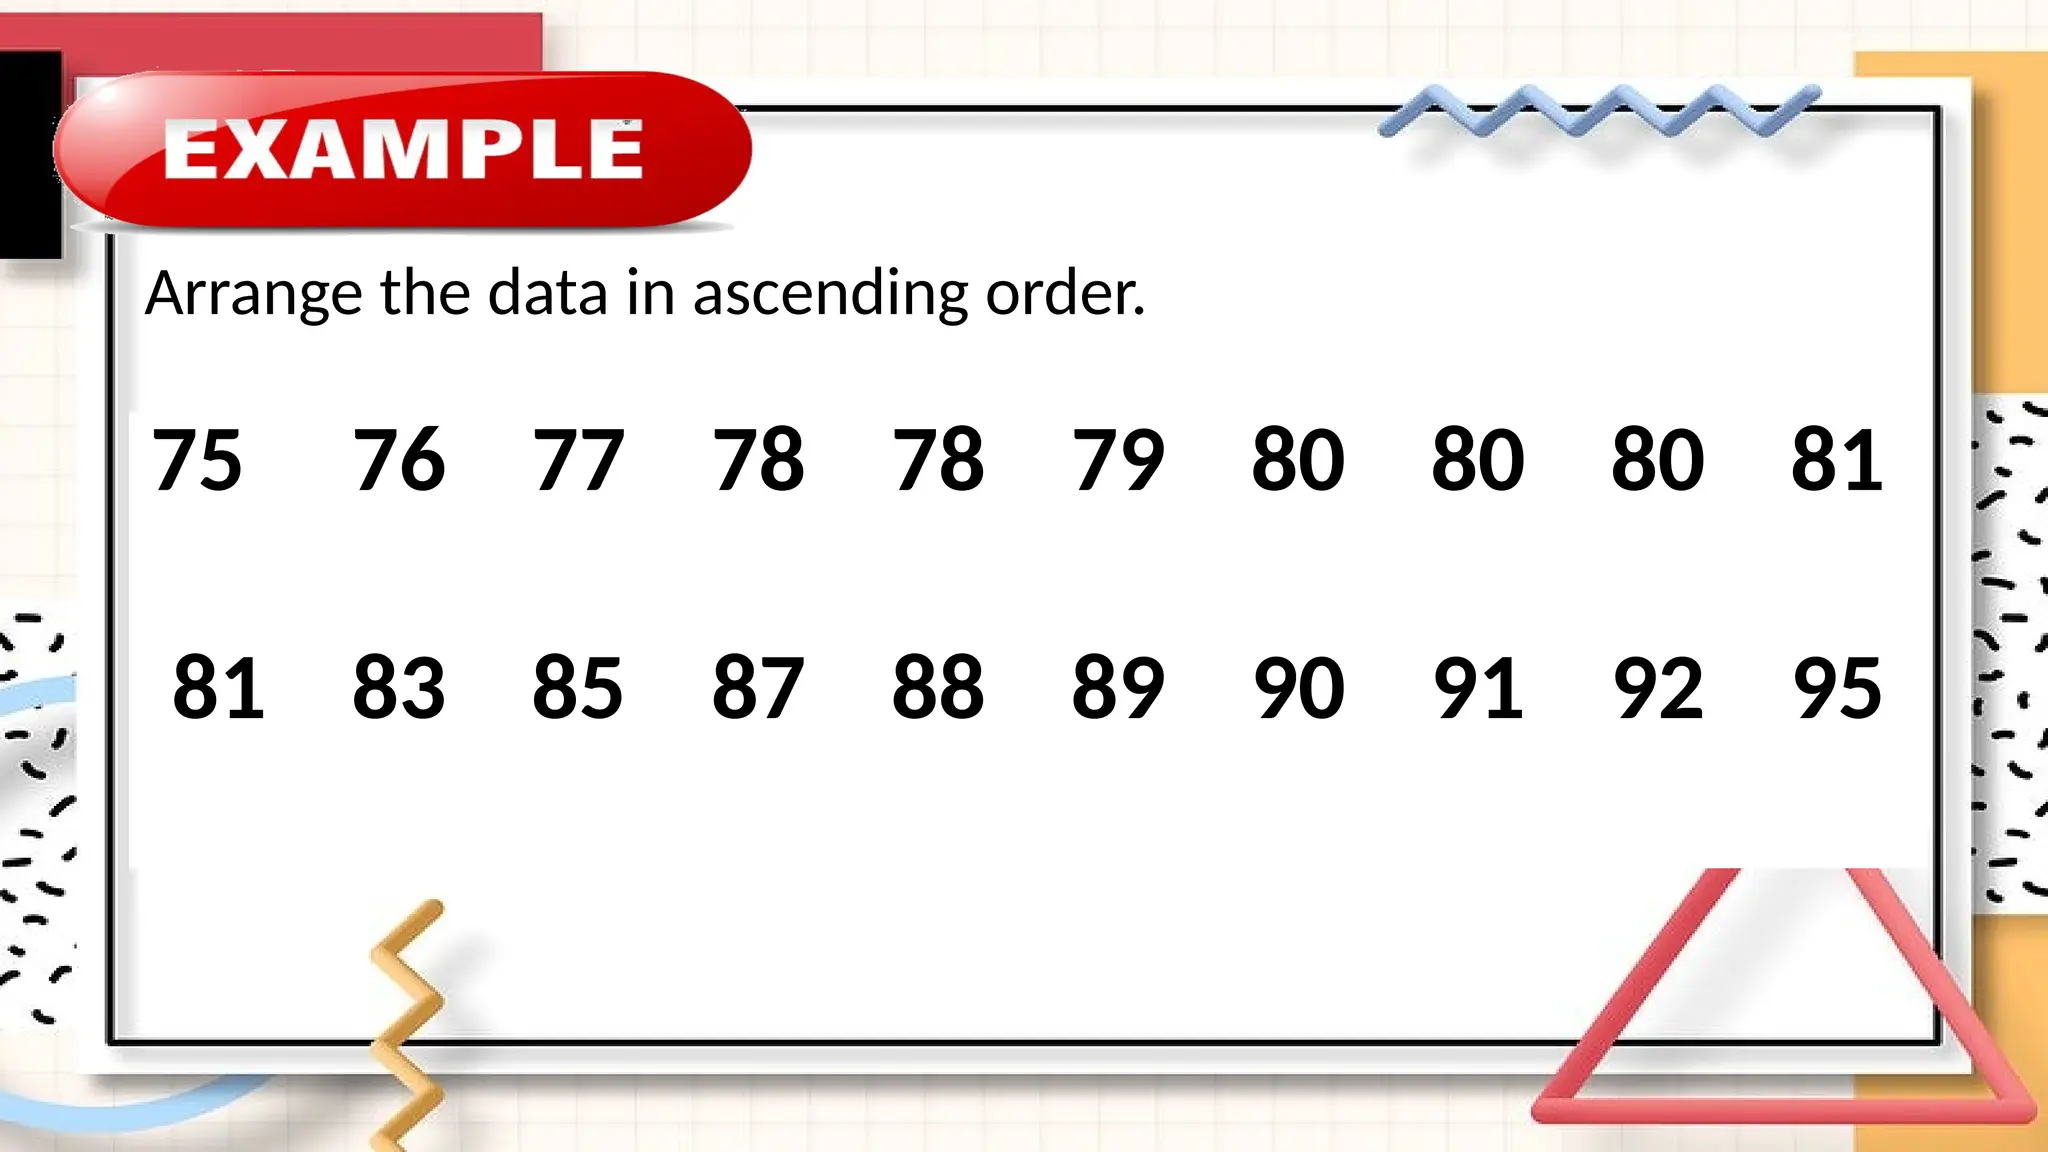
75 7677 78 78 79 80 80 80 81
81 83 85 87 88 89 90 91 92 95
Solution: 𝑄𝑘=
𝑘𝑛
4
𝑄2=
2 (20 )
4
¿
4 0
4 ¿ 10
10th
data
𝑄2=81
This means that 50% of the data
is less than or equal to 81.
41.
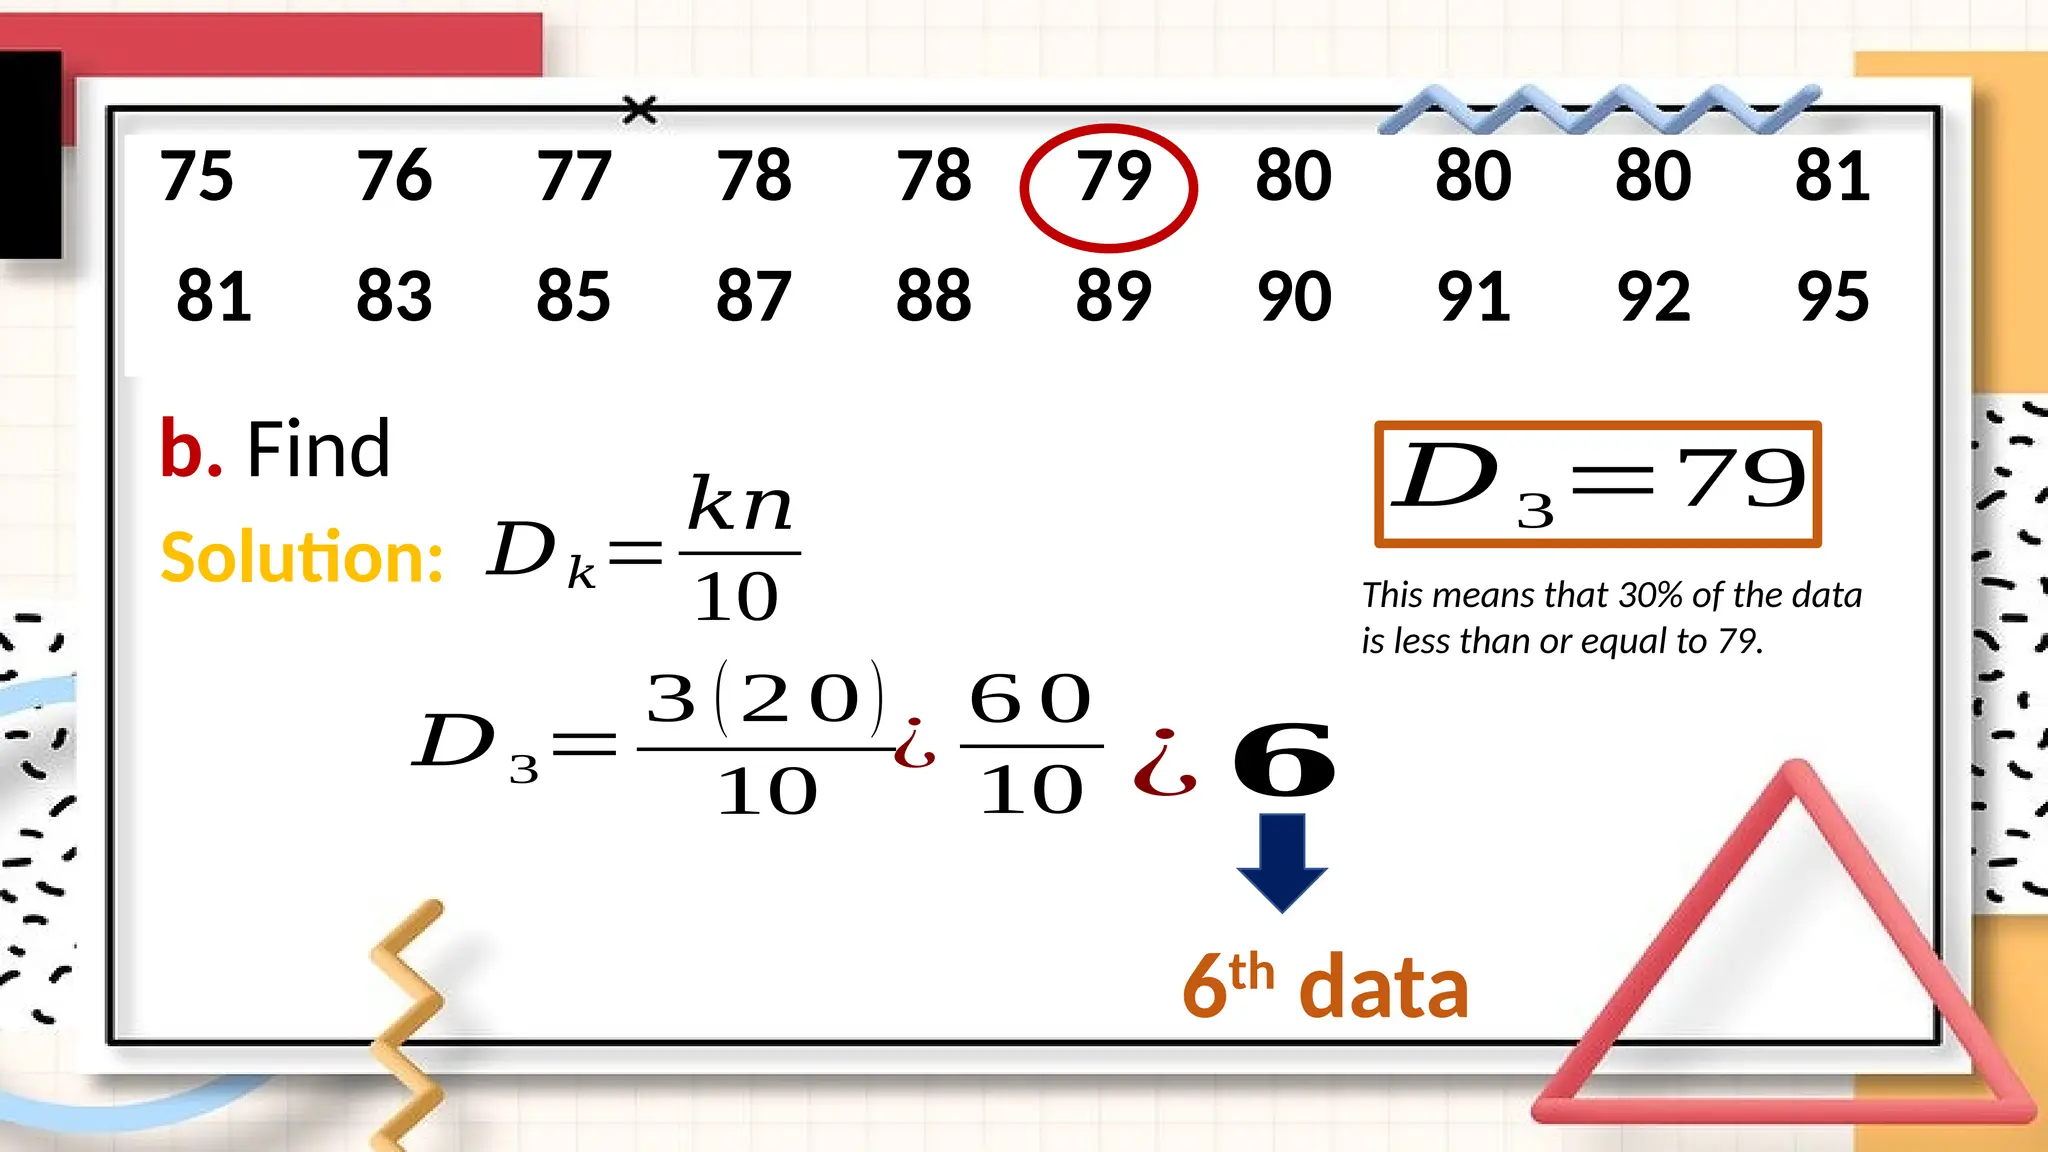
b. Find
75 7677 78 78 79 80 80 80 81
81 83 85 87 88 89 90 91 92 95
Solution: 𝐷𝑘=
𝑘𝑛
10
𝐷3=
3 (2 0)
10
¿
6 0
10 ¿ 𝟔
6th
data
𝐷3=79
This means that 30% of the data
is less than or equal to 79.
42.
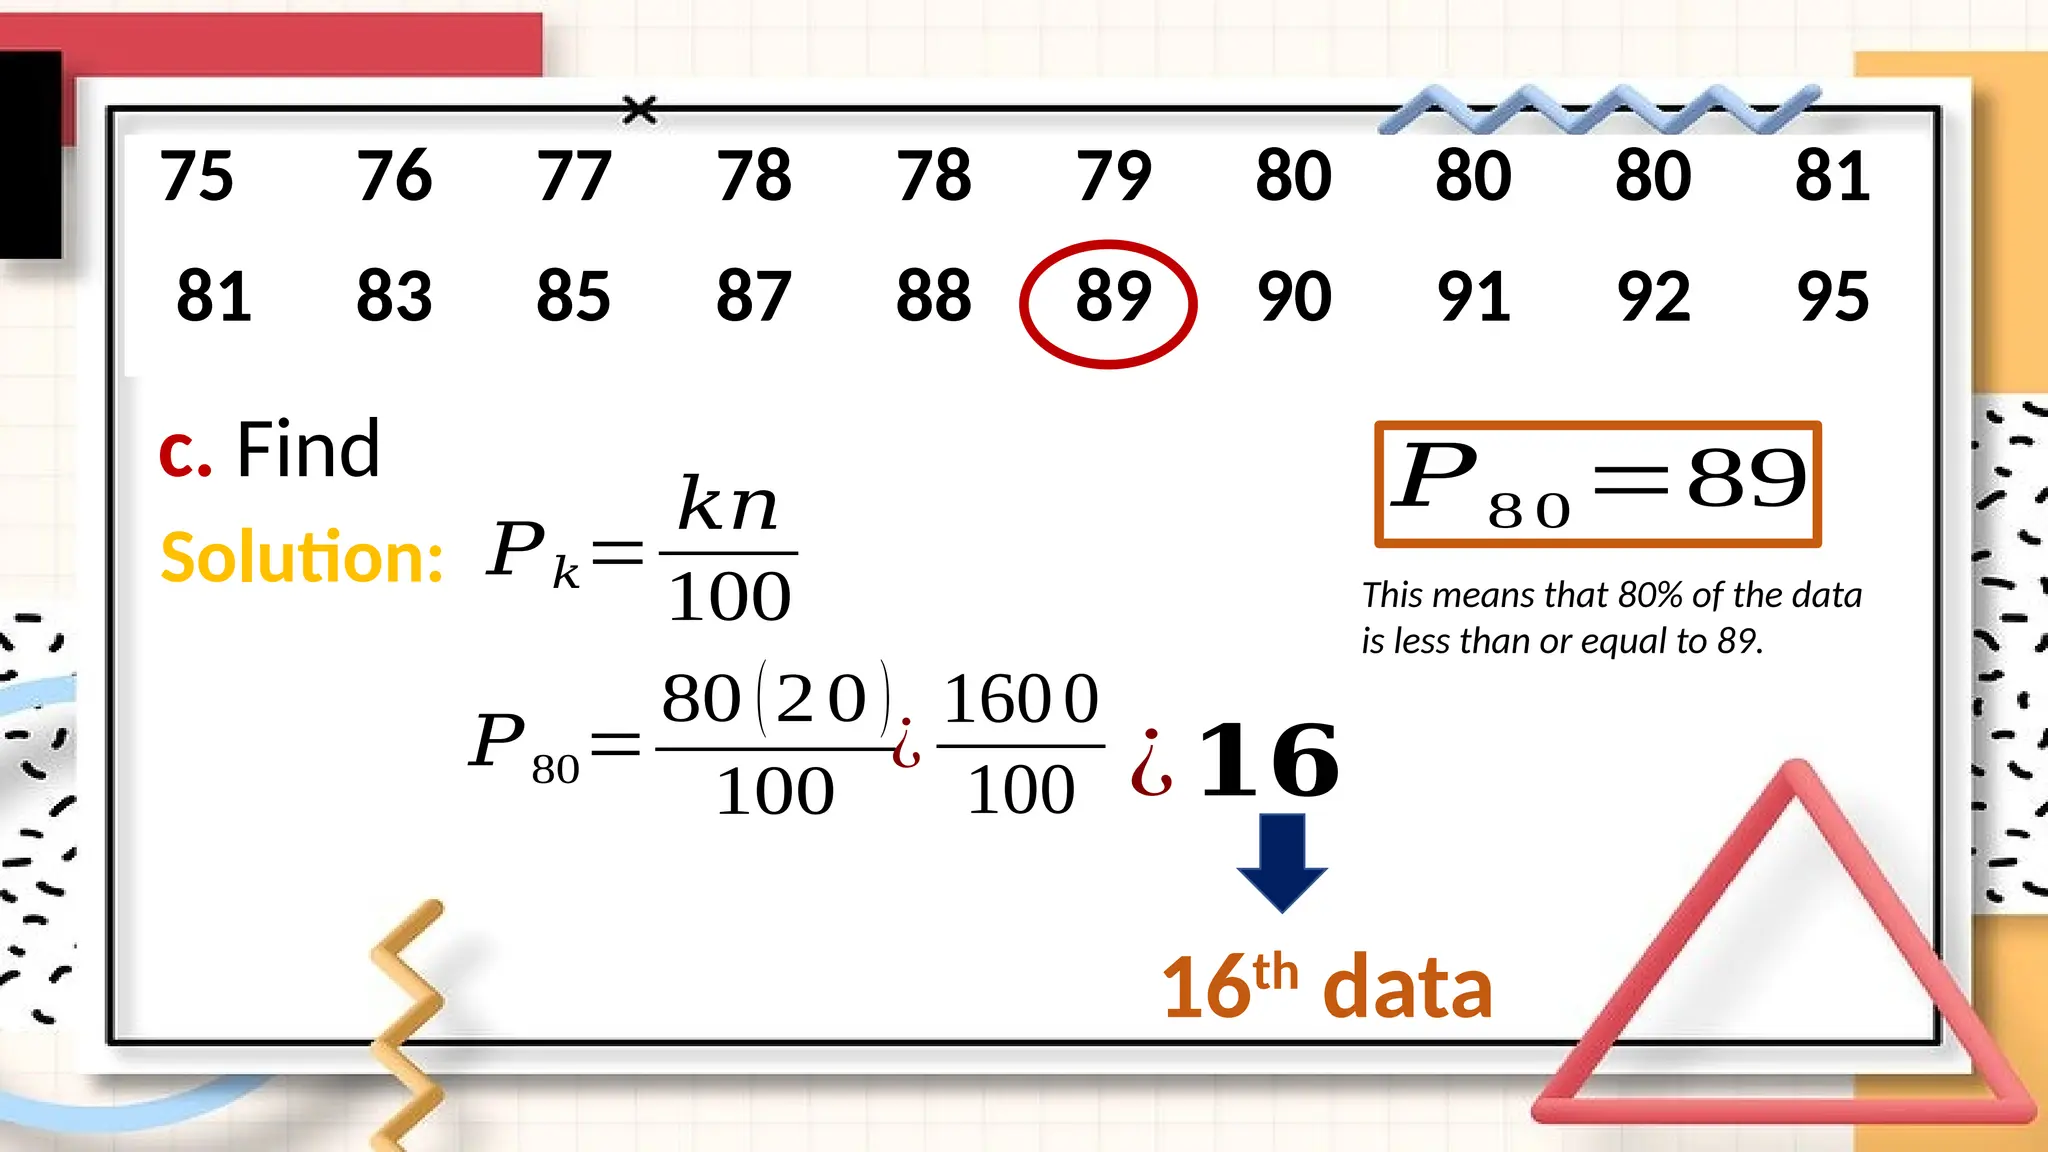
c. Find
75 7677 78 78 79 80 80 80 81
81 83 85 87 88 89 90 91 92 95
Solution: 𝑃𝑘=
𝑘𝑛
100
𝑃80=
80 (20 )
100
¿
1600
100 ¿𝟏𝟔
16th
data
𝑃8 0 =89
This means that 80% of the data
is less than or equal to 89.
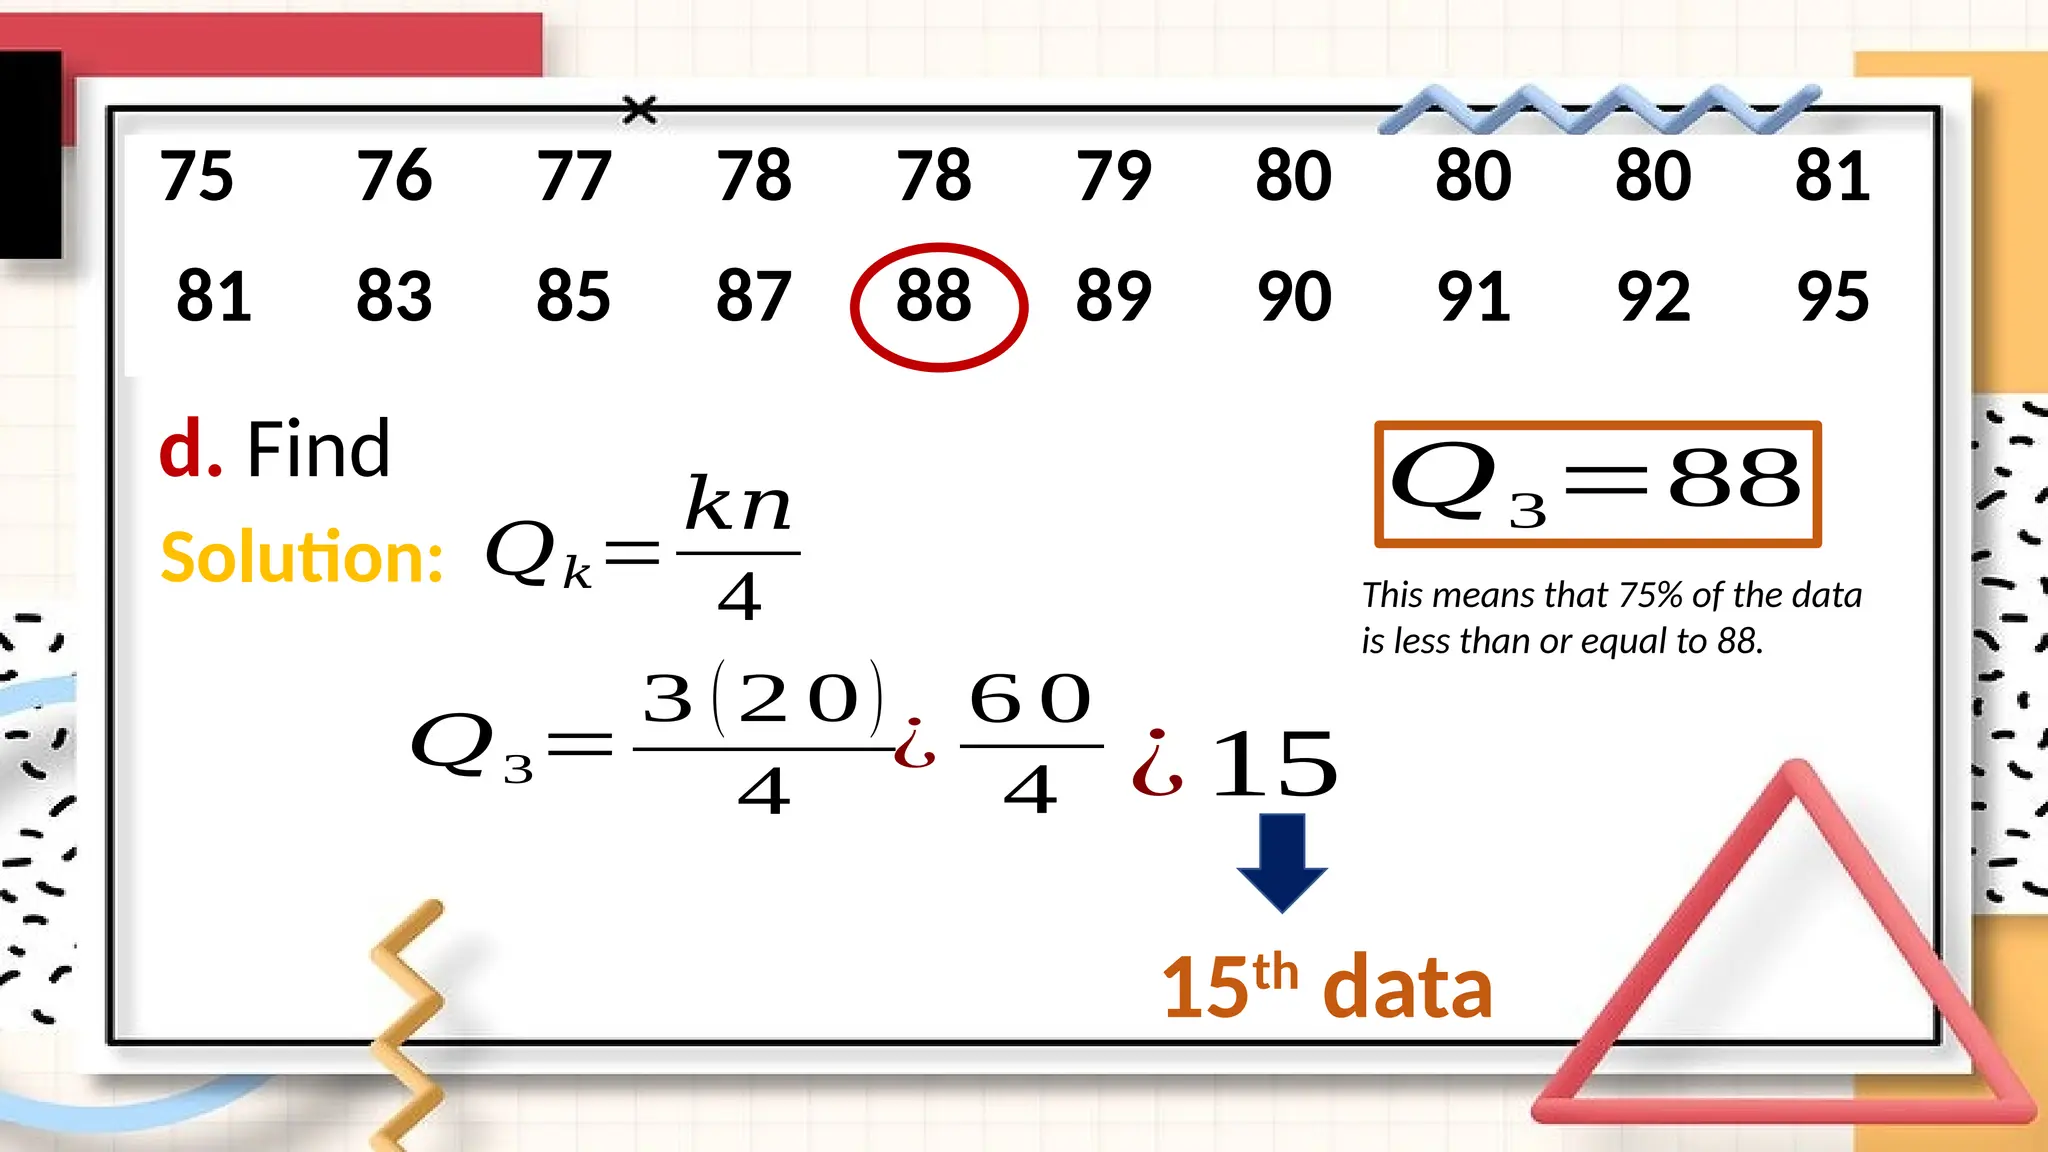
43.
d. Find
75 7677 78 78 79 80 80 80 81
81 83 85 87 88 89 90 91 92 95
Solution: 𝑄𝑘=
𝑘𝑛
4
𝑄3=
3 (2 0)
4
¿
6 0
4 ¿ 15
15th
data
𝑄3=88
This means that 75% of the data
is less than or equal to 88.
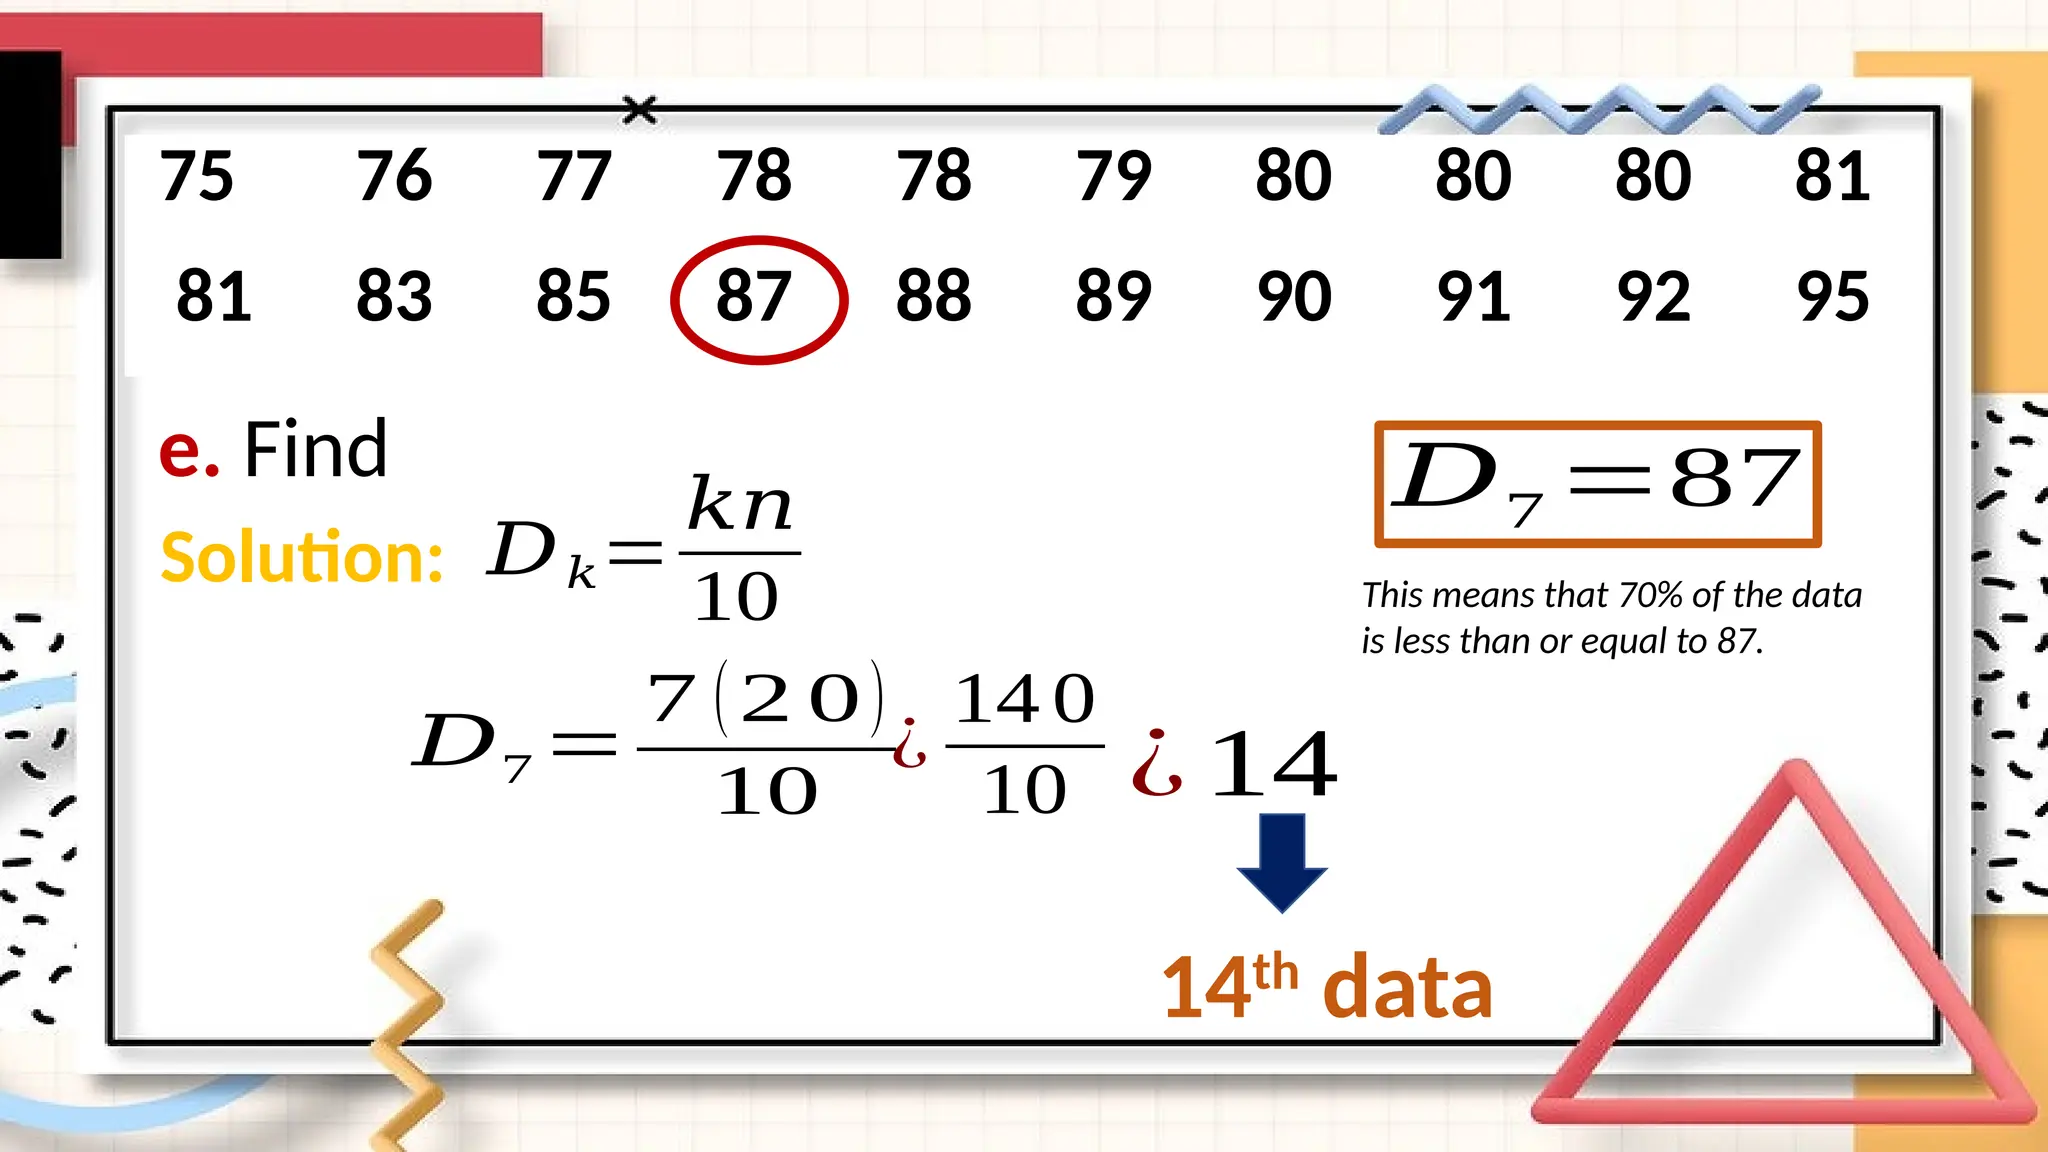
44.
e. Find
75 7677 78 78 79 80 80 80 81
81 83 85 87 88 89 90 91 92 95
Solution: 𝐷𝑘=
𝑘𝑛
10
𝐷7 =
7 (2 0)
10
¿
14 0
10 ¿ 14
14th
data
𝐷7 =87
This means that 70% of the data
is less than or equal to 87.
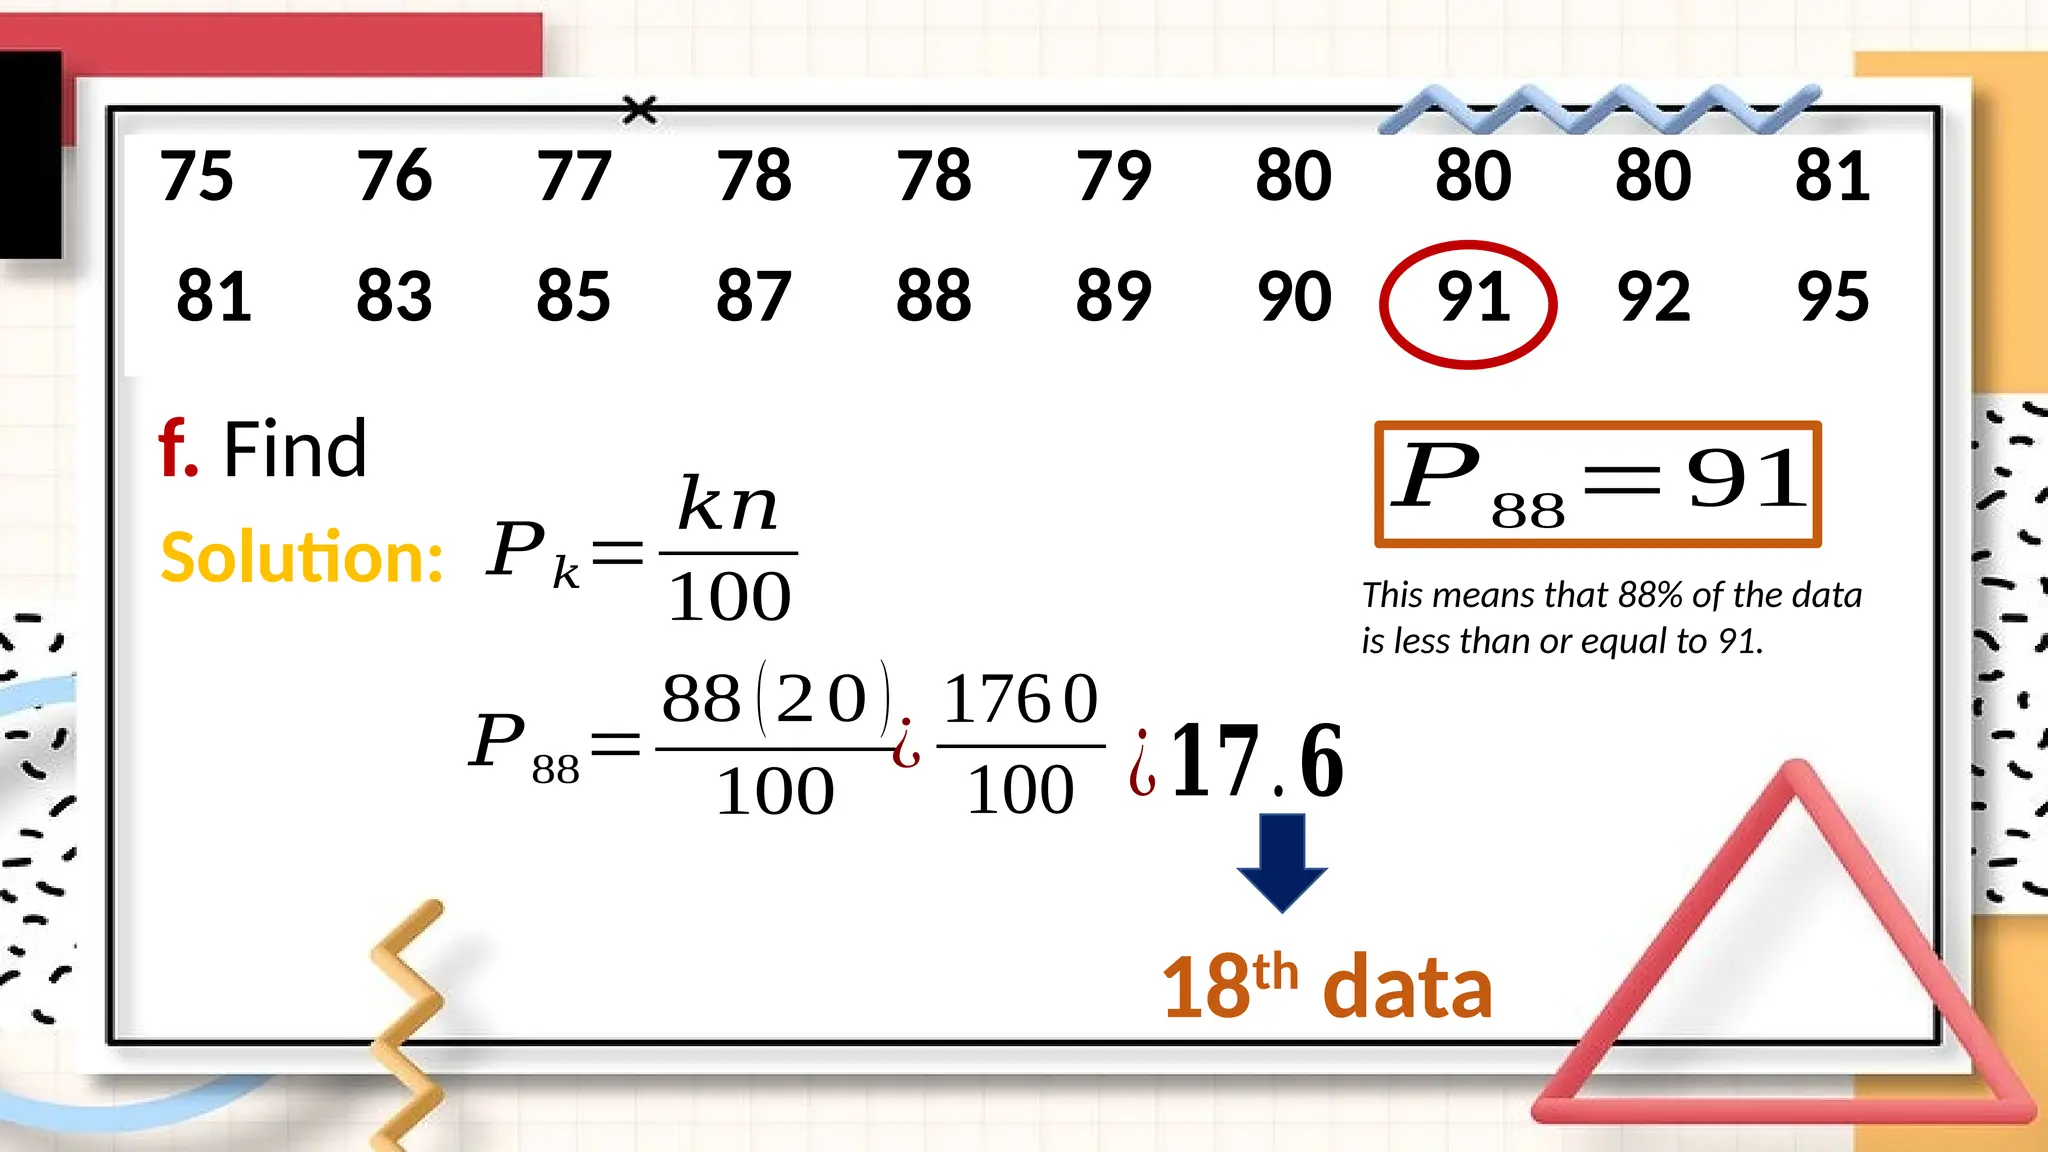
45.
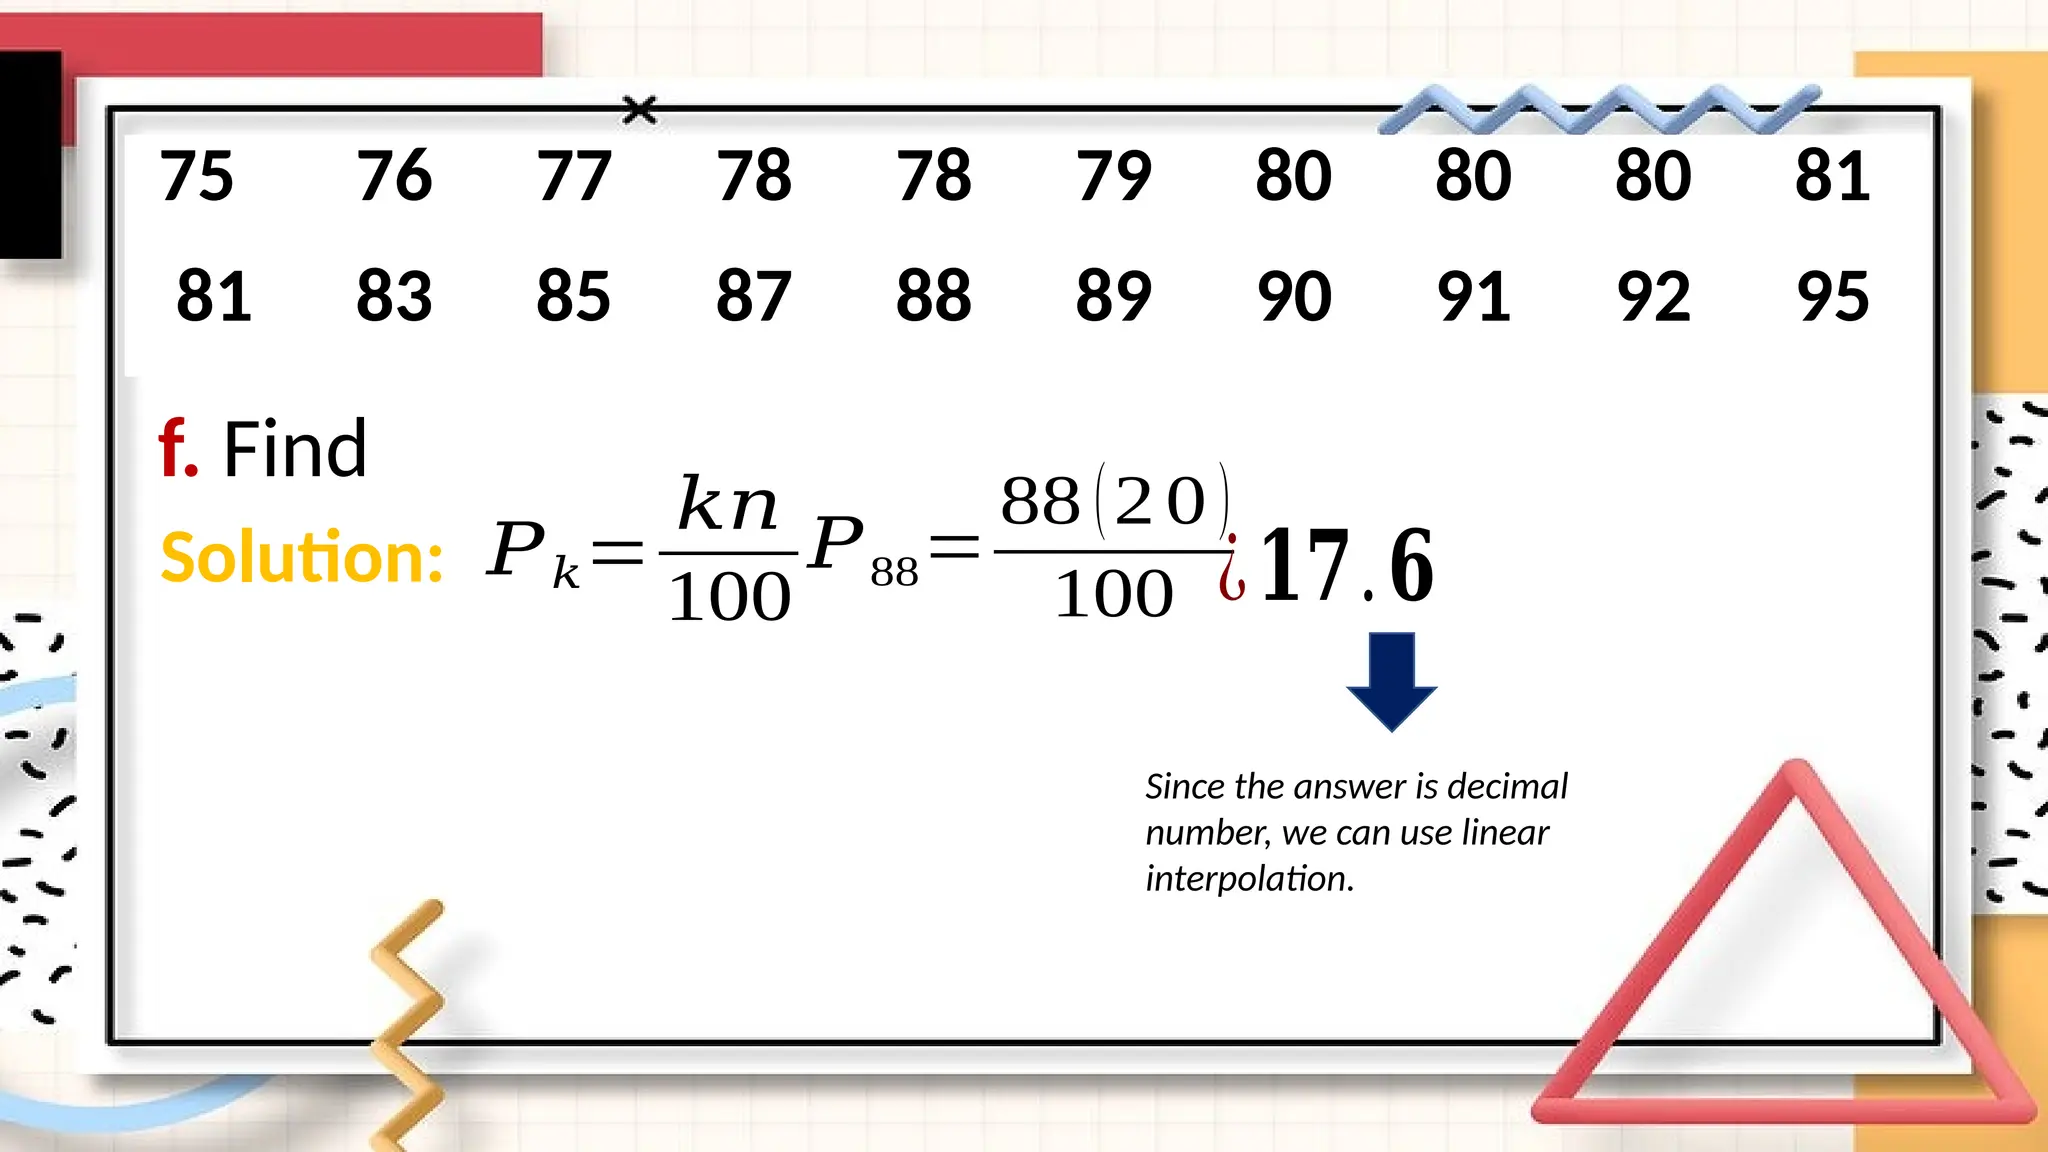
f. Find
75 7677 78 78 79 80 80 80 81
81 83 85 87 88 89 90 91 92 95
Solution: 𝑃𝑘=
𝑘𝑛
100
𝑃88=
88 (20 )
100
¿
1760
100 ¿𝟏𝟕.𝟔
18th
data
𝑃88=91
This means that 88% of the data
is less than or equal to 91.
46.
f. Find
75 7677 78 78 79 80 80 80 81
81 83 85 87 88 89 90 91 92 95
Solution: 𝑃𝑘=
𝑘𝑛
100
𝑃88=
88 (20)
100 ¿𝟏𝟕.𝟔
Since the answer is decimal
number, we can use linear
interpolation.
47.
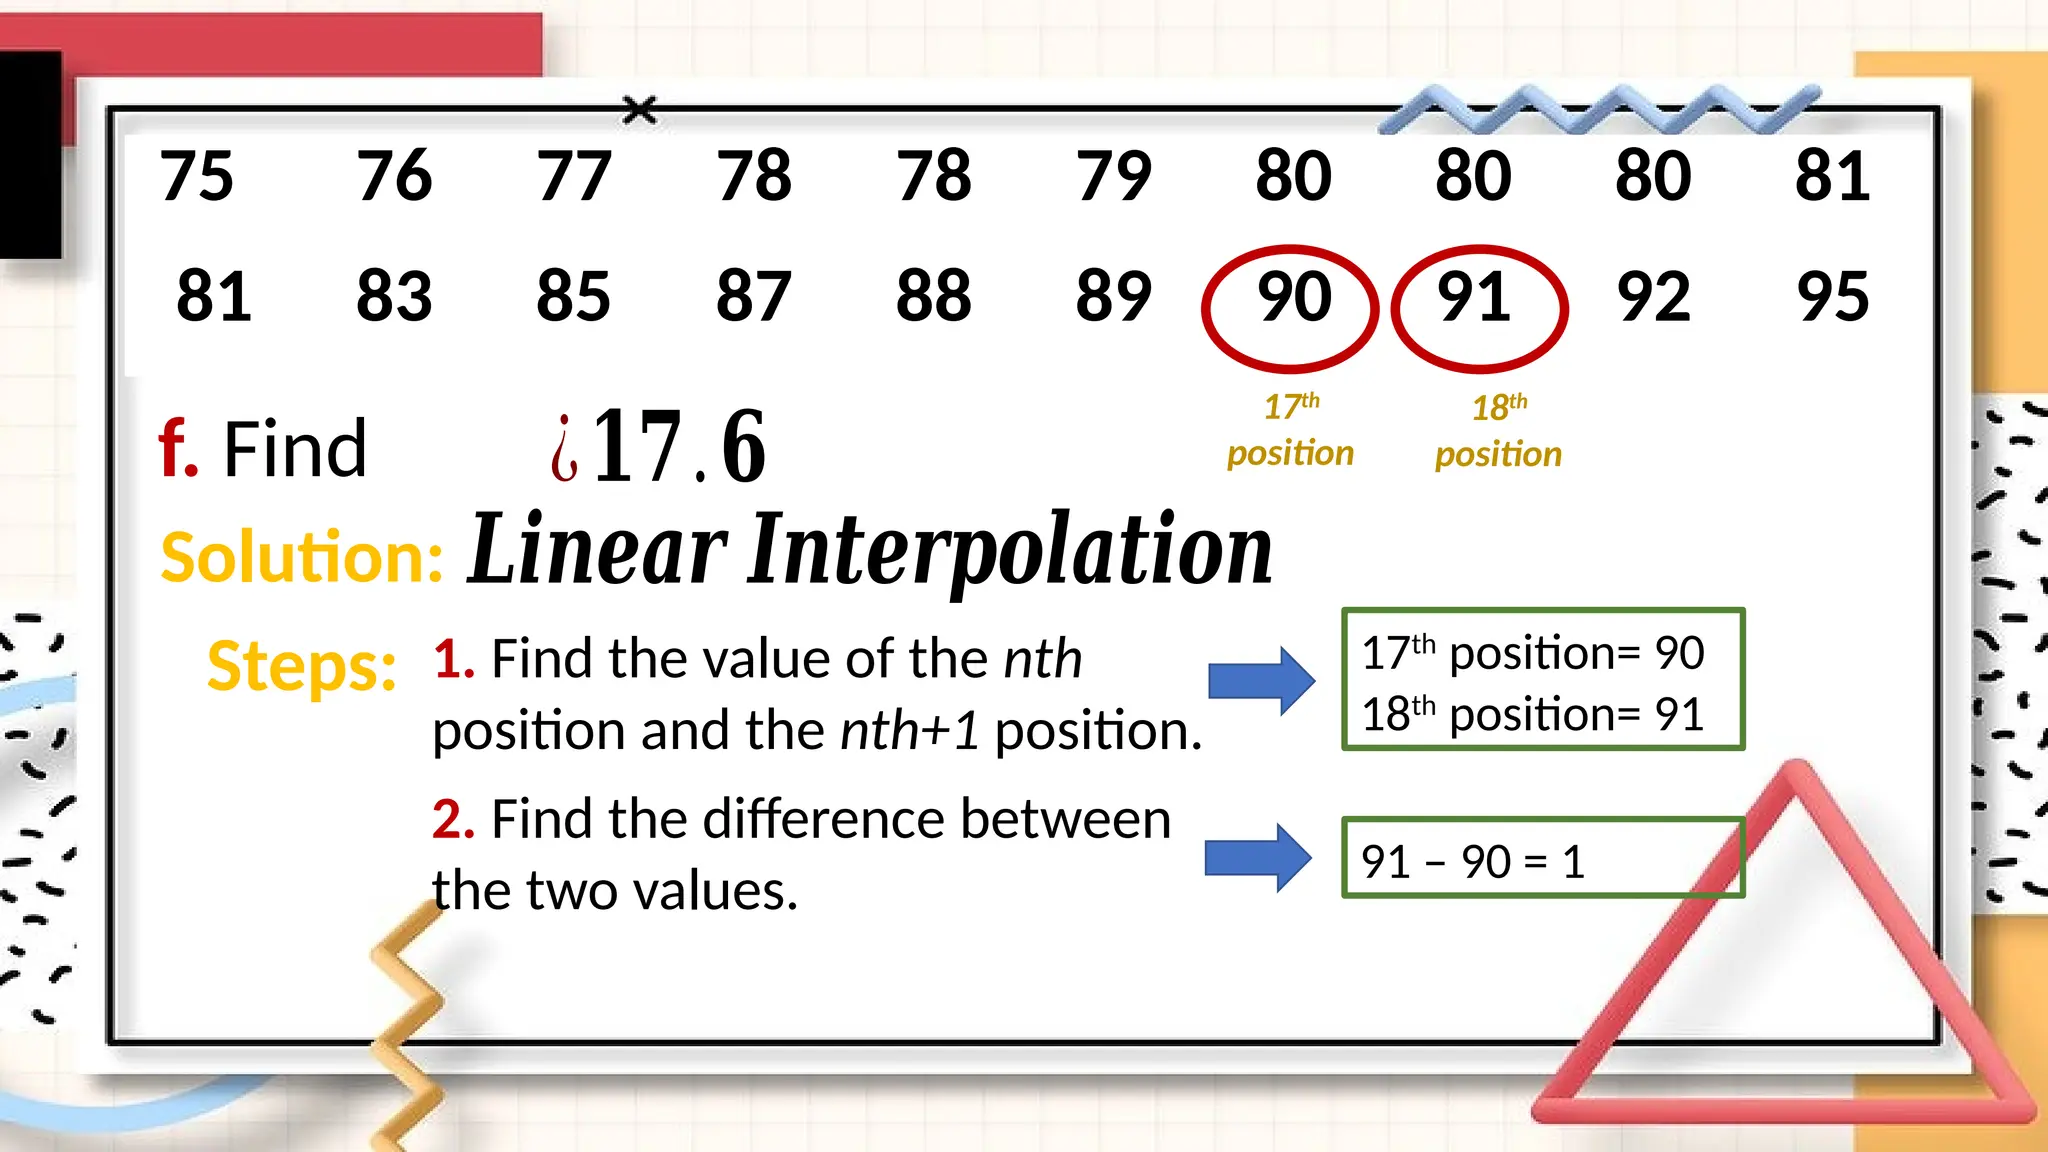
f. Find
75 7677 78 78 79 80 80 80 81
81 83 85 87 88 89 90 91 92 95
Solution:
¿𝟏𝟕.𝟔
𝑳𝒊𝒏𝒆𝒂𝒓 𝑰𝒏𝒕𝒆𝒓𝒑𝒐𝒍𝒂𝒕𝒊𝒐𝒏
Steps: 1. Find the value of the nth
position and the nth+1 position.
17th
position
18th
position
2. Find the difference between
the two values.
17th
position= 90
18th
position= 91
91 – 90 = 1
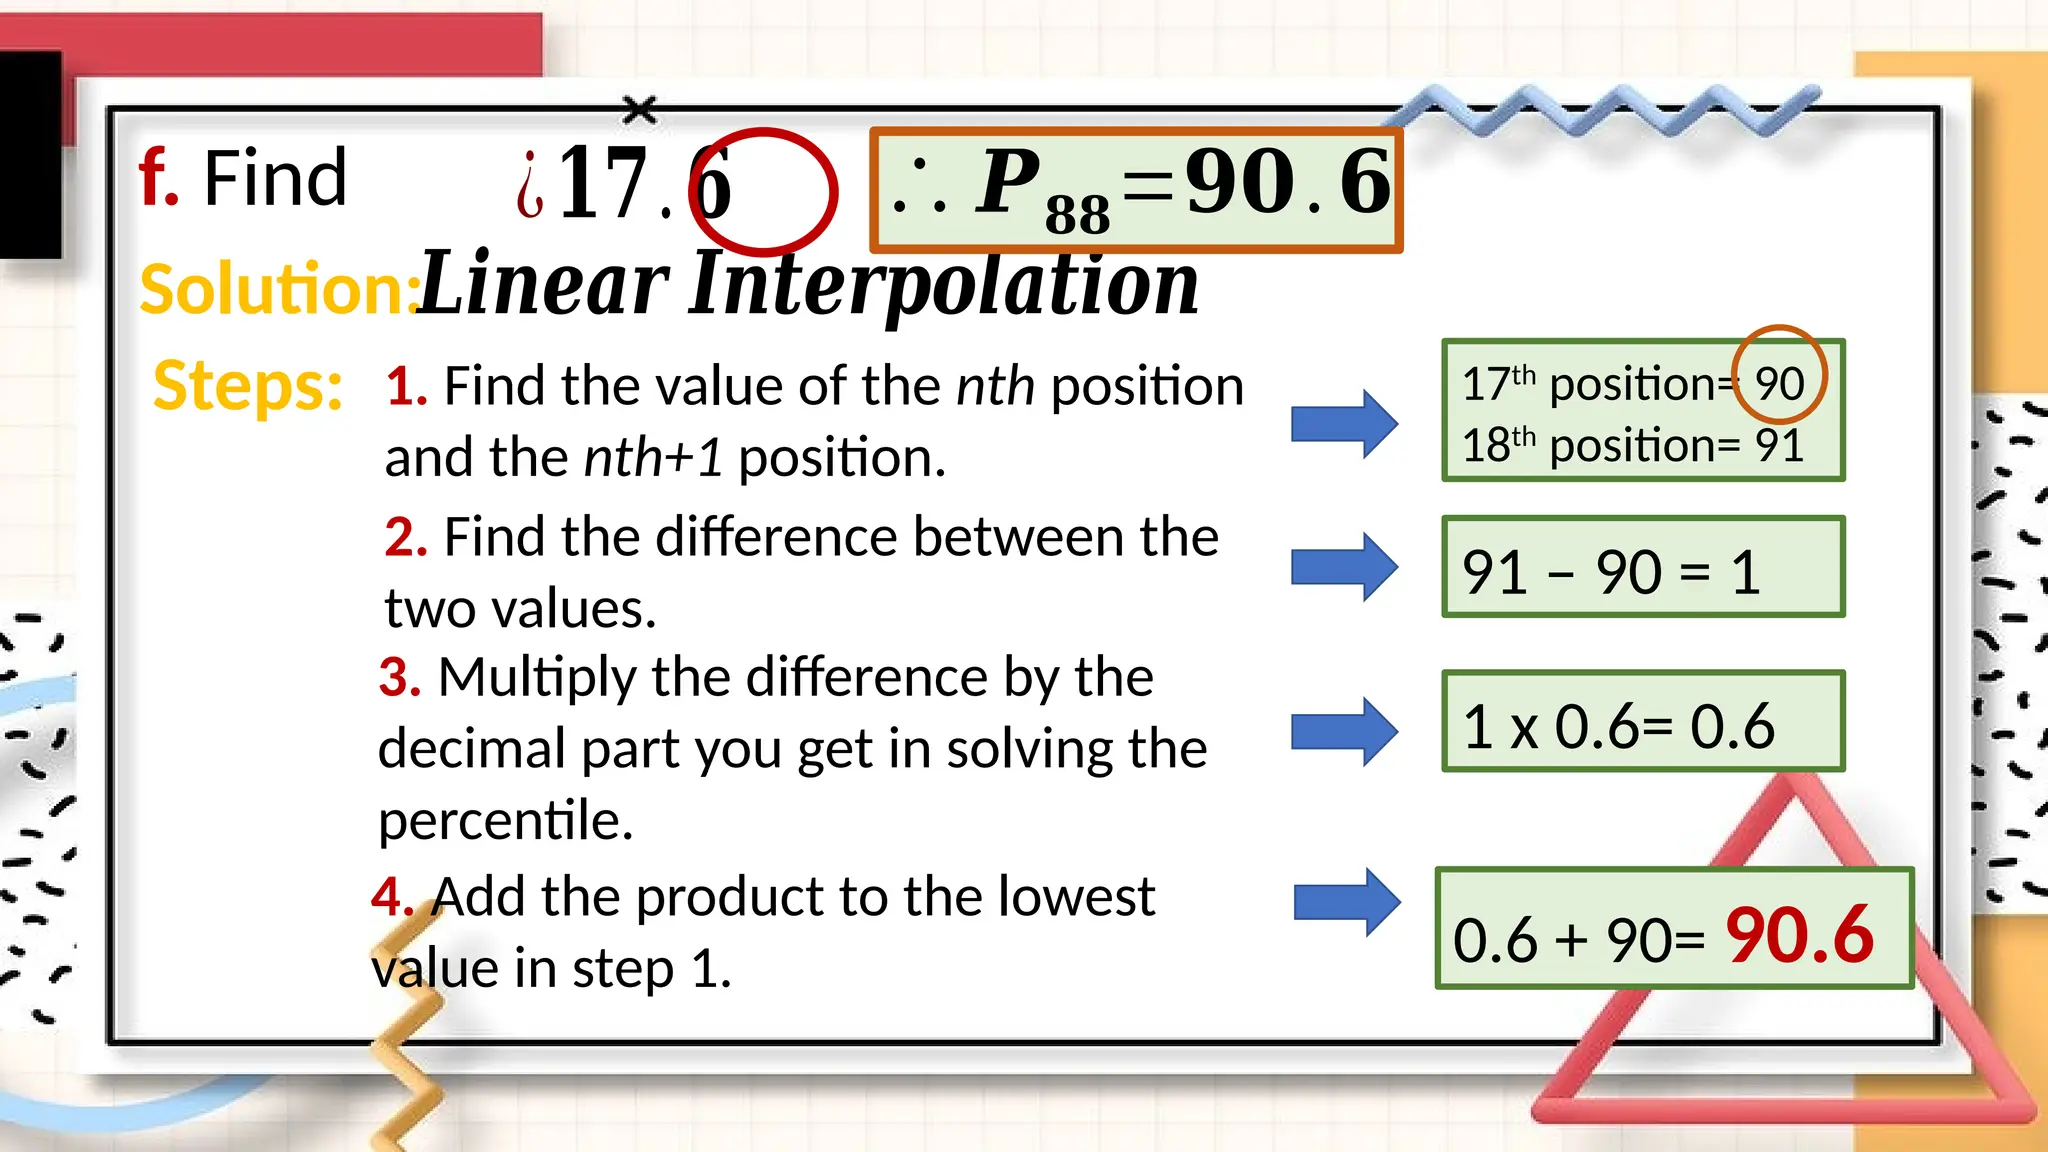
48.
Solution:𝑳𝒊𝒏𝒆𝒂𝒓 𝑰𝒏𝒕𝒆𝒓𝒑𝒐𝒍𝒂𝒕𝒊𝒐𝒏
Steps: 1.Find the value of the nth position
and the nth+1 position.
2. Find the difference between the
two values.
17th
position= 90
18th
position= 91
91 – 90 = 1
3. Multiply the difference by the
decimal part you get in solving the
percentile.
f. Find ¿𝟏𝟕.𝟔
1 x 0.6= 0.6
4. Add the product to the lowest
value in step 1. 0.6 + 90= 90.6
∴ 𝑷𝟖𝟖=𝟗𝟎.𝟔
49.
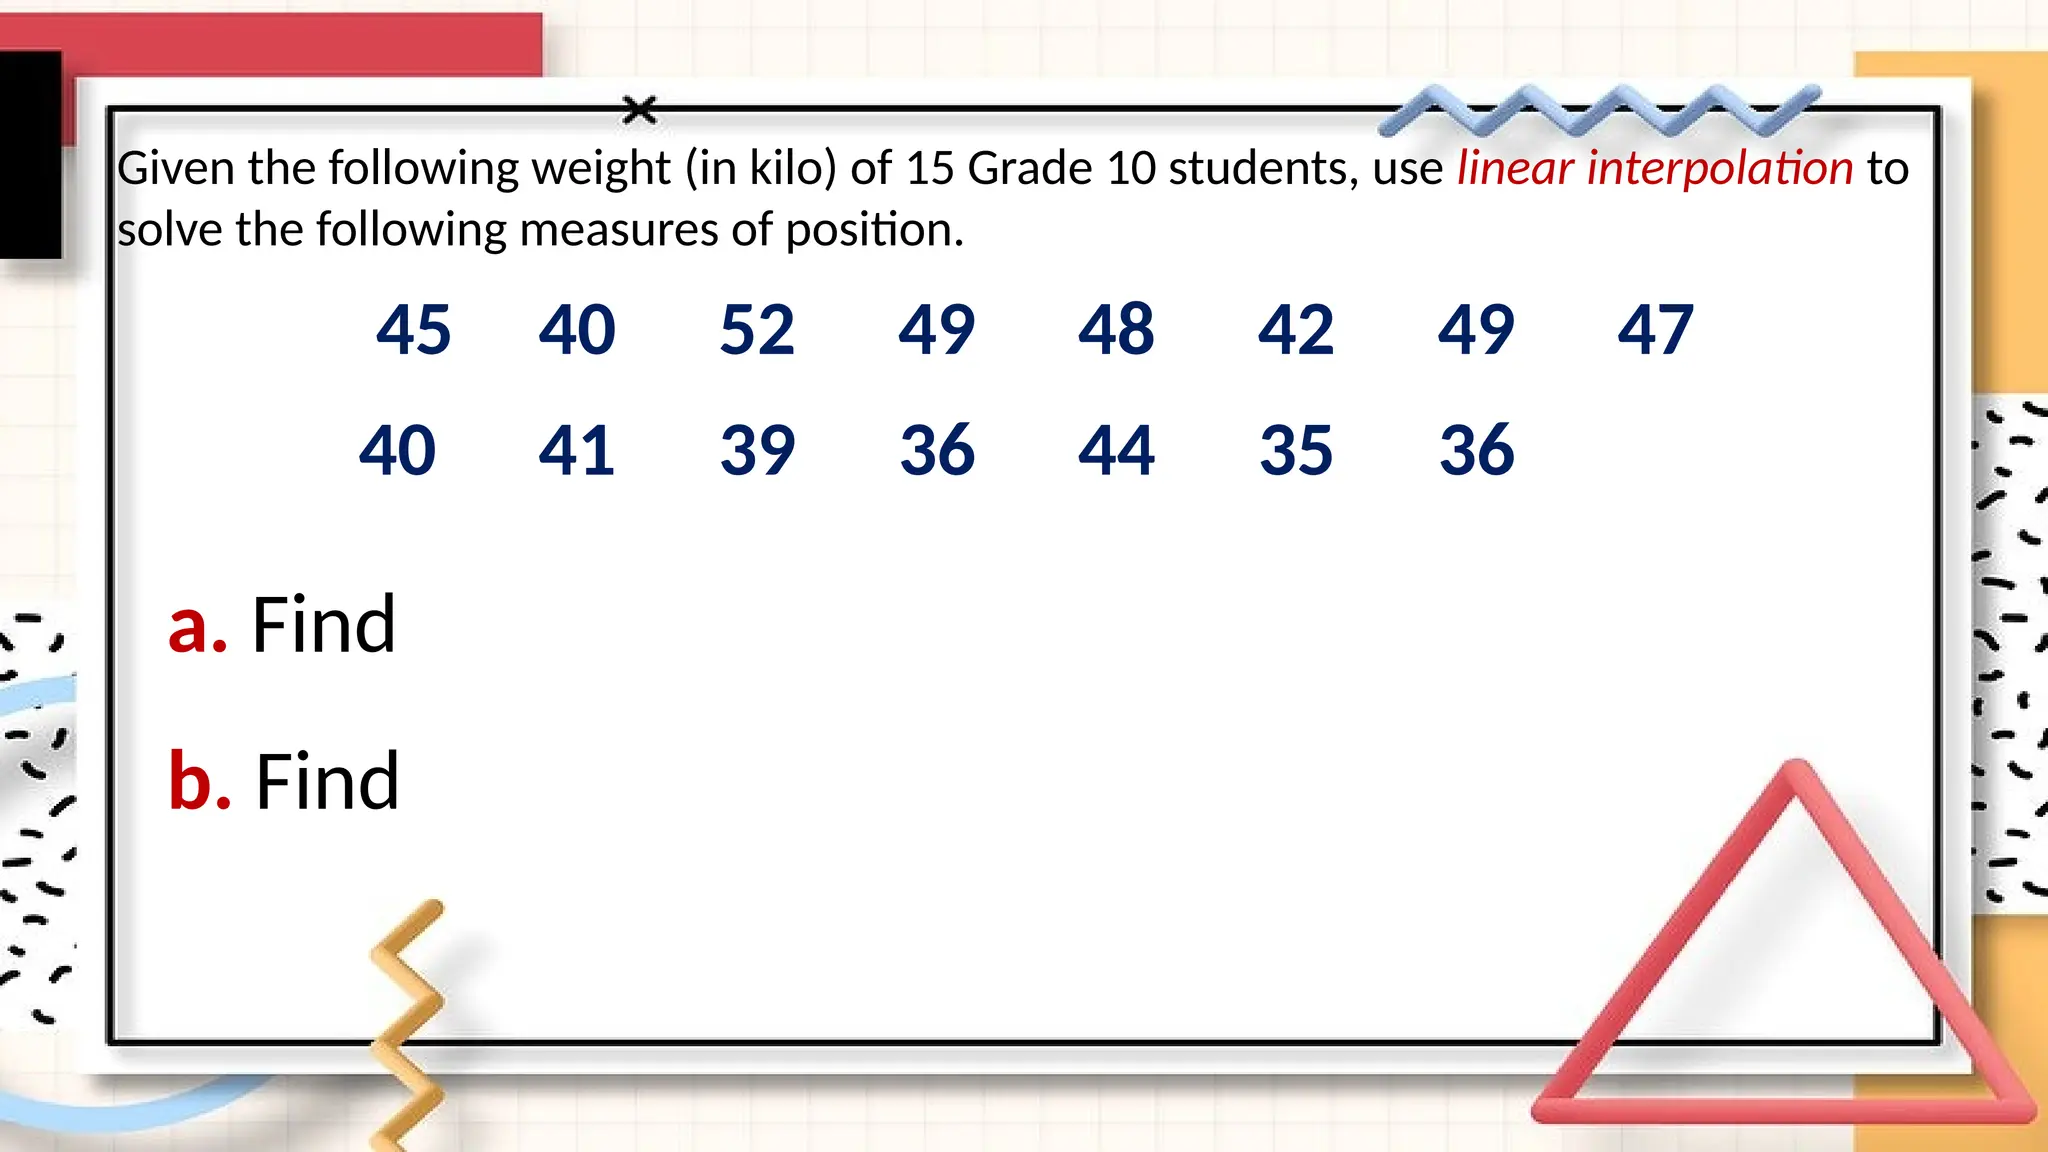
a. Find
45 4052 49 48 42 49 47
40 41 39 36 44 35 36
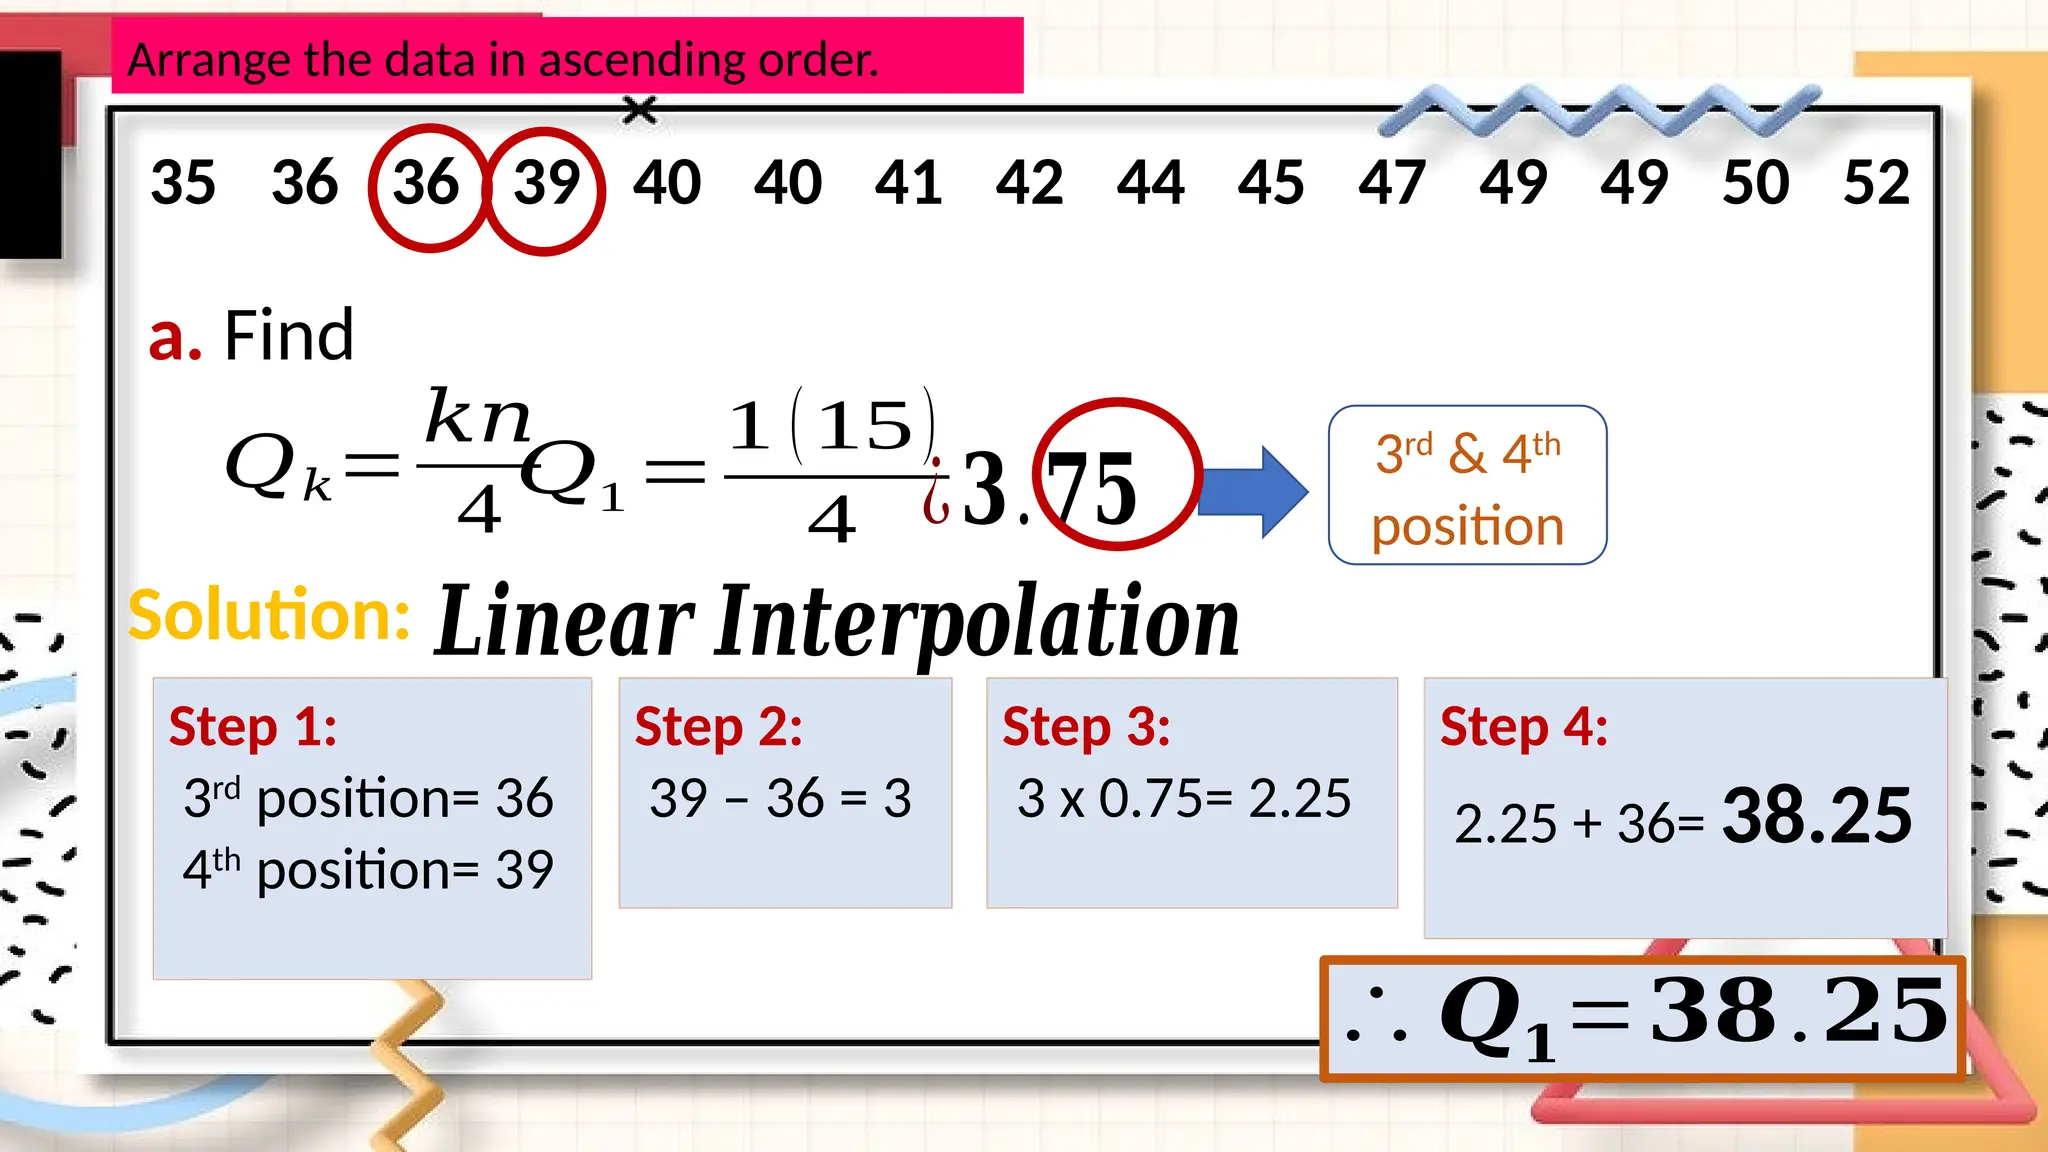
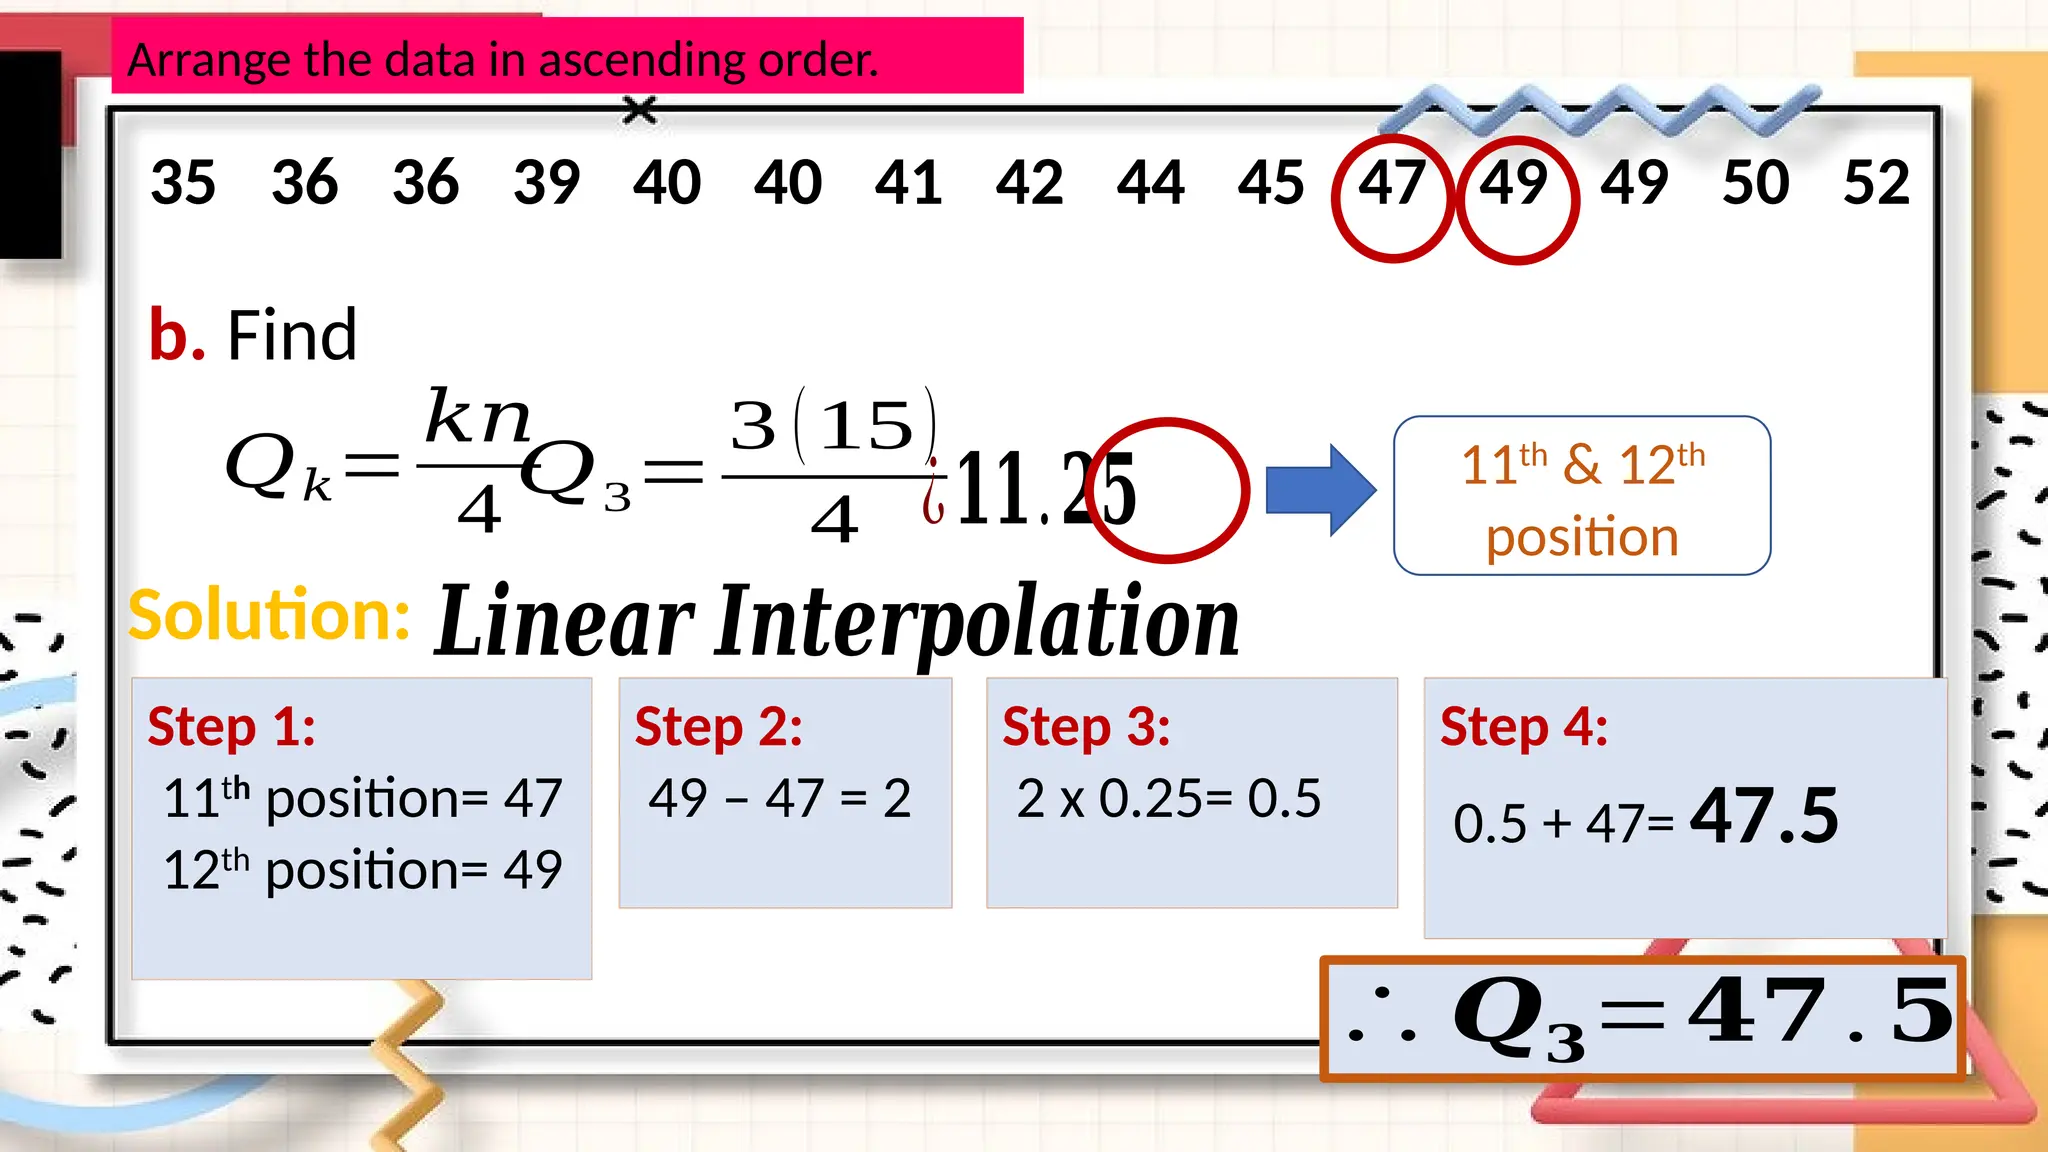
Given the following weight (in kilo) of 15 Grade 10 students, use linear interpolation to
solve the following measures of position.
b. Find
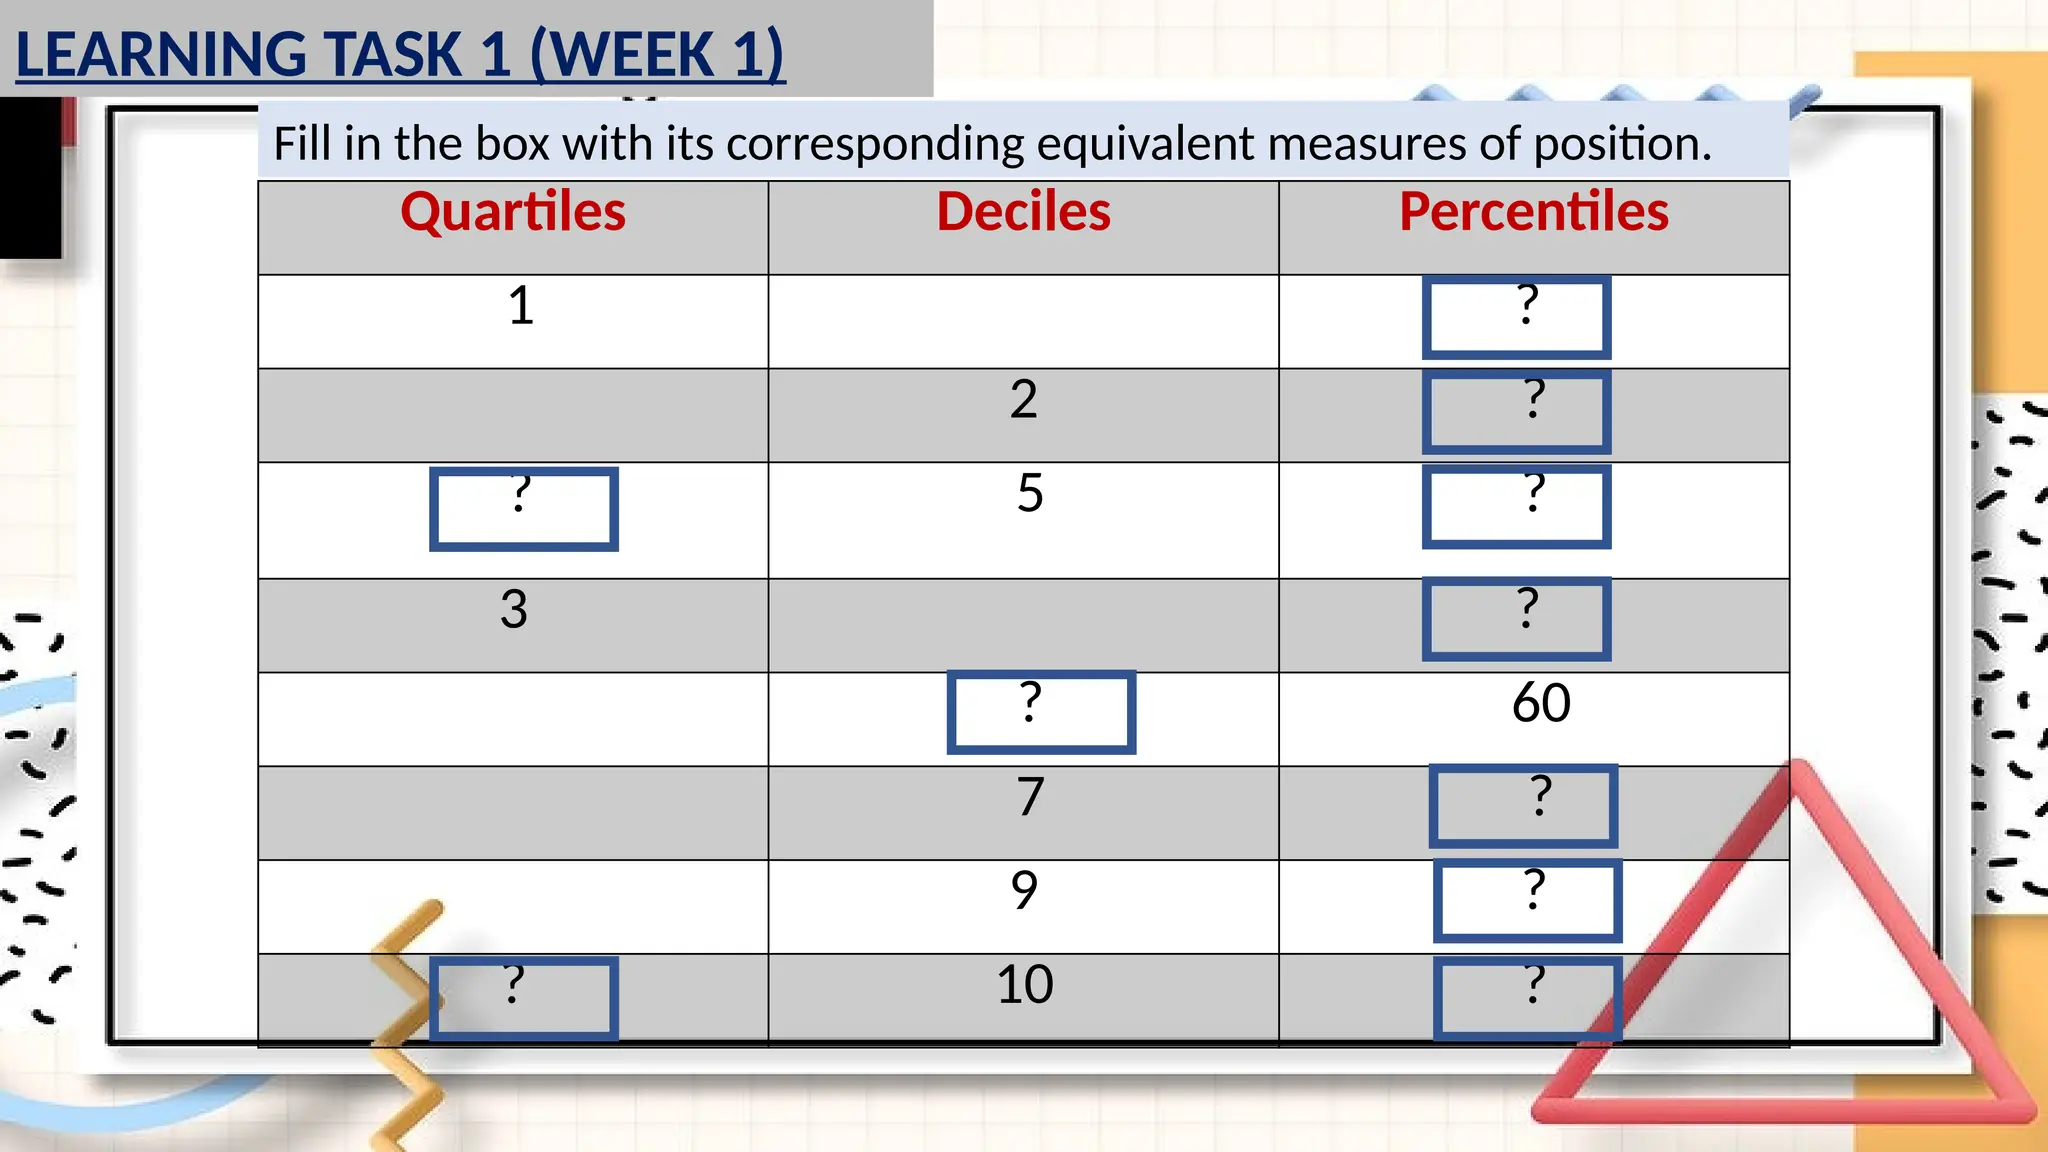
LEARNING TASK 1(WEEK 1)
Quartiles Deciles Percentiles
1 ?
2 ?
? 5 ?
3 ?
? 60
7 ?
9 ?
? 10 ?
Fill in the box with its corresponding equivalent measures of position.
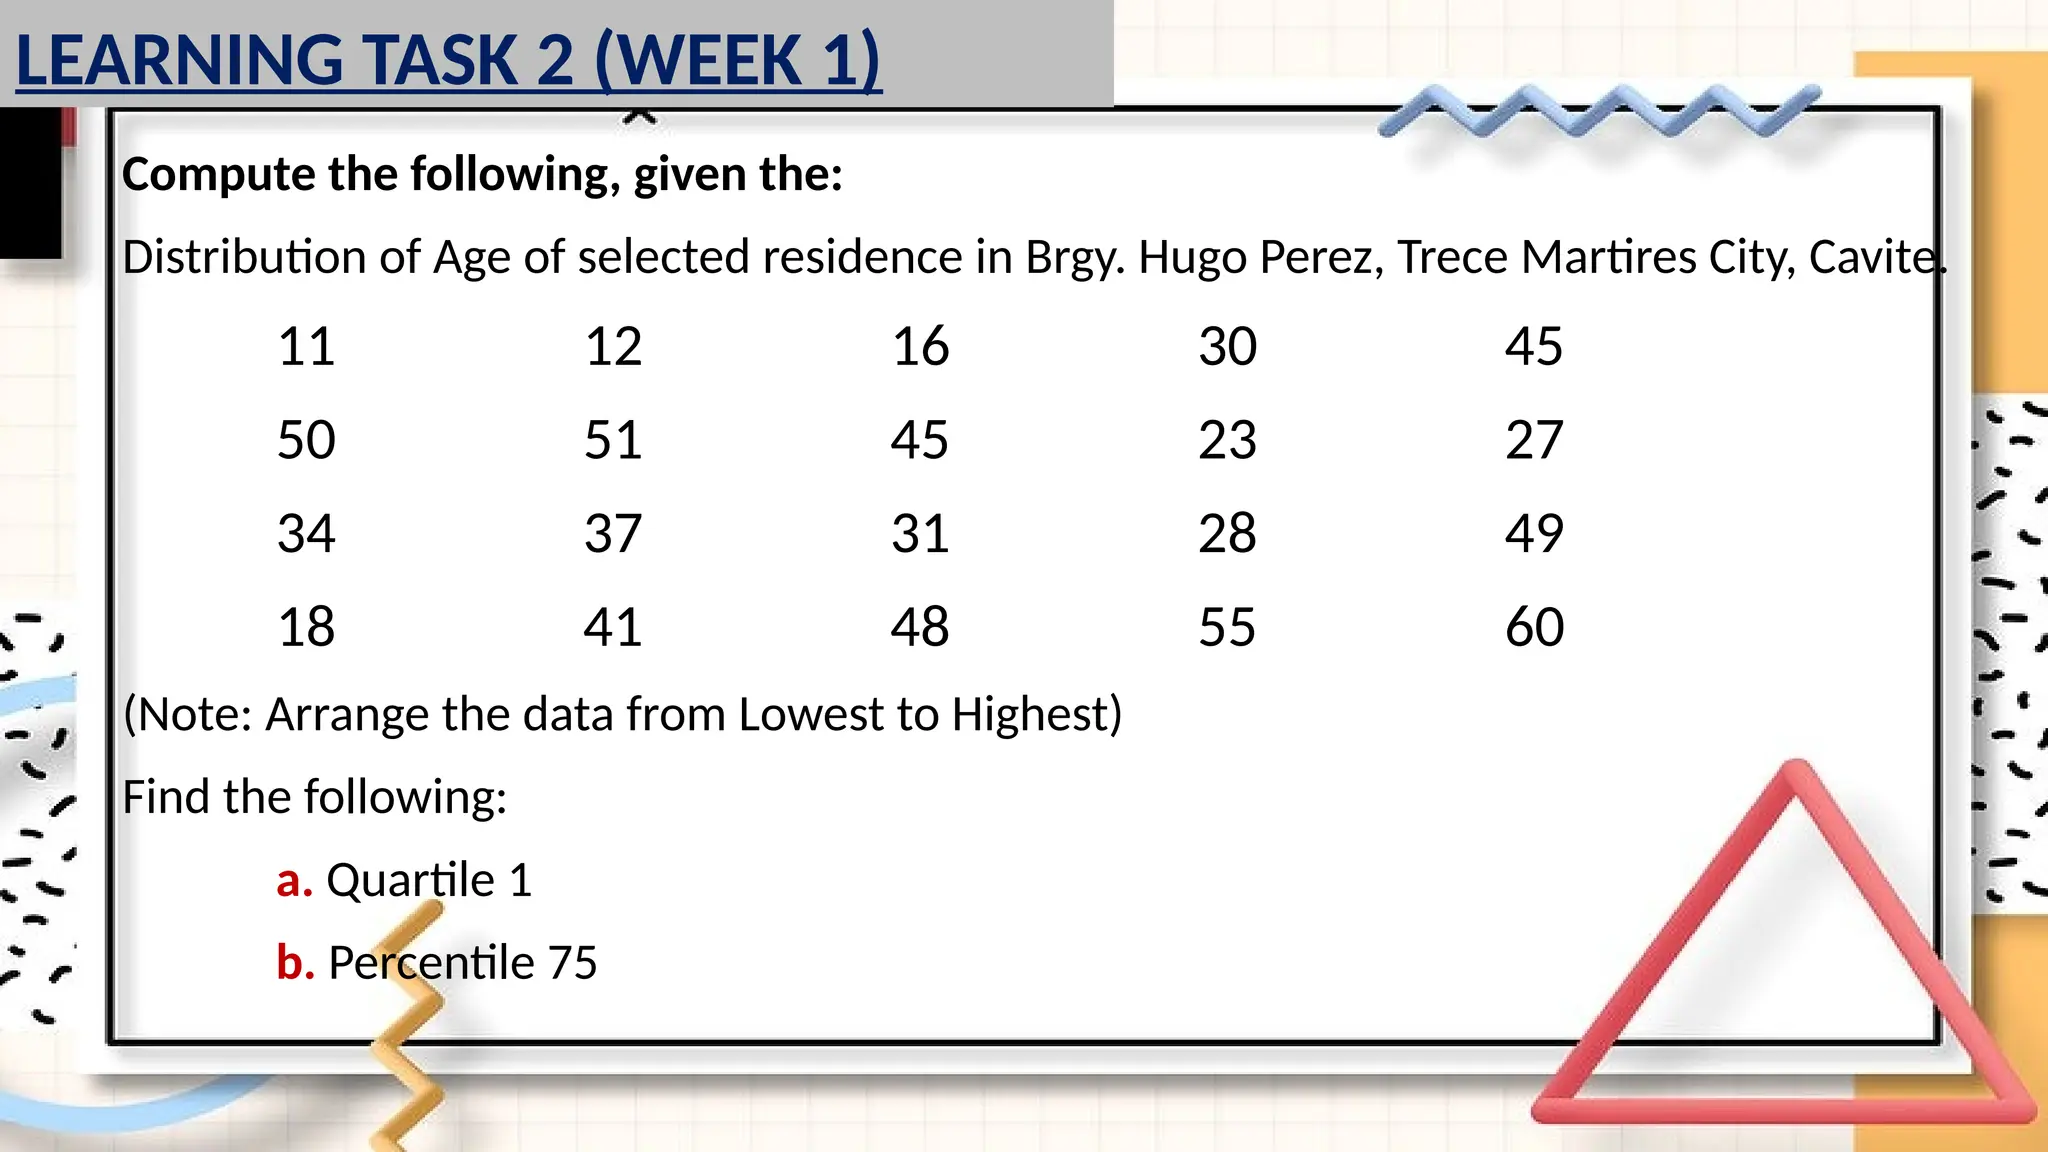
54.
Compute the following,given the:
Distribution of Age of selected residence in Brgy. Hugo Perez, Trece Martires City, Cavite.
11 12 16 30 45
50 51 45 23 27
34 37 31 28 49
18 41 48 55 60
(Note: Arrange the data from Lowest to Highest)
Find the following:
a. Quartile 1
b. Percentile 75
LEARNING TASK 2 (WEEK 1)