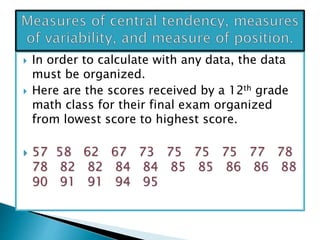
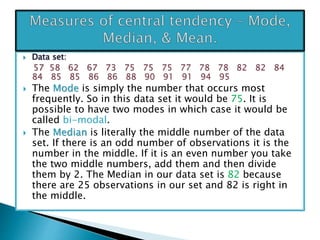
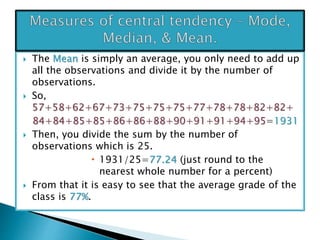
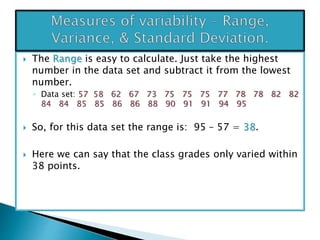
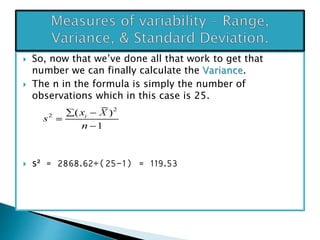
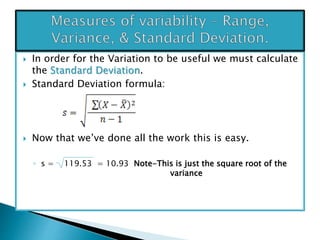
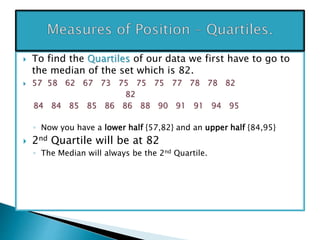
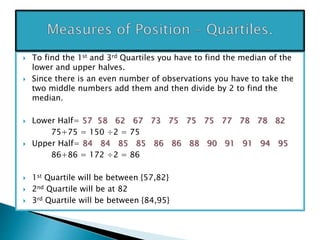
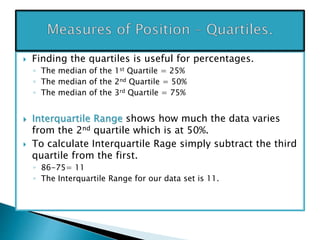
SlideShare a Scribd company logo
 In order to calculate with any data, the data
must be organized.
 Here are the scores received by a 12th grade
math class for their final exam organized
from lowest score to highest score.
 57 58 62 67 73 75 75 75 77 78
78 82 82 84 84 85 85 86 86 88
90 91 91 94 95
 Data set:
57 58 62 67 73 75 75 75 77 78 78 82 82 84
84 85 85 86 86 88 90 91 91 94 95
 The Mode is simply the number that occurs most
frequently. So in this data set it would be 75. It is
possible to have two modes in which case it would be
called bi-modal.
 The Median is literally the middle number of the data
set. If there is an odd number of observations it is the
number in the middle. If it is an even number you take
the two middle numbers, add them and then divide
them by 2. The Median in our data set is 82 because
there are 25 observations in our set and 82 is right in
the middle.
 The Mean is simply an average, you only need to add up
all the observations and divide it by the number of
observations.
 So,
57+58+62+67+73+75+75+75+77+78+78+82+82+
84+84+85+85+86+86+88+90+91+91+94+95=1931
 Then, you divide the sum by the number of
observations which is 25.
 1931/25=77.24 (just round to the
nearest whole number for a percent)
 From that it is easy to see that the average grade of the
class is 77%.
 The Range is easy to calculate. Just take the highest
number in the data set and subtract it from the lowest
number.
◦ Data set: 57 58 62 67 73 75 75 75 77 78 78 82 82
84 84 85 85 86 86 88 90 91 91 94 95
 So, for this data set the range is: 95 – 57 = 38.
 Here we can say that the class grades only varied within
38 points.
 “Variance measures the deviation of the data set from its
mean.”
 The Variance formula is:
 Don’t worry it is not as complicated as it looks.
 First you take all the unique observations individually and
subtract it from the mean and square that number.
Afterwards you add all the results together and divide them
by n-1 where n = the number of observations.
 It’s easiest to do this on a table to be able to keep track of
everything.
x (x – X) (x – X)²
57 57 - 77.24 = -20.24 (-20.24)² = 409.66
58 58 - 77.24 = -19.24 (-19.24)² = 370.18
62 62 - 77.24 = -15.24 (-15.24)² = 232.26
67 67 - 77.24 = -10.24 (-10.24)² = 104.86
73 73 - 77.24 = -4.24 (-4.24)² = 17.98
75 75 - 77.24 = -2.24 (-2.24)² = 5.02
77 77 - 77.24 = -0.24 (-0.24)² = 0.06
78 78 - 77.24 = 0.76 (0.76)² = 0.58
82 82 - 77.24 = 4.76 (4.76)² = 22.66
84 84 - 77.24 = 6.76 (6.76)² = 45.70
85 85 - 77.24 = 7.76 (7.76)² = 60.22
86 86 - 77.24 = 8.76 (8.76)² = 76.74
88 88 - 77.24 = 10.76 (10.76)² = 115.78
90 90 - 77.24 = 12.76 (12.76)² = 162.82
91 91 - 77.24 = 13.76 (13.76)² = 186.34
94 94 - 77.24 = 16.76 (16.76)² = 280.90
95 95 - 77.24 = 17.76 (17.76)² = 315.42
 So, the Sigma (Σ) part of the equation is just telling
us to add up all the results from the final column
of our table which.
◦ 409.66+370.18+232.26+104.86+17.98+5.02+5.02+5.02
+0.06+0.58+0.58+22.66+22.66+45.70+45.70+60.22+
60.22+76.74+76.74+115.78+162.82+186.34+186.34+
280.90+315.42 = 2868.62
◦ Note that we had 25 observations and must add 25
numbers, the repeated numbers were not added to the
table but you must add them here for the sum.
 So, now that we’ve done all that work to get that
number we can finally calculate the Variance.
 The n in the formula is simply the number of
observations which in this case is 25.
 s² = 2868.62÷(25-1) = 119.53
 In order for the Variation to be useful we must calculate
the Standard Deviation.
 Standard Deviation formula:
 Now that we’ve done all the work this is easy.
◦ s = 119.53 = 10.93 Note-This is just the square root of the
variance
 To find the Quartiles of our data we first have to go to
the median of the set which is 82.
 57 58 62 67 73 75 75 75 77 78 78 82
82
84 84 85 85 86 86 88 90 91 91 94 95
◦ Now you have a lower half {57,82} and an upper half {84,95}
 2nd Quartile will be at 82
◦ The Median will always be the 2nd Quartile.
 To find the 1st and 3rd Quartiles you have to find the median of the
lower and upper halves.
 Since there is an even number of observations you have to take the
two middle numbers add them and then divide by 2 to find the
median.
 Lower Half= 57 58 62 67 73 75 75 75 77 78 78 82
75+75 = 150 ÷2 = 75
 Upper Half= 84 84 85 85 86 86 88 90 91 91 94 95
86+86 = 172 ÷2 = 86
 1st Quartile will be between {57,82}
 2nd Quartile will be at 82
 3rd Quartile will be between {84,95}
 Finding the quartiles is useful for percentages.
◦ The median of the 1st Quartile = 25%
◦ The median of the 2nd Quartile = 50%
◦ The median of the 3rd Quartile = 75%
 Interquartile Range shows how much the data varies
from the 2nd quartile which is at 50%.
 To calculate Interquartile Rage simply subtract the third
quartile from the first.
◦ 86-75= 11
◦ The Interquartile Range for our data set is 11.
 http://www.allianthawk.org/showdef.php?wo
rd=187
 http://media.pearsoncmg.com/pcp/pls_coco
_2/statistics_ap/lesson_03/index.html

More Related Content

What's hot

3.4 Measures of Position
3.4 Measures of Position3.4 Measures of Position
3.4 Measures of Position
mlong24
 
Axiom of Choice (2).pptx
Axiom of Choice (2).pptxAxiom of Choice (2).pptx
Axiom of Choice (2).pptx
Jay Garalde
 
Kendall coefficient of concordance
Kendall coefficient of concordance Kendall coefficient of concordance
Kendall coefficient of concordance
Zha Jie
 
Geometric Mean
Geometric MeanGeometric Mean
Geometric Mean
Free Math Powerpoints
 
General mathematics
General mathematicsGeneral mathematics
General mathematics
Boyet Aluan
 
Interpretation of Assessment Results
Interpretation of Assessment ResultsInterpretation of Assessment Results
Interpretation of Assessment Results
Rica Joy Pontilar
 
writing linear equation
writing linear equationwriting linear equation
writing linear equation
JessebelBautista
 
Lesson plan math 10 2 nd grading
Lesson plan math 10 2 nd gradingLesson plan math 10 2 nd grading
Lesson plan math 10 2 nd grading
Nnelgebar
 
PERCENTILE RANK
PERCENTILE RANKPERCENTILE RANK
PERCENTILE RANK
Chuckry Maunes
 
MEASURES OF DISPERSION OF UNGROUPED DATA
MEASURES OF DISPERSION OF UNGROUPED DATAMEASURES OF DISPERSION OF UNGROUPED DATA
MEASURES OF DISPERSION OF UNGROUPED DATA
MISS ESTHER
 
Percentile
PercentilePercentile
Percentile
abhisrivastava11
 
Statistics & probability lesson 8&9
Statistics & probability lesson 8&9Statistics & probability lesson 8&9
Statistics & probability lesson 8&9
MARIA CHRISTITA POLINAG
 
Measures of variability grouped data
Measures of variability grouped dataMeasures of variability grouped data
Measures of variability grouped data
Jean Claudette Tolentino
 
ITEM ANALYSIS
ITEM ANALYSISITEM ANALYSIS
ITEM ANALYSIS
MEF Ramos
 
measures-of-variability-11.ppt
measures-of-variability-11.pptmeasures-of-variability-11.ppt
measures-of-variability-11.ppt
NievesGuardian1
 
Percentile For Grouped Data
Percentile For Grouped Data Percentile For Grouped Data
Percentile For Grouped Data
Veronica Jomadiao
 
Report frequency distribution table
Report frequency distribution tableReport frequency distribution table
Report frequency distribution table
MaTeresa Berondo
 
Quartile (ungrouped)
Quartile (ungrouped)Quartile (ungrouped)
Quartile (ungrouped)
jacquelinebae2
 
Chapter i
Chapter iChapter i
Elementary Statistics
Elementary Statistics Elementary Statistics
Elementary Statistics
jennytuazon01630
 

What's hot (20)

3.4 Measures of Position
3.4 Measures of Position3.4 Measures of Position
3.4 Measures of Position
 
Axiom of Choice (2).pptx
Axiom of Choice (2).pptxAxiom of Choice (2).pptx
Axiom of Choice (2).pptx
 
Kendall coefficient of concordance
Kendall coefficient of concordance Kendall coefficient of concordance
Kendall coefficient of concordance
 
Geometric Mean
Geometric MeanGeometric Mean
Geometric Mean
 
General mathematics
General mathematicsGeneral mathematics
General mathematics
 
Interpretation of Assessment Results
Interpretation of Assessment ResultsInterpretation of Assessment Results
Interpretation of Assessment Results
 
writing linear equation
writing linear equationwriting linear equation
writing linear equation
 
Lesson plan math 10 2 nd grading
Lesson plan math 10 2 nd gradingLesson plan math 10 2 nd grading
Lesson plan math 10 2 nd grading
 
PERCENTILE RANK
PERCENTILE RANKPERCENTILE RANK
PERCENTILE RANK
 
MEASURES OF DISPERSION OF UNGROUPED DATA
MEASURES OF DISPERSION OF UNGROUPED DATAMEASURES OF DISPERSION OF UNGROUPED DATA
MEASURES OF DISPERSION OF UNGROUPED DATA
 
Percentile
PercentilePercentile
Percentile
 
Statistics & probability lesson 8&9
Statistics & probability lesson 8&9Statistics & probability lesson 8&9
Statistics & probability lesson 8&9
 
Measures of variability grouped data
Measures of variability grouped dataMeasures of variability grouped data
Measures of variability grouped data
 
ITEM ANALYSIS
ITEM ANALYSISITEM ANALYSIS
ITEM ANALYSIS
 
measures-of-variability-11.ppt
measures-of-variability-11.pptmeasures-of-variability-11.ppt
measures-of-variability-11.ppt
 
Percentile For Grouped Data
Percentile For Grouped Data Percentile For Grouped Data
Percentile For Grouped Data
 
Report frequency distribution table
Report frequency distribution tableReport frequency distribution table
Report frequency distribution table
 
Quartile (ungrouped)
Quartile (ungrouped)Quartile (ungrouped)
Quartile (ungrouped)
 
Chapter i
Chapter iChapter i
Chapter i
 
Elementary Statistics
Elementary Statistics Elementary Statistics
Elementary Statistics
 

Similar to Measures of Central Tendency, Variability, and Position

03 central tendency and disperson
03   central tendency and disperson03   central tendency and disperson
03 central tendency and disperson
Ernie Cerado
 
Standard deviation
Standard deviationStandard deviation
Standard deviation
Chanelle Honey Cruz
 
Ejercicio resuelto-de-estadc3adstica-descriptiva1
Ejercicio resuelto-de-estadc3adstica-descriptiva1Ejercicio resuelto-de-estadc3adstica-descriptiva1
Ejercicio resuelto-de-estadc3adstica-descriptiva1
Sandra Hernández Cely
 
MEASURES-OF-CENTRAL-TENDENCY-VARIABILITY-TEAM-S-PERSISTENCE.pptx
MEASURES-OF-CENTRAL-TENDENCY-VARIABILITY-TEAM-S-PERSISTENCE.pptxMEASURES-OF-CENTRAL-TENDENCY-VARIABILITY-TEAM-S-PERSISTENCE.pptx
MEASURES-OF-CENTRAL-TENDENCY-VARIABILITY-TEAM-S-PERSISTENCE.pptx
RochAsuncion
 
Measures-of-Central-Tendency.ppt
Measures-of-Central-Tendency.pptMeasures-of-Central-Tendency.ppt
Measures-of-Central-Tendency.ppt
GrandeurAidranMamaua
 
Standard deviation quartile deviation
Standard deviation  quartile deviationStandard deviation  quartile deviation
Standard deviation quartile deviation
Rekha Yadav
 
11º estadistica 5 e 2t
11º estadistica 5 e  2t11º estadistica 5 e  2t
11º estadistica 5 e 2t
IanMojica
 
Basic Mean median mode Standard Deviation
Basic Mean median mode Standard DeviationBasic Mean median mode Standard Deviation
Basic Mean median mode Standard Deviation
Jovendin Leonardo
 
Overview of variance and Standard deviation.pptx
Overview of variance and Standard deviation.pptxOverview of variance and Standard deviation.pptx
Overview of variance and Standard deviation.pptx
CHIRANTANMONDAL2
 
Describing Distributions with Numbers
Describing Distributions with NumbersDescribing Distributions with Numbers
Describing Distributions with Numbers
nszakir
 
measure of variability (windri). In research include example
measure of variability (windri). In research include examplemeasure of variability (windri). In research include example
measure of variability (windri). In research include example
windri3
 
Vedic maths
Vedic mathsVedic maths
Vedic maths
jayraj92
 
Mean, median, mode and range
Mean, median, mode and rangeMean, median, mode and range
Mean, median, mode and range
The Higher Education Academy
 
Standard deviation & variance
Standard deviation & varianceStandard deviation & variance
Standard deviation & variance
Debayan Simlai
 
This is a PPTX on Measures of Position for Math 10
This is a PPTX on Measures of Position for Math 10This is a PPTX on Measures of Position for Math 10
This is a PPTX on Measures of Position for Math 10
SeanEnzoLising
 
Educational statistics
Educational statisticsEducational statistics
Educational statistics
Nishat Anjum
 
Construction of a frequency table
Construction of a frequency tableConstruction of a frequency table
Construction of a frequency table
Mark Santos
 
An overview of statistics management with excel
An overview of statistics management with excelAn overview of statistics management with excel
An overview of statistics management with excel
KRISHANACHOUDHARY1
 
Arithmetic mean
Arithmetic meanArithmetic mean
Arithmetic mean
SoyaMathew1
 
Measures of Variation
Measures of VariationMeasures of Variation
Measures of Variation
Rica Joy Pontilar
 

Similar to Measures of Central Tendency, Variability, and Position (20)

03 central tendency and disperson
03   central tendency and disperson03   central tendency and disperson
03 central tendency and disperson
 
Standard deviation
Standard deviationStandard deviation
Standard deviation
 
Ejercicio resuelto-de-estadc3adstica-descriptiva1
Ejercicio resuelto-de-estadc3adstica-descriptiva1Ejercicio resuelto-de-estadc3adstica-descriptiva1
Ejercicio resuelto-de-estadc3adstica-descriptiva1
 
MEASURES-OF-CENTRAL-TENDENCY-VARIABILITY-TEAM-S-PERSISTENCE.pptx
MEASURES-OF-CENTRAL-TENDENCY-VARIABILITY-TEAM-S-PERSISTENCE.pptxMEASURES-OF-CENTRAL-TENDENCY-VARIABILITY-TEAM-S-PERSISTENCE.pptx
MEASURES-OF-CENTRAL-TENDENCY-VARIABILITY-TEAM-S-PERSISTENCE.pptx
 
Measures-of-Central-Tendency.ppt
Measures-of-Central-Tendency.pptMeasures-of-Central-Tendency.ppt
Measures-of-Central-Tendency.ppt
 
Standard deviation quartile deviation
Standard deviation  quartile deviationStandard deviation  quartile deviation
Standard deviation quartile deviation
 
11º estadistica 5 e 2t
11º estadistica 5 e  2t11º estadistica 5 e  2t
11º estadistica 5 e 2t
 
Basic Mean median mode Standard Deviation
Basic Mean median mode Standard DeviationBasic Mean median mode Standard Deviation
Basic Mean median mode Standard Deviation
 
Overview of variance and Standard deviation.pptx
Overview of variance and Standard deviation.pptxOverview of variance and Standard deviation.pptx
Overview of variance and Standard deviation.pptx
 
Describing Distributions with Numbers
Describing Distributions with NumbersDescribing Distributions with Numbers
Describing Distributions with Numbers
 
measure of variability (windri). In research include example
measure of variability (windri). In research include examplemeasure of variability (windri). In research include example
measure of variability (windri). In research include example
 
Vedic maths
Vedic mathsVedic maths
Vedic maths
 
Mean, median, mode and range
Mean, median, mode and rangeMean, median, mode and range
Mean, median, mode and range
 
Standard deviation & variance
Standard deviation & varianceStandard deviation & variance
Standard deviation & variance
 
This is a PPTX on Measures of Position for Math 10
This is a PPTX on Measures of Position for Math 10This is a PPTX on Measures of Position for Math 10
This is a PPTX on Measures of Position for Math 10
 
Educational statistics
Educational statisticsEducational statistics
Educational statistics
 
Construction of a frequency table
Construction of a frequency tableConstruction of a frequency table
Construction of a frequency table
 
An overview of statistics management with excel
An overview of statistics management with excelAn overview of statistics management with excel
An overview of statistics management with excel
 
Arithmetic mean
Arithmetic meanArithmetic mean
Arithmetic mean
 
Measures of Variation
Measures of VariationMeasures of Variation
Measures of Variation
 

More from getyourcheaton

Genetics and Cellular Function
Genetics and Cellular FunctionGenetics and Cellular Function
Genetics and Cellular Function
getyourcheaton
 
Tissues and integumentary ac
Tissues and integumentary acTissues and integumentary ac
Tissues and integumentary ac
getyourcheaton
 
Radical Behaviorism: B.F. Skinner
Radical Behaviorism: B.F. Skinner Radical Behaviorism: B.F. Skinner
Radical Behaviorism: B.F. Skinner
getyourcheaton
 
Humanistic Theories: Carl Rogers
Humanistic Theories: Carl RogersHumanistic Theories: Carl Rogers
Humanistic Theories: Carl Rogers
getyourcheaton
 
Probability Distributions for Continuous Variables
Probability Distributions for Continuous VariablesProbability Distributions for Continuous Variables
Probability Distributions for Continuous Variables
getyourcheaton
 
Probability Distributions for Discrete Variables
Probability Distributions for Discrete VariablesProbability Distributions for Discrete Variables
Probability Distributions for Discrete Variables
getyourcheaton
 
Intro to probability
Intro to probabilityIntro to probability
Intro to probability
getyourcheaton
 
Descriptive Statistics Part II: Graphical Description
Descriptive Statistics Part II: Graphical DescriptionDescriptive Statistics Part II: Graphical Description
Descriptive Statistics Part II: Graphical Description
getyourcheaton
 
Descriptive Statistics, Numerical Description
Descriptive Statistics, Numerical DescriptionDescriptive Statistics, Numerical Description
Descriptive Statistics, Numerical Description
getyourcheaton
 
An Overview of Basic Statistics
An Overview of Basic StatisticsAn Overview of Basic Statistics
An Overview of Basic Statistics
getyourcheaton
 
Autonomic nervous system and visceral reflexes
Autonomic nervous system and visceral reflexesAutonomic nervous system and visceral reflexes
Autonomic nervous system and visceral reflexes
getyourcheaton
 
Water, Electrolyte, And Acid-Base Balance
Water, Electrolyte, And Acid-Base BalanceWater, Electrolyte, And Acid-Base Balance
Water, Electrolyte, And Acid-Base Balance
getyourcheaton
 
Urinary system
Urinary systemUrinary system
Urinary system
getyourcheaton
 

More from getyourcheaton (13)

Genetics and Cellular Function
Genetics and Cellular FunctionGenetics and Cellular Function
Genetics and Cellular Function
 
Tissues and integumentary ac
Tissues and integumentary acTissues and integumentary ac
Tissues and integumentary ac
 
Radical Behaviorism: B.F. Skinner
Radical Behaviorism: B.F. Skinner Radical Behaviorism: B.F. Skinner
Radical Behaviorism: B.F. Skinner
 
Humanistic Theories: Carl Rogers
Humanistic Theories: Carl RogersHumanistic Theories: Carl Rogers
Humanistic Theories: Carl Rogers
 
Probability Distributions for Continuous Variables
Probability Distributions for Continuous VariablesProbability Distributions for Continuous Variables
Probability Distributions for Continuous Variables
 
Probability Distributions for Discrete Variables
Probability Distributions for Discrete VariablesProbability Distributions for Discrete Variables
Probability Distributions for Discrete Variables
 
Intro to probability
Intro to probabilityIntro to probability
Intro to probability
 
Descriptive Statistics Part II: Graphical Description
Descriptive Statistics Part II: Graphical DescriptionDescriptive Statistics Part II: Graphical Description
Descriptive Statistics Part II: Graphical Description
 
Descriptive Statistics, Numerical Description
Descriptive Statistics, Numerical DescriptionDescriptive Statistics, Numerical Description
Descriptive Statistics, Numerical Description
 
An Overview of Basic Statistics
An Overview of Basic StatisticsAn Overview of Basic Statistics
An Overview of Basic Statistics
 
Autonomic nervous system and visceral reflexes
Autonomic nervous system and visceral reflexesAutonomic nervous system and visceral reflexes
Autonomic nervous system and visceral reflexes
 
Water, Electrolyte, And Acid-Base Balance
Water, Electrolyte, And Acid-Base BalanceWater, Electrolyte, And Acid-Base Balance
Water, Electrolyte, And Acid-Base Balance
 
Urinary system
Urinary systemUrinary system
Urinary system
 

Recently uploaded

Gender and Mental Health - Counselling and Family Therapy Applications and In...
Gender and Mental Health - Counselling and Family Therapy Applications and In...Gender and Mental Health - Counselling and Family Therapy Applications and In...
Gender and Mental Health - Counselling and Family Therapy Applications and In...
PsychoTech Services
 
Solutons Maths Escape Room Spatial .pptx
Solutons Maths Escape Room Spatial .pptxSolutons Maths Escape Room Spatial .pptx
Solutons Maths Escape Room Spatial .pptx
spdendr
 
How to Setup Warehouse & Location in Odoo 17 Inventory
How to Setup Warehouse & Location in Odoo 17 InventoryHow to Setup Warehouse & Location in Odoo 17 Inventory
How to Setup Warehouse & Location in Odoo 17 Inventory
Celine George
 
How to Make a Field Mandatory in Odoo 17
How to Make a Field Mandatory in Odoo 17How to Make a Field Mandatory in Odoo 17
How to Make a Field Mandatory in Odoo 17
Celine George
 
Your Skill Boost Masterclass: Strategies for Effective Upskilling
Your Skill Boost Masterclass: Strategies for Effective UpskillingYour Skill Boost Masterclass: Strategies for Effective Upskilling
Your Skill Boost Masterclass: Strategies for Effective Upskilling
Excellence Foundation for South Sudan
 
Wound healing PPT
Wound healing PPTWound healing PPT
Wound healing PPT
Jyoti Chand
 
Présentationvvvvvvvvvvvvvvvvvvvvvvvvvvvv2.pptx
Présentationvvvvvvvvvvvvvvvvvvvvvvvvvvvv2.pptxPrésentationvvvvvvvvvvvvvvvvvvvvvvvvvvvv2.pptx
Présentationvvvvvvvvvvvvvvvvvvvvvvvvvvvv2.pptx
siemaillard
 
writing about opinions about Australia the movie
writing about opinions about Australia the moviewriting about opinions about Australia the movie
writing about opinions about Australia the movie
Nicholas Montgomery
 
C1 Rubenstein AP HuG xxxxxxxxxxxxxx.pptx
C1 Rubenstein AP HuG xxxxxxxxxxxxxx.pptxC1 Rubenstein AP HuG xxxxxxxxxxxxxx.pptx
C1 Rubenstein AP HuG xxxxxxxxxxxxxx.pptx
mulvey2
 
Constructing Your Course Container for Effective Communication
Constructing Your Course Container for Effective CommunicationConstructing Your Course Container for Effective Communication
Constructing Your Course Container for Effective Communication
Chevonnese Chevers Whyte, MBA, B.Sc.
 
ANATOMY AND BIOMECHANICS OF HIP JOINT.pdf
ANATOMY AND BIOMECHANICS OF HIP JOINT.pdfANATOMY AND BIOMECHANICS OF HIP JOINT.pdf
ANATOMY AND BIOMECHANICS OF HIP JOINT.pdf
Priyankaranawat4
 
How to Create a More Engaging and Human Online Learning Experience
How to Create a More Engaging and Human Online Learning Experience How to Create a More Engaging and Human Online Learning Experience
How to Create a More Engaging and Human Online Learning Experience
Wahiba Chair Training & Consulting
 
Advanced Java[Extra Concepts, Not Difficult].docx
Advanced Java[Extra Concepts, Not Difficult].docxAdvanced Java[Extra Concepts, Not Difficult].docx
Advanced Java[Extra Concepts, Not Difficult].docx
adhitya5119
 
Bed Making ( Introduction, Purpose, Types, Articles, Scientific principles, N...
Bed Making ( Introduction, Purpose, Types, Articles, Scientific principles, N...Bed Making ( Introduction, Purpose, Types, Articles, Scientific principles, N...
Bed Making ( Introduction, Purpose, Types, Articles, Scientific principles, N...
Leena Ghag-Sakpal
 
Liberal Approach to the Study of Indian Politics.pdf
Liberal Approach to the Study of Indian Politics.pdfLiberal Approach to the Study of Indian Politics.pdf
Liberal Approach to the Study of Indian Politics.pdf
WaniBasim
 
math operations ued in python and all used
math operations ued in python and all usedmath operations ued in python and all used
math operations ued in python and all used
ssuser13ffe4
 
คำศัพท์ คำพื้นฐานการอ่าน ภาษาอังกฤษ ระดับชั้น ม.1
คำศัพท์ คำพื้นฐานการอ่าน ภาษาอังกฤษ ระดับชั้น ม.1คำศัพท์ คำพื้นฐานการอ่าน ภาษาอังกฤษ ระดับชั้น ม.1
คำศัพท์ คำพื้นฐานการอ่าน ภาษาอังกฤษ ระดับชั้น ม.1
สมใจ จันสุกสี
 
spot a liar (Haiqa 146).pptx Technical writhing and presentation skills
spot a liar (Haiqa 146).pptx Technical writhing and presentation skillsspot a liar (Haiqa 146).pptx Technical writhing and presentation skills
spot a liar (Haiqa 146).pptx Technical writhing and presentation skills
haiqairshad
 
Traditional Musical Instruments of Arunachal Pradesh and Uttar Pradesh - RAYH...
Traditional Musical Instruments of Arunachal Pradesh and Uttar Pradesh - RAYH...Traditional Musical Instruments of Arunachal Pradesh and Uttar Pradesh - RAYH...
Traditional Musical Instruments of Arunachal Pradesh and Uttar Pradesh - RAYH...
imrankhan141184
 
ZK on Polkadot zero knowledge proofs - sub0.pptx
ZK on Polkadot zero knowledge proofs - sub0.pptxZK on Polkadot zero knowledge proofs - sub0.pptx
ZK on Polkadot zero knowledge proofs - sub0.pptx
dot55audits
 

Recently uploaded (20)

Gender and Mental Health - Counselling and Family Therapy Applications and In...
Gender and Mental Health - Counselling and Family Therapy Applications and In...Gender and Mental Health - Counselling and Family Therapy Applications and In...
Gender and Mental Health - Counselling and Family Therapy Applications and In...
 
Solutons Maths Escape Room Spatial .pptx
Solutons Maths Escape Room Spatial .pptxSolutons Maths Escape Room Spatial .pptx
Solutons Maths Escape Room Spatial .pptx
 
How to Setup Warehouse & Location in Odoo 17 Inventory
How to Setup Warehouse & Location in Odoo 17 InventoryHow to Setup Warehouse & Location in Odoo 17 Inventory
How to Setup Warehouse & Location in Odoo 17 Inventory
 
How to Make a Field Mandatory in Odoo 17
How to Make a Field Mandatory in Odoo 17How to Make a Field Mandatory in Odoo 17
How to Make a Field Mandatory in Odoo 17
 
Your Skill Boost Masterclass: Strategies for Effective Upskilling
Your Skill Boost Masterclass: Strategies for Effective UpskillingYour Skill Boost Masterclass: Strategies for Effective Upskilling
Your Skill Boost Masterclass: Strategies for Effective Upskilling
 
Wound healing PPT
Wound healing PPTWound healing PPT
Wound healing PPT
 
Présentationvvvvvvvvvvvvvvvvvvvvvvvvvvvv2.pptx
Présentationvvvvvvvvvvvvvvvvvvvvvvvvvvvv2.pptxPrésentationvvvvvvvvvvvvvvvvvvvvvvvvvvvv2.pptx
Présentationvvvvvvvvvvvvvvvvvvvvvvvvvvvv2.pptx
 
writing about opinions about Australia the movie
writing about opinions about Australia the moviewriting about opinions about Australia the movie
writing about opinions about Australia the movie
 
C1 Rubenstein AP HuG xxxxxxxxxxxxxx.pptx
C1 Rubenstein AP HuG xxxxxxxxxxxxxx.pptxC1 Rubenstein AP HuG xxxxxxxxxxxxxx.pptx
C1 Rubenstein AP HuG xxxxxxxxxxxxxx.pptx
 
Constructing Your Course Container for Effective Communication
Constructing Your Course Container for Effective CommunicationConstructing Your Course Container for Effective Communication
Constructing Your Course Container for Effective Communication
 
ANATOMY AND BIOMECHANICS OF HIP JOINT.pdf
ANATOMY AND BIOMECHANICS OF HIP JOINT.pdfANATOMY AND BIOMECHANICS OF HIP JOINT.pdf
ANATOMY AND BIOMECHANICS OF HIP JOINT.pdf
 
How to Create a More Engaging and Human Online Learning Experience
How to Create a More Engaging and Human Online Learning Experience How to Create a More Engaging and Human Online Learning Experience
How to Create a More Engaging and Human Online Learning Experience
 
Advanced Java[Extra Concepts, Not Difficult].docx
Advanced Java[Extra Concepts, Not Difficult].docxAdvanced Java[Extra Concepts, Not Difficult].docx
Advanced Java[Extra Concepts, Not Difficult].docx
 
Bed Making ( Introduction, Purpose, Types, Articles, Scientific principles, N...
Bed Making ( Introduction, Purpose, Types, Articles, Scientific principles, N...Bed Making ( Introduction, Purpose, Types, Articles, Scientific principles, N...
Bed Making ( Introduction, Purpose, Types, Articles, Scientific principles, N...
 
Liberal Approach to the Study of Indian Politics.pdf
Liberal Approach to the Study of Indian Politics.pdfLiberal Approach to the Study of Indian Politics.pdf
Liberal Approach to the Study of Indian Politics.pdf
 
math operations ued in python and all used
math operations ued in python and all usedmath operations ued in python and all used
math operations ued in python and all used
 
คำศัพท์ คำพื้นฐานการอ่าน ภาษาอังกฤษ ระดับชั้น ม.1
คำศัพท์ คำพื้นฐานการอ่าน ภาษาอังกฤษ ระดับชั้น ม.1คำศัพท์ คำพื้นฐานการอ่าน ภาษาอังกฤษ ระดับชั้น ม.1
คำศัพท์ คำพื้นฐานการอ่าน ภาษาอังกฤษ ระดับชั้น ม.1
 
spot a liar (Haiqa 146).pptx Technical writhing and presentation skills
spot a liar (Haiqa 146).pptx Technical writhing and presentation skillsspot a liar (Haiqa 146).pptx Technical writhing and presentation skills
spot a liar (Haiqa 146).pptx Technical writhing and presentation skills
 
Traditional Musical Instruments of Arunachal Pradesh and Uttar Pradesh - RAYH...
Traditional Musical Instruments of Arunachal Pradesh and Uttar Pradesh - RAYH...Traditional Musical Instruments of Arunachal Pradesh and Uttar Pradesh - RAYH...
Traditional Musical Instruments of Arunachal Pradesh and Uttar Pradesh - RAYH...
 
ZK on Polkadot zero knowledge proofs - sub0.pptx
ZK on Polkadot zero knowledge proofs - sub0.pptxZK on Polkadot zero knowledge proofs - sub0.pptx
ZK on Polkadot zero knowledge proofs - sub0.pptx
 

Measures of Central Tendency, Variability, and Position

  • 1.
  • 2.  In order to calculate with any data, the data must be organized.  Here are the scores received by a 12th grade math class for their final exam organized from lowest score to highest score.  57 58 62 67 73 75 75 75 77 78 78 82 82 84 84 85 85 86 86 88 90 91 91 94 95
  • 3.  Data set: 57 58 62 67 73 75 75 75 77 78 78 82 82 84 84 85 85 86 86 88 90 91 91 94 95  The Mode is simply the number that occurs most frequently. So in this data set it would be 75. It is possible to have two modes in which case it would be called bi-modal.  The Median is literally the middle number of the data set. If there is an odd number of observations it is the number in the middle. If it is an even number you take the two middle numbers, add them and then divide them by 2. The Median in our data set is 82 because there are 25 observations in our set and 82 is right in the middle.
  • 4.  The Mean is simply an average, you only need to add up all the observations and divide it by the number of observations.  So, 57+58+62+67+73+75+75+75+77+78+78+82+82+ 84+84+85+85+86+86+88+90+91+91+94+95=1931  Then, you divide the sum by the number of observations which is 25.  1931/25=77.24 (just round to the nearest whole number for a percent)  From that it is easy to see that the average grade of the class is 77%.
  • 5.  The Range is easy to calculate. Just take the highest number in the data set and subtract it from the lowest number. ◦ Data set: 57 58 62 67 73 75 75 75 77 78 78 82 82 84 84 85 85 86 86 88 90 91 91 94 95  So, for this data set the range is: 95 – 57 = 38.  Here we can say that the class grades only varied within 38 points.
  • 6.  “Variance measures the deviation of the data set from its mean.”  The Variance formula is:  Don’t worry it is not as complicated as it looks.  First you take all the unique observations individually and subtract it from the mean and square that number. Afterwards you add all the results together and divide them by n-1 where n = the number of observations.  It’s easiest to do this on a table to be able to keep track of everything.
  • 7. x (x – X) (x – X)² 57 57 - 77.24 = -20.24 (-20.24)² = 409.66 58 58 - 77.24 = -19.24 (-19.24)² = 370.18 62 62 - 77.24 = -15.24 (-15.24)² = 232.26 67 67 - 77.24 = -10.24 (-10.24)² = 104.86 73 73 - 77.24 = -4.24 (-4.24)² = 17.98 75 75 - 77.24 = -2.24 (-2.24)² = 5.02 77 77 - 77.24 = -0.24 (-0.24)² = 0.06 78 78 - 77.24 = 0.76 (0.76)² = 0.58 82 82 - 77.24 = 4.76 (4.76)² = 22.66 84 84 - 77.24 = 6.76 (6.76)² = 45.70 85 85 - 77.24 = 7.76 (7.76)² = 60.22 86 86 - 77.24 = 8.76 (8.76)² = 76.74 88 88 - 77.24 = 10.76 (10.76)² = 115.78 90 90 - 77.24 = 12.76 (12.76)² = 162.82 91 91 - 77.24 = 13.76 (13.76)² = 186.34 94 94 - 77.24 = 16.76 (16.76)² = 280.90 95 95 - 77.24 = 17.76 (17.76)² = 315.42
  • 8.  So, the Sigma (Σ) part of the equation is just telling us to add up all the results from the final column of our table which. ◦ 409.66+370.18+232.26+104.86+17.98+5.02+5.02+5.02 +0.06+0.58+0.58+22.66+22.66+45.70+45.70+60.22+ 60.22+76.74+76.74+115.78+162.82+186.34+186.34+ 280.90+315.42 = 2868.62 ◦ Note that we had 25 observations and must add 25 numbers, the repeated numbers were not added to the table but you must add them here for the sum.
  • 9.  So, now that we’ve done all that work to get that number we can finally calculate the Variance.  The n in the formula is simply the number of observations which in this case is 25.  s² = 2868.62÷(25-1) = 119.53
  • 10.  In order for the Variation to be useful we must calculate the Standard Deviation.  Standard Deviation formula:  Now that we’ve done all the work this is easy. ◦ s = 119.53 = 10.93 Note-This is just the square root of the variance
  • 11.  To find the Quartiles of our data we first have to go to the median of the set which is 82.  57 58 62 67 73 75 75 75 77 78 78 82 82 84 84 85 85 86 86 88 90 91 91 94 95 ◦ Now you have a lower half {57,82} and an upper half {84,95}  2nd Quartile will be at 82 ◦ The Median will always be the 2nd Quartile.
  • 12.  To find the 1st and 3rd Quartiles you have to find the median of the lower and upper halves.  Since there is an even number of observations you have to take the two middle numbers add them and then divide by 2 to find the median.  Lower Half= 57 58 62 67 73 75 75 75 77 78 78 82 75+75 = 150 ÷2 = 75  Upper Half= 84 84 85 85 86 86 88 90 91 91 94 95 86+86 = 172 ÷2 = 86  1st Quartile will be between {57,82}  2nd Quartile will be at 82  3rd Quartile will be between {84,95}
  • 13.  Finding the quartiles is useful for percentages. ◦ The median of the 1st Quartile = 25% ◦ The median of the 2nd Quartile = 50% ◦ The median of the 3rd Quartile = 75%  Interquartile Range shows how much the data varies from the 2nd quartile which is at 50%.  To calculate Interquartile Rage simply subtract the third quartile from the first. ◦ 86-75= 11 ◦ The Interquartile Range for our data set is 11.