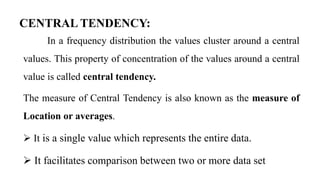
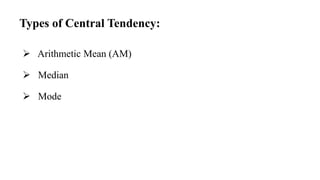
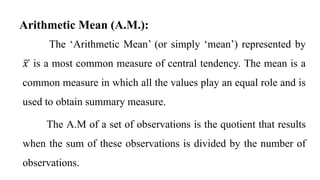
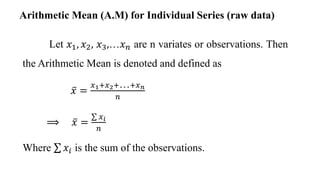
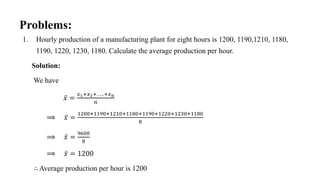
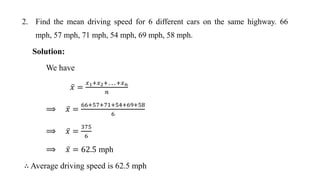
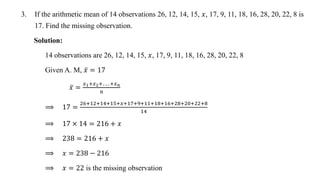
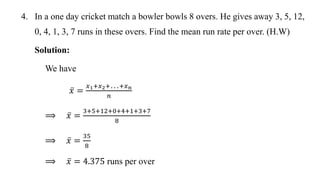
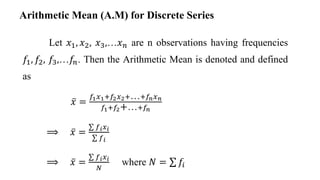
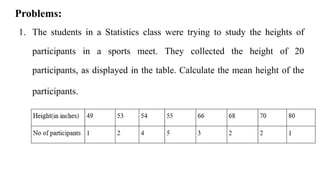
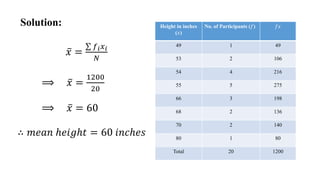
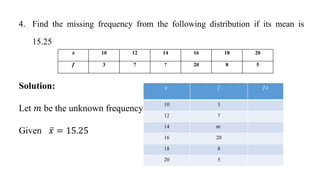
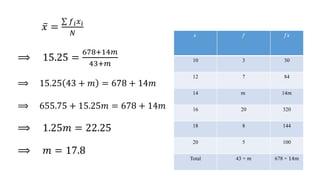
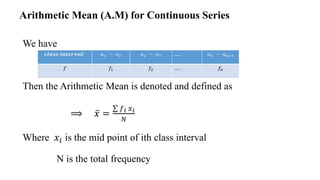
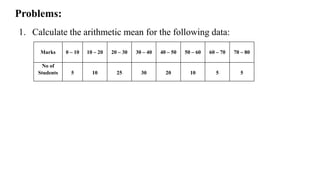
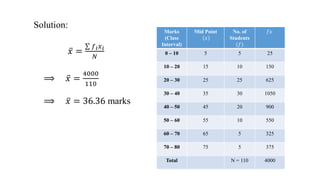
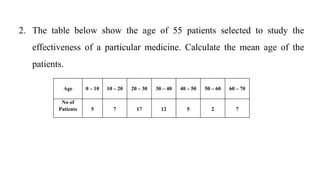
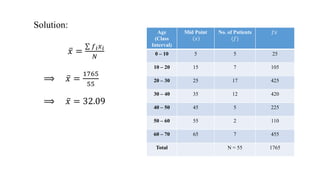
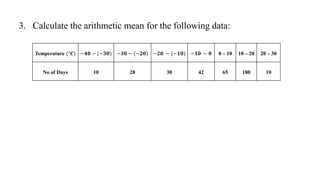
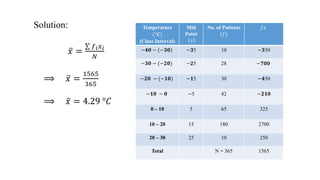
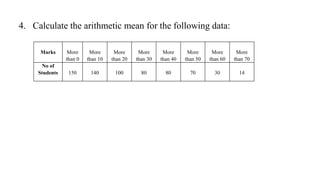
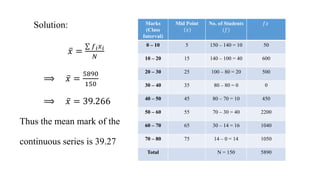
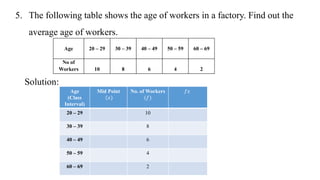
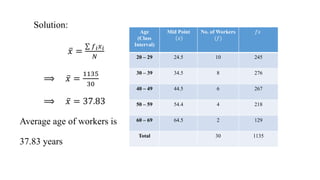
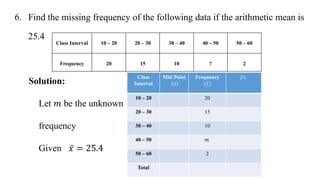
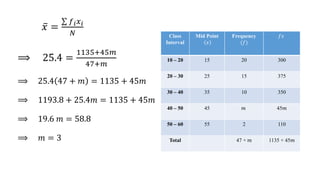
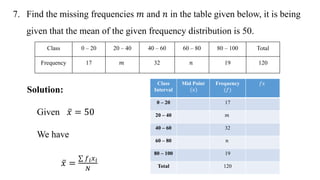
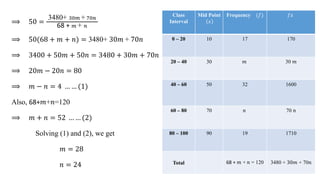
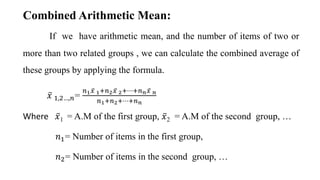
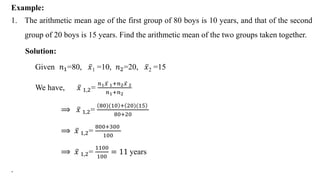
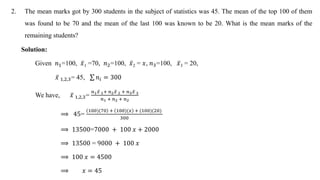
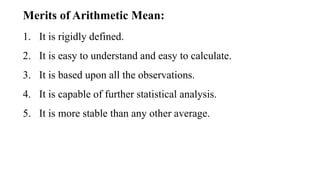
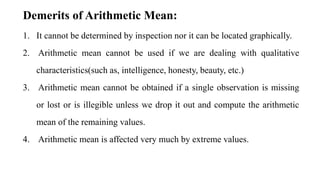
MEASURES
OF
CENTRAL TENDENCIES
Lecture:
Dr. Soya Mathew
CENTRAL TENDENCY:
In a frequency distribution the values cluster around a central
values. This property of concentration of the values around a central
value is called central tendency.
The measure of Central Tendency is also known as the measure of
Location or averages.
 It is a single value which represents the entire data.
 It facilitates comparison between two or more data set
 Arithmetic Mean (AM)
 Median
 Mode
Types of Central Tendency:
The ‘Arithmetic Mean’ (or simply ‘mean’) represented by
𝑥 is a most common measure of central tendency. The mean is a
common measure in which all the values play an equal role and is
used to obtain summary measure.
The A.M of a set of observations is the quotient that results
when the sum of these observations is divided by the number of
observations.
Arithmetic Mean (A.M.):
Let 𝑥1, 𝑥2, 𝑥3,…𝑥𝑛 are n variates or observations. Then
the Arithmetic Mean is denoted and defined as
𝑥 =
𝑥1+𝑥2+…+𝑥𝑛
𝑛
⟹ 𝑥 =
𝑥𝑖
𝑛
Where 𝑥𝑖 is the sum of the observations.
Arithmetic Mean (A.M) for Individual Series (raw data)
1. Hourly production of a manufacturing plant for eight hours is 1200, 1190,1210, 1180,
1190, 1220, 1230, 1180. Calculate the average production per hour.
Solution:
We have
𝑥 =
𝑥1+𝑥2+…+𝑥𝑛
𝑛
⟹ 𝑥 =
1200+1190+1210+1180+1190+1220+1230+1180
8
⟹ 𝑥 =
9600
8
⟹ 𝑥 = 1200
∴ Average production per hour is 1200
Problems:
2. Find the mean driving speed for 6 different cars on the same highway. 66
mph, 57 mph, 71 mph, 54 mph, 69 mph, 58 mph.
Solution:
We have
𝑥 =
𝑥1+𝑥2+…+𝑥𝑛
𝑛
⟹ 𝑥 =
66+57+71+54+69+58
6
⟹ 𝑥 =
375
6
⟹ 𝑥 = 62.5 mph
∴ Average driving speed is 62.5 mph
3. If the arithmetic mean of 14 observations 26, 12, 14, 15, 𝑥, 17, 9, 11, 18, 16, 28, 20, 22, 8 is
17. Find the missing observation.
Solution:
14 observations are 26, 12, 14, 15, 𝑥, 17, 9, 11, 18, 16, 28, 20, 22, 8
Given A. M, 𝑥 = 17
𝑥 =
𝑥1+𝑥2+…+𝑥𝑛
𝑛
⟹ 17 =
26+12+14+15+𝑥+17+9+11+18+16+28+20+22+8
14
⟹ 17 × 14 = 216 + 𝑥
⟹ 238 = 216 + 𝑥
⟹ 𝑥 = 238 − 216
⟹ 𝑥 = 22 is the missing observation
4. In a one day cricket match a bowler bowls 8 overs. He gives away 3, 5, 12,
0, 4, 1, 3, 7 runs in these overs. Find the mean run rate per over. (H.W)
Solution:
We have
𝑥 =
𝑥1+𝑥2+…+𝑥𝑛
𝑛
⟹ 𝑥 =
3+5+12+0+4+1+3+7
8
⟹ 𝑥 =
35
8
⟹ 𝑥 = 4.375 runs per over
Let 𝑥1, 𝑥2, 𝑥3,…𝑥𝑛 are n observations having frequencies
𝑓1, 𝑓2, 𝑓3,…𝑓𝑛. Then the Arithmetic Mean is denoted and defined
as
𝑥 =
𝑓1𝑥1+𝑓2𝑥2+…+𝑓𝑛𝑥𝑛
𝑓1+𝑓2+…+𝑓𝑛
⟹ 𝑥 =
𝑓𝑖𝑥𝑖
𝑓𝑖
⟹ 𝑥 =
𝑓𝑖𝑥𝑖
𝑁
where 𝑁 = 𝑓𝑖
Arithmetic Mean (A.M) for Discrete Series
1. The students in a Statistics class were trying to study the heights of
participants in a sports meet. They collected the height of 20
participants, as displayed in the table. Calculate the mean height of the
participants.
Problems:
Solution:
𝑥 =
𝑓𝑖𝑥𝑖
𝑁
⟹ 𝑥 =
1200
20
⟹ 𝑥 = 60
∴ 𝑚𝑒𝑎𝑛 ℎ𝑒𝑖𝑔ℎ𝑡 = 60 𝑖𝑛𝑐ℎ𝑒𝑠
Height in inches
(𝑥)
No. of Participants (𝑓) 𝑓𝑥
49 1 49
53 2 106
54 4 216
55 5 275
66 3 198
68 2 136
70 2 140
80 1 80
Total 20 1200
2. A proof reads through 73 pages manuscript. The number of mistakes found on each of the pages are
summarized in the table below. Determine the mean number of mistakes found per page.
Solution:
𝑥 =
𝑓𝑖𝑥𝑖
𝑁
No. of Mistakes
(𝑥)
No. of Participants (𝑓) 𝑓𝑥
1 5 5
2 9 18
3 12 36
4 17 68
5 14 70
6 10 60
7 6 42
Total 73 299
Solution:
𝑥 =
𝑓𝑖𝑥𝑖
𝑁
⟹ 𝑥 =
299
73
⟹ 𝑥 = 4.095
∴ Mean number of mistakes is 4
No. of Mistakes
(𝑥)
No. of Participants
(𝑓)
𝑓𝑥
1 5 5
2 9 18
3 12 36
4 17 68
5 14 70
6 10 60
7 6 42
Total 73 299
3. From the following data for calculation of arithmetic mean, find the
missing frequency. Given mean=31.
Solution:
Let 𝑚 be the unknown frequency
Given 𝑥 = 31
𝑥 𝑓 𝑓𝑥
10 8
20 12
30 20
40 10
50 𝑚
60 4
𝒙 10 20 30 40 50 60
𝒇 8 12 20 10 ? 4
𝑥 =
𝑓𝑖𝑥𝑖
𝑁
⟹ 31 =
1560+50𝑚
54+𝑚
⟹ 31 54 + 𝑚 = 1560 + 50𝑚
⟹ 1674 + 31𝑚 = 1560 + 50𝑚
⟹ 19𝑚 = 114
⟹ 𝑚 = 6
𝑥 𝑓 𝑓𝑥
10 8 80
20 12 240
30 20 600
40 10 400
50 𝑚 50𝑚
60 4 240
Total 54 + 𝑚 1560 + 50𝑚
4. Find the missing frequency from the following distribution if its mean is
15.25
Solution:
Let 𝑚 be the unknown frequency
Given 𝑥 = 15.25
𝒙 10 12 14 16 18 20
𝒇 3 7 ? 20 8 5
𝑥 𝑓 𝑓𝑥
10 3
12 7
14 𝑚
16 20
18 8
20 5
𝑥 =
𝑓𝑖𝑥𝑖
𝑁
⟹ 15.25 =
678+14𝑚
43+𝑚
⟹ 15.25 43 + 𝑚 = 678 + 14𝑚
⟹ 655.75 + 15.25𝑚 = 678 + 14𝑚
⟹ 1.25𝑚 = 22.25
⟹ 𝑚 = 17.8
𝑥 𝑓 𝑓𝑥
10 3 30
12 7 84
14 𝑚 14𝑚
16 20 320
18 8 144
20 5 100
Total 43 + 𝑚 678 + 14𝑚
We have
Then the Arithmetic Mean is denoted and defined as
⟹ 𝑥 =
𝑓𝑖 𝑥𝑖
𝑁
Where 𝑥𝑖 is the mid point of ith class interval
N is the total frequency
Arithmetic Mean (A.M) for Continuous Series
1. Calculate the arithmetic mean for the following data:
Problems:
Marks 0 – 10 10 – 20 20 – 30 30 – 40 40 – 50 50 – 60 60 – 70 70 – 80
No of
Students 5 10 25 30 20 10 5 5
Solution:
𝑥 =
𝑓𝑖𝑥𝑖
𝑁
⟹ 𝑥 =
4000
110
⟹ 𝑥 = 36.36 marks
Marks
(Class
Interval)
Mid Point
𝑥
No. of
Students
(𝑓)
𝑓𝑥
0 – 10 5 5 25
10 – 20 15 10 150
20 – 30 25 25 625
30 – 40 35 30 1050
40 – 50 45 20 900
50 – 60 55 10 550
60 – 70 65 5 325
70 – 80 75 5 375
Total N = 110 4000
2. The table below show the age of 55 patients selected to study the
effectiveness of a particular medicine. Calculate the mean age of the
patients.
Age 0 – 10 10 – 20 20 – 30 30 – 40 40 – 50 50 – 60 60 – 70
No of
Patients 5 7 17 12 5 2 7
Solution:
𝑥 =
𝑓𝑖𝑥𝑖
𝑁
⟹ 𝑥 =
1765
55
⟹ 𝑥 = 32.09
Age
(Class
Interval)
Mid Point
𝑥
No. of Patients
(𝑓)
𝑓𝑥
0 – 10 5 5 25
10 – 20 15 7 105
20 – 30 25 17 425
30 – 40 35 12 420
40 – 50 45 5 225
50 – 60 55 2 110
60 – 70 65 7 455
Total N = 55 1765
3. Calculate the arithmetic mean for the following data:
Temperature (°𝑪) −𝟒𝟎 − (−𝟑𝟎) −𝟑𝟎 − (−𝟐𝟎) −𝟐𝟎 − (−𝟏𝟎) −𝟏𝟎 − 𝟎 0 – 10 10 – 20 20 – 30
No of Days 10 28 30 42 65 180 10
Solution:
𝑥 =
𝑓𝑖𝑥𝑖
𝑁
⟹ 𝑥 =
1565
365
⟹ 𝑥 = 4.29 °𝐶
Temperature
(°𝑪)
(Class Interval)
Mid
Point
𝑥
No. of Patients
(𝑓)
𝑓𝑥
−𝟒𝟎 − (−𝟑𝟎) −𝟑5 10 −𝟑50
−𝟑𝟎 − (−𝟐𝟎) −𝟐5 28 −𝟕𝟎𝟎
−𝟐𝟎 − (−𝟏𝟎) −𝟏5 30 −𝟒50
−𝟏𝟎 − 𝟎 −5 42 −𝟐𝟏𝟎
0 – 10 5 65 325
10 – 20 15 180 2700
20 – 30 25 10 250
Total N = 365 1565
4. Calculate the arithmetic mean for the following data:
Marks More
than 0
More
than 10
More
than 20
More
than 30
More
than 40
More
than 50
More
than 60
More
than 70
No of
Students 150 140 100 80 80 70 30 14
Solution:
𝑥 =
𝑓𝑖𝑥𝑖
𝑁
⟹ 𝑥 =
5890
150
⟹ 𝑥 = 39.266
Thus the mean mark of the
continuous series is 39.27
Marks
(Class
Interval)
Mid Point
𝑥
No. of Students
(𝑓)
𝑓𝑥
0 – 10 5 150 – 140 = 10 50
10 – 20 15 140 – 100 = 40 600
20 – 30 25 100 – 80 = 20 500
30 – 40 35 80 – 80 = 0 0
40 – 50 45 80 – 70 = 10 450
50 – 60 55 70 – 30 = 40 2200
60 – 70 65 30 – 14 = 16 1040
70 – 80 75 14 – 0 = 14 1050
Total N = 150 5890
5. The following table shows the age of workers in a factory. Find out the
average age of workers.
Solution:
Age 20 – 29 30 – 39 40 – 49 50 – 59 60 – 69
No of
Workers 10 8 6 4 2
Age
(Class
Interval)
Mid Point
𝑥
No. of Workers
(𝑓)
𝑓𝑥
20 – 29 10
30 – 39 8
40 – 49 6
50 – 59 4
60 – 69 2
Solution:
𝑥 =
𝑓𝑖𝑥𝑖
𝑁
⟹ 𝑥 =
1135
30
⟹ 𝑥 = 37.83
Average age of workers is
37.83 years
Age
(Class
Interval)
Mid Point
𝑥
No. of Workers
(𝑓)
𝑓𝑥
20 – 29 24.5 10 245
30 – 39 34.5 8 276
40 – 49 44.5 6 267
50 – 59 54.4 4 218
60 – 69 64.5 2 129
Total 30 1135
6. Find the missing frequency of the following data if the arithmetic mean is
25.4
Solution:
Let 𝑚 be the unknown
frequency
Given 𝑥 = 25.4
Class Interval 10 – 20 20 – 30 30 – 40 40 – 50 50 – 60
Frequency 20 15 10 ? 2
Class
Interval
Mid Point
𝑥
Frequency
(𝑓)
𝑓𝑥
10 – 20 20
20 – 30 15
30 – 40 10
40 – 50 𝑚
50 – 60 2
Total
𝑥 =
𝑓𝑖𝑥𝑖
𝑁
⟹ 25.4 =
1135+45𝑚
47+𝑚
⟹ 25.4 47 + 𝑚 = 1135 + 45𝑚
⟹ 1193.8 + 25.4𝑚 = 1135 + 45𝑚
⟹ 19.6 𝑚 = 58.8
⟹ 𝑚 = 3
Class
Interval
Mid Point
𝑥
Frequency
(𝑓)
𝑓𝑥
10 – 20 15 20 300
20 – 30 25 15 375
30 – 40 35 10 350
40 – 50 45 𝑚 45𝑚
50 – 60 55 2 110
Total 47 + 𝑚 1135 + 45𝑚
7. Find the missing frequencies 𝑚 and 𝑛 in the table given below, it is being
given that the mean of the given frequency distribution is 50.
Solution:
Given 𝑥 = 50
We have
𝑥 =
𝑓𝑖𝑥𝑖
𝑁
Class 0 – 20 20 – 40 40 – 60 60 – 80 80 – 100 Total
Frequency 17 𝑚 32 𝑛 19 120
Class
Interval
Mid Point
𝑥
Frequency
(𝑓)
𝑓𝑥
0 – 20 17
20 – 40 𝑚
40 – 60 32
60 – 80 𝑛
80 – 100 19
Total 120
⟹ 50 =
3480+ 30𝑚 + 70𝑛
68 + 𝑚 + 𝑛
⟹ 50(68 + 𝑚 + 𝑛) = 3480+ 30𝑚 + 70𝑛
⟹ 3400 + 50𝑚 + 50𝑛 = 3480 + 30𝑚 + 70𝑛
⟹ 20𝑚 − 20𝑛 = 80
⟹ 𝑚 − 𝑛 = 4 … … (1)
Also, 68+𝑚+𝑛=120
⟹ 𝑚 + 𝑛 = 52 … … (2)
Solving (1) and (2), we get
𝑚 = 28
𝑛 = 24
Class
Interval
Mid Point
𝑥
Frequency (𝑓) 𝑓𝑥
0 – 20 10 17 170
20 – 40 30 𝑚 30 𝑚
40 – 60 50 32 1600
60 – 80 70 𝑛 70 𝑛
80 – 100 90 19 1710
Total 68 + 𝑚 + 𝑛 = 120 3480 + 30𝑚 + 70𝑛
8. The average age of 20 students in a class is 16 years. One student whose age is 18 years has left the class.
Find out average age of rest of the students.
Solution:
Given, 𝑥 = 16 and 𝑁 = 20
We have 𝑥 =
𝑥𝑖
𝑁
⟹ 16 =
𝑥𝑖
20
⟹ 𝑥𝑖 = 320
⟹ Total age of 20 students = 320
Total age of 19 students = 320 − 18 = 302
∴ average age of 19 students =
302
19
= 15.89 years
9. The mean marks got by 300 students in statistics was 45. The mean of the top 100 of them was found to be 70 and the
mean of the last 100 was known to be 20 . Find the mean of the remaining 100 students.
Solution:
We have 𝑥 =
𝑥𝑖
𝑁
Mean mark of 300 students in statistics, 𝑥 = 45
Total marks of 300 students = 45 × 300 = 13500
Mean mark of top 100 students in statistics, 𝑥 = 70
Total marks of top 100 students = 70 × 100 = 7000
Mean mark of last 100 students in statistics, 𝑥 = 20
Total marks of last 100 students = 20 × 100 = 2000
Total marks of remaining 100 students = 13500 − (7000 + 2000) = 4500
∴ Mean mark of remaining 100 students =
4500
100
= 45
10. The mean of a group of 100 observations is known to be 50. Later it was discovered that
two observations were misread as 92 and 8 instead of 192 and 88. Find the correct mean.
Solution:
Given, 𝑥 = 50 and 𝑁 = 100
We have 𝑥 =
𝑥𝑖
𝑁
Sum of 100 observations = 50 × 100 = 5000
Given that the observations 192 and 88 were misread as 92 and 8.
∴ the corrected sum = 5000 + 192 + 88 − 92 − 8 = 5180
∴ Corrected mean =
5180
100
= 51.80
Usually in computing Arithmetic Mean, equal importance is given to
all the observations of the data. However there are cases where all the items
are not of equal importance. In other words some items of a series are more
important as compared to the other items in the same series.
Def: Weighted mean is the mean of a set of values wherein each value or
measurement has a different weight or degree of importance. The following
is its formula:
𝑥 =
𝑥𝑊
𝑊
Where, 𝑥 is mean, W=number of measurements
Weighted Arithmetic Mean:
1. A student’s final scores in Mathematics, Physics, Chemistry and English are respectively 82, 86, 90 and 70.
If the respective credits received for these courses are 3, 5, 3, and 1, determine the average score.
Solution:
Here the weights associated to the observations 82, 86, 90 and 70 are 3, 5, 3 and 1
𝑥 : 82 86 90 70
𝑤 : 3 5 3 1
Average Score, 𝑥 =
𝑥𝑊
𝑊
⟹ 𝑥 =
(82) (3)+(86)(5)+(90)(3)+(70)(1)
3+5+3+1
⟹ 𝑥 =
246+430+270+70
12
⟹ 𝑥 =
1016
12
⟹ 𝑥 = 84.67
2. A contractor employs three types of workers, male, female and children. To a male
he pays Rs.40 per days. To a female worker Rs.32 per day and to a child worker
Rs.15 per day. The number of male, female and children workers employed is 20,
15 and 15 respectively. Find out the average amount.
Solution: Daily Wages in
Rs. (𝑥)
No: of Workers (𝑊) 𝑥𝑾
40 20
32 15
15 15
Total
Calculation of Weighted A.M:
𝑥 =
𝑥𝑊
𝑊
⟹ 𝑥 =
1505
50
⟹ 𝑥 = 30.10 Rs.
Daily Wages in
Rs. (𝑥)
No: of Workers (𝑊) 𝑥𝑾
40 20 800
32 15 480
15 15 225
Total 50 1505
If we have arithmetic mean, and the number of items of two or
more than two related groups , we can calculate the combined average of
these groups by applying the formula.
𝑥 1,2…,𝑛=
𝑛1𝑥 1+𝑛2𝑥 2+⋯+𝑛𝑛𝑥 𝑛
𝑛1+𝑛2+⋯+𝑛𝑛
Where 𝑥1 = A.M of the first group, 𝑥2 = A.M of the second group, …
𝑛1= Number of items in the first group,
𝑛2= Number of items in the second group, …
Combined Arithmetic Mean:
Example:
1. The arithmetic mean age of the first group of 80 boys is 10 years, and that of the second
group of 20 boys is 15 years. Find the arithmetic mean of the two groups taken together.
Solution:
Given 𝑛1=80, 𝑥1 =10, 𝑛2=20, 𝑥2 =15
We have, 𝑥 1,2=
𝑛1𝑥 1+𝑛2𝑥 2
𝑛1+𝑛2
⟹ 𝑥 1,2=
80)(10 + 20)(15
80+20
⟹ 𝑥 1,2=
800+300
100
⟹ 𝑥 1,2=
1100
100
= 11 years
.
2. The mean marks got by 300 students in the subject of statistics was 45. The mean of the top 100 of them
was found to be 70 and the mean of the last 100 was known to be 20. What is the mean marks of the
remaining students?
Solution:
Given 𝑛1=100, 𝑥1 =70, 𝑛2=100, 𝑥2 = 𝑥, 𝑛3=100, 𝑥3 = 20,
𝑥 1,2,3= 45, 𝑛𝑖 = 300
We have, 𝑥 1,2,3=
𝑛1𝑥 1+ 𝑛2𝑥 2 + 𝑛3𝑥 3
𝑛1 + 𝑛2 + 𝑛2
⟹ 45=
100)(70 + 100)(𝑥 + (100)(20)
300
⟹ 13500=7000 + 100 𝑥 + 2000
⟹ 13500 = 9000 + 100 𝑥
⟹ 100 𝑥 = 4500
⟹ 𝑥 = 45
1. It is rigidly defined.
2. It is easy to understand and easy to calculate.
3. It is based upon all the observations.
4. It is capable of further statistical analysis.
5. It is more stable than any other average.
Merits of Arithmetic Mean:
1. It cannot be determined by inspection nor it can be located graphically.
2. Arithmetic mean cannot be used if we are dealing with qualitative
characteristics(such as, intelligence, honesty, beauty, etc.)
3. Arithmetic mean cannot be obtained if a single observation is missing
or lost or is illegible unless we drop it out and compute the arithmetic
mean of the remaining values.
4. Arithmetic mean is affected very much by extreme values.
Demerits of Arithmetic Mean:
Arithmetic mean

Arithmetic mean

  • 1.
  • 2.
    CENTRAL TENDENCY: In afrequency distribution the values cluster around a central values. This property of concentration of the values around a central value is called central tendency. The measure of Central Tendency is also known as the measure of Location or averages.  It is a single value which represents the entire data.  It facilitates comparison between two or more data set
  • 3.
     Arithmetic Mean(AM)  Median  Mode Types of Central Tendency:
  • 4.
    The ‘Arithmetic Mean’(or simply ‘mean’) represented by 𝑥 is a most common measure of central tendency. The mean is a common measure in which all the values play an equal role and is used to obtain summary measure. The A.M of a set of observations is the quotient that results when the sum of these observations is divided by the number of observations. Arithmetic Mean (A.M.):
  • 5.
    Let 𝑥1, 𝑥2,𝑥3,…𝑥𝑛 are n variates or observations. Then the Arithmetic Mean is denoted and defined as 𝑥 = 𝑥1+𝑥2+…+𝑥𝑛 𝑛 ⟹ 𝑥 = 𝑥𝑖 𝑛 Where 𝑥𝑖 is the sum of the observations. Arithmetic Mean (A.M) for Individual Series (raw data)
  • 6.
    1. Hourly productionof a manufacturing plant for eight hours is 1200, 1190,1210, 1180, 1190, 1220, 1230, 1180. Calculate the average production per hour. Solution: We have 𝑥 = 𝑥1+𝑥2+…+𝑥𝑛 𝑛 ⟹ 𝑥 = 1200+1190+1210+1180+1190+1220+1230+1180 8 ⟹ 𝑥 = 9600 8 ⟹ 𝑥 = 1200 ∴ Average production per hour is 1200 Problems:
  • 7.
    2. Find themean driving speed for 6 different cars on the same highway. 66 mph, 57 mph, 71 mph, 54 mph, 69 mph, 58 mph. Solution: We have 𝑥 = 𝑥1+𝑥2+…+𝑥𝑛 𝑛 ⟹ 𝑥 = 66+57+71+54+69+58 6 ⟹ 𝑥 = 375 6 ⟹ 𝑥 = 62.5 mph ∴ Average driving speed is 62.5 mph
  • 8.
    3. If thearithmetic mean of 14 observations 26, 12, 14, 15, 𝑥, 17, 9, 11, 18, 16, 28, 20, 22, 8 is 17. Find the missing observation. Solution: 14 observations are 26, 12, 14, 15, 𝑥, 17, 9, 11, 18, 16, 28, 20, 22, 8 Given A. M, 𝑥 = 17 𝑥 = 𝑥1+𝑥2+…+𝑥𝑛 𝑛 ⟹ 17 = 26+12+14+15+𝑥+17+9+11+18+16+28+20+22+8 14 ⟹ 17 × 14 = 216 + 𝑥 ⟹ 238 = 216 + 𝑥 ⟹ 𝑥 = 238 − 216 ⟹ 𝑥 = 22 is the missing observation
  • 9.
    4. In aone day cricket match a bowler bowls 8 overs. He gives away 3, 5, 12, 0, 4, 1, 3, 7 runs in these overs. Find the mean run rate per over. (H.W) Solution: We have 𝑥 = 𝑥1+𝑥2+…+𝑥𝑛 𝑛 ⟹ 𝑥 = 3+5+12+0+4+1+3+7 8 ⟹ 𝑥 = 35 8 ⟹ 𝑥 = 4.375 runs per over
  • 10.
    Let 𝑥1, 𝑥2,𝑥3,…𝑥𝑛 are n observations having frequencies 𝑓1, 𝑓2, 𝑓3,…𝑓𝑛. Then the Arithmetic Mean is denoted and defined as 𝑥 = 𝑓1𝑥1+𝑓2𝑥2+…+𝑓𝑛𝑥𝑛 𝑓1+𝑓2+…+𝑓𝑛 ⟹ 𝑥 = 𝑓𝑖𝑥𝑖 𝑓𝑖 ⟹ 𝑥 = 𝑓𝑖𝑥𝑖 𝑁 where 𝑁 = 𝑓𝑖 Arithmetic Mean (A.M) for Discrete Series
  • 11.
    1. The studentsin a Statistics class were trying to study the heights of participants in a sports meet. They collected the height of 20 participants, as displayed in the table. Calculate the mean height of the participants. Problems:
  • 12.
    Solution: 𝑥 = 𝑓𝑖𝑥𝑖 𝑁 ⟹ 𝑥= 1200 20 ⟹ 𝑥 = 60 ∴ 𝑚𝑒𝑎𝑛 ℎ𝑒𝑖𝑔ℎ𝑡 = 60 𝑖𝑛𝑐ℎ𝑒𝑠 Height in inches (𝑥) No. of Participants (𝑓) 𝑓𝑥 49 1 49 53 2 106 54 4 216 55 5 275 66 3 198 68 2 136 70 2 140 80 1 80 Total 20 1200
  • 13.
    2. A proofreads through 73 pages manuscript. The number of mistakes found on each of the pages are summarized in the table below. Determine the mean number of mistakes found per page. Solution: 𝑥 = 𝑓𝑖𝑥𝑖 𝑁 No. of Mistakes (𝑥) No. of Participants (𝑓) 𝑓𝑥 1 5 5 2 9 18 3 12 36 4 17 68 5 14 70 6 10 60 7 6 42 Total 73 299
  • 14.
    Solution: 𝑥 = 𝑓𝑖𝑥𝑖 𝑁 ⟹ 𝑥= 299 73 ⟹ 𝑥 = 4.095 ∴ Mean number of mistakes is 4 No. of Mistakes (𝑥) No. of Participants (𝑓) 𝑓𝑥 1 5 5 2 9 18 3 12 36 4 17 68 5 14 70 6 10 60 7 6 42 Total 73 299
  • 15.
    3. From thefollowing data for calculation of arithmetic mean, find the missing frequency. Given mean=31. Solution: Let 𝑚 be the unknown frequency Given 𝑥 = 31 𝑥 𝑓 𝑓𝑥 10 8 20 12 30 20 40 10 50 𝑚 60 4 𝒙 10 20 30 40 50 60 𝒇 8 12 20 10 ? 4
  • 16.
    𝑥 = 𝑓𝑖𝑥𝑖 𝑁 ⟹ 31= 1560+50𝑚 54+𝑚 ⟹ 31 54 + 𝑚 = 1560 + 50𝑚 ⟹ 1674 + 31𝑚 = 1560 + 50𝑚 ⟹ 19𝑚 = 114 ⟹ 𝑚 = 6 𝑥 𝑓 𝑓𝑥 10 8 80 20 12 240 30 20 600 40 10 400 50 𝑚 50𝑚 60 4 240 Total 54 + 𝑚 1560 + 50𝑚
  • 17.
    4. Find themissing frequency from the following distribution if its mean is 15.25 Solution: Let 𝑚 be the unknown frequency Given 𝑥 = 15.25 𝒙 10 12 14 16 18 20 𝒇 3 7 ? 20 8 5 𝑥 𝑓 𝑓𝑥 10 3 12 7 14 𝑚 16 20 18 8 20 5
  • 18.
    𝑥 = 𝑓𝑖𝑥𝑖 𝑁 ⟹ 15.25= 678+14𝑚 43+𝑚 ⟹ 15.25 43 + 𝑚 = 678 + 14𝑚 ⟹ 655.75 + 15.25𝑚 = 678 + 14𝑚 ⟹ 1.25𝑚 = 22.25 ⟹ 𝑚 = 17.8 𝑥 𝑓 𝑓𝑥 10 3 30 12 7 84 14 𝑚 14𝑚 16 20 320 18 8 144 20 5 100 Total 43 + 𝑚 678 + 14𝑚
  • 19.
    We have Then theArithmetic Mean is denoted and defined as ⟹ 𝑥 = 𝑓𝑖 𝑥𝑖 𝑁 Where 𝑥𝑖 is the mid point of ith class interval N is the total frequency Arithmetic Mean (A.M) for Continuous Series
  • 20.
    1. Calculate thearithmetic mean for the following data: Problems: Marks 0 – 10 10 – 20 20 – 30 30 – 40 40 – 50 50 – 60 60 – 70 70 – 80 No of Students 5 10 25 30 20 10 5 5
  • 21.
    Solution: 𝑥 = 𝑓𝑖𝑥𝑖 𝑁 ⟹ 𝑥= 4000 110 ⟹ 𝑥 = 36.36 marks Marks (Class Interval) Mid Point 𝑥 No. of Students (𝑓) 𝑓𝑥 0 – 10 5 5 25 10 – 20 15 10 150 20 – 30 25 25 625 30 – 40 35 30 1050 40 – 50 45 20 900 50 – 60 55 10 550 60 – 70 65 5 325 70 – 80 75 5 375 Total N = 110 4000
  • 22.
    2. The tablebelow show the age of 55 patients selected to study the effectiveness of a particular medicine. Calculate the mean age of the patients. Age 0 – 10 10 – 20 20 – 30 30 – 40 40 – 50 50 – 60 60 – 70 No of Patients 5 7 17 12 5 2 7
  • 23.
    Solution: 𝑥 = 𝑓𝑖𝑥𝑖 𝑁 ⟹ 𝑥= 1765 55 ⟹ 𝑥 = 32.09 Age (Class Interval) Mid Point 𝑥 No. of Patients (𝑓) 𝑓𝑥 0 – 10 5 5 25 10 – 20 15 7 105 20 – 30 25 17 425 30 – 40 35 12 420 40 – 50 45 5 225 50 – 60 55 2 110 60 – 70 65 7 455 Total N = 55 1765
  • 24.
    3. Calculate thearithmetic mean for the following data: Temperature (°𝑪) −𝟒𝟎 − (−𝟑𝟎) −𝟑𝟎 − (−𝟐𝟎) −𝟐𝟎 − (−𝟏𝟎) −𝟏𝟎 − 𝟎 0 – 10 10 – 20 20 – 30 No of Days 10 28 30 42 65 180 10
  • 25.
    Solution: 𝑥 = 𝑓𝑖𝑥𝑖 𝑁 ⟹ 𝑥= 1565 365 ⟹ 𝑥 = 4.29 °𝐶 Temperature (°𝑪) (Class Interval) Mid Point 𝑥 No. of Patients (𝑓) 𝑓𝑥 −𝟒𝟎 − (−𝟑𝟎) −𝟑5 10 −𝟑50 −𝟑𝟎 − (−𝟐𝟎) −𝟐5 28 −𝟕𝟎𝟎 −𝟐𝟎 − (−𝟏𝟎) −𝟏5 30 −𝟒50 −𝟏𝟎 − 𝟎 −5 42 −𝟐𝟏𝟎 0 – 10 5 65 325 10 – 20 15 180 2700 20 – 30 25 10 250 Total N = 365 1565
  • 26.
    4. Calculate thearithmetic mean for the following data: Marks More than 0 More than 10 More than 20 More than 30 More than 40 More than 50 More than 60 More than 70 No of Students 150 140 100 80 80 70 30 14
  • 27.
    Solution: 𝑥 = 𝑓𝑖𝑥𝑖 𝑁 ⟹ 𝑥= 5890 150 ⟹ 𝑥 = 39.266 Thus the mean mark of the continuous series is 39.27 Marks (Class Interval) Mid Point 𝑥 No. of Students (𝑓) 𝑓𝑥 0 – 10 5 150 – 140 = 10 50 10 – 20 15 140 – 100 = 40 600 20 – 30 25 100 – 80 = 20 500 30 – 40 35 80 – 80 = 0 0 40 – 50 45 80 – 70 = 10 450 50 – 60 55 70 – 30 = 40 2200 60 – 70 65 30 – 14 = 16 1040 70 – 80 75 14 – 0 = 14 1050 Total N = 150 5890
  • 28.
    5. The followingtable shows the age of workers in a factory. Find out the average age of workers. Solution: Age 20 – 29 30 – 39 40 – 49 50 – 59 60 – 69 No of Workers 10 8 6 4 2 Age (Class Interval) Mid Point 𝑥 No. of Workers (𝑓) 𝑓𝑥 20 – 29 10 30 – 39 8 40 – 49 6 50 – 59 4 60 – 69 2
  • 29.
    Solution: 𝑥 = 𝑓𝑖𝑥𝑖 𝑁 ⟹ 𝑥= 1135 30 ⟹ 𝑥 = 37.83 Average age of workers is 37.83 years Age (Class Interval) Mid Point 𝑥 No. of Workers (𝑓) 𝑓𝑥 20 – 29 24.5 10 245 30 – 39 34.5 8 276 40 – 49 44.5 6 267 50 – 59 54.4 4 218 60 – 69 64.5 2 129 Total 30 1135
  • 30.
    6. Find themissing frequency of the following data if the arithmetic mean is 25.4 Solution: Let 𝑚 be the unknown frequency Given 𝑥 = 25.4 Class Interval 10 – 20 20 – 30 30 – 40 40 – 50 50 – 60 Frequency 20 15 10 ? 2 Class Interval Mid Point 𝑥 Frequency (𝑓) 𝑓𝑥 10 – 20 20 20 – 30 15 30 – 40 10 40 – 50 𝑚 50 – 60 2 Total
  • 31.
    𝑥 = 𝑓𝑖𝑥𝑖 𝑁 ⟹ 25.4= 1135+45𝑚 47+𝑚 ⟹ 25.4 47 + 𝑚 = 1135 + 45𝑚 ⟹ 1193.8 + 25.4𝑚 = 1135 + 45𝑚 ⟹ 19.6 𝑚 = 58.8 ⟹ 𝑚 = 3 Class Interval Mid Point 𝑥 Frequency (𝑓) 𝑓𝑥 10 – 20 15 20 300 20 – 30 25 15 375 30 – 40 35 10 350 40 – 50 45 𝑚 45𝑚 50 – 60 55 2 110 Total 47 + 𝑚 1135 + 45𝑚
  • 32.
    7. Find themissing frequencies 𝑚 and 𝑛 in the table given below, it is being given that the mean of the given frequency distribution is 50. Solution: Given 𝑥 = 50 We have 𝑥 = 𝑓𝑖𝑥𝑖 𝑁 Class 0 – 20 20 – 40 40 – 60 60 – 80 80 – 100 Total Frequency 17 𝑚 32 𝑛 19 120 Class Interval Mid Point 𝑥 Frequency (𝑓) 𝑓𝑥 0 – 20 17 20 – 40 𝑚 40 – 60 32 60 – 80 𝑛 80 – 100 19 Total 120
  • 33.
    ⟹ 50 = 3480+30𝑚 + 70𝑛 68 + 𝑚 + 𝑛 ⟹ 50(68 + 𝑚 + 𝑛) = 3480+ 30𝑚 + 70𝑛 ⟹ 3400 + 50𝑚 + 50𝑛 = 3480 + 30𝑚 + 70𝑛 ⟹ 20𝑚 − 20𝑛 = 80 ⟹ 𝑚 − 𝑛 = 4 … … (1) Also, 68+𝑚+𝑛=120 ⟹ 𝑚 + 𝑛 = 52 … … (2) Solving (1) and (2), we get 𝑚 = 28 𝑛 = 24 Class Interval Mid Point 𝑥 Frequency (𝑓) 𝑓𝑥 0 – 20 10 17 170 20 – 40 30 𝑚 30 𝑚 40 – 60 50 32 1600 60 – 80 70 𝑛 70 𝑛 80 – 100 90 19 1710 Total 68 + 𝑚 + 𝑛 = 120 3480 + 30𝑚 + 70𝑛
  • 34.
    8. The averageage of 20 students in a class is 16 years. One student whose age is 18 years has left the class. Find out average age of rest of the students. Solution: Given, 𝑥 = 16 and 𝑁 = 20 We have 𝑥 = 𝑥𝑖 𝑁 ⟹ 16 = 𝑥𝑖 20 ⟹ 𝑥𝑖 = 320 ⟹ Total age of 20 students = 320 Total age of 19 students = 320 − 18 = 302 ∴ average age of 19 students = 302 19 = 15.89 years
  • 35.
    9. The meanmarks got by 300 students in statistics was 45. The mean of the top 100 of them was found to be 70 and the mean of the last 100 was known to be 20 . Find the mean of the remaining 100 students. Solution: We have 𝑥 = 𝑥𝑖 𝑁 Mean mark of 300 students in statistics, 𝑥 = 45 Total marks of 300 students = 45 × 300 = 13500 Mean mark of top 100 students in statistics, 𝑥 = 70 Total marks of top 100 students = 70 × 100 = 7000 Mean mark of last 100 students in statistics, 𝑥 = 20 Total marks of last 100 students = 20 × 100 = 2000 Total marks of remaining 100 students = 13500 − (7000 + 2000) = 4500 ∴ Mean mark of remaining 100 students = 4500 100 = 45
  • 36.
    10. The meanof a group of 100 observations is known to be 50. Later it was discovered that two observations were misread as 92 and 8 instead of 192 and 88. Find the correct mean. Solution: Given, 𝑥 = 50 and 𝑁 = 100 We have 𝑥 = 𝑥𝑖 𝑁 Sum of 100 observations = 50 × 100 = 5000 Given that the observations 192 and 88 were misread as 92 and 8. ∴ the corrected sum = 5000 + 192 + 88 − 92 − 8 = 5180 ∴ Corrected mean = 5180 100 = 51.80
  • 37.
    Usually in computingArithmetic Mean, equal importance is given to all the observations of the data. However there are cases where all the items are not of equal importance. In other words some items of a series are more important as compared to the other items in the same series. Def: Weighted mean is the mean of a set of values wherein each value or measurement has a different weight or degree of importance. The following is its formula: 𝑥 = 𝑥𝑊 𝑊 Where, 𝑥 is mean, W=number of measurements Weighted Arithmetic Mean:
  • 38.
    1. A student’sfinal scores in Mathematics, Physics, Chemistry and English are respectively 82, 86, 90 and 70. If the respective credits received for these courses are 3, 5, 3, and 1, determine the average score. Solution: Here the weights associated to the observations 82, 86, 90 and 70 are 3, 5, 3 and 1 𝑥 : 82 86 90 70 𝑤 : 3 5 3 1 Average Score, 𝑥 = 𝑥𝑊 𝑊 ⟹ 𝑥 = (82) (3)+(86)(5)+(90)(3)+(70)(1) 3+5+3+1 ⟹ 𝑥 = 246+430+270+70 12 ⟹ 𝑥 = 1016 12 ⟹ 𝑥 = 84.67
  • 39.
    2. A contractoremploys three types of workers, male, female and children. To a male he pays Rs.40 per days. To a female worker Rs.32 per day and to a child worker Rs.15 per day. The number of male, female and children workers employed is 20, 15 and 15 respectively. Find out the average amount. Solution: Daily Wages in Rs. (𝑥) No: of Workers (𝑊) 𝑥𝑾 40 20 32 15 15 15 Total
  • 40.
    Calculation of WeightedA.M: 𝑥 = 𝑥𝑊 𝑊 ⟹ 𝑥 = 1505 50 ⟹ 𝑥 = 30.10 Rs. Daily Wages in Rs. (𝑥) No: of Workers (𝑊) 𝑥𝑾 40 20 800 32 15 480 15 15 225 Total 50 1505
  • 41.
    If we havearithmetic mean, and the number of items of two or more than two related groups , we can calculate the combined average of these groups by applying the formula. 𝑥 1,2…,𝑛= 𝑛1𝑥 1+𝑛2𝑥 2+⋯+𝑛𝑛𝑥 𝑛 𝑛1+𝑛2+⋯+𝑛𝑛 Where 𝑥1 = A.M of the first group, 𝑥2 = A.M of the second group, … 𝑛1= Number of items in the first group, 𝑛2= Number of items in the second group, … Combined Arithmetic Mean:
  • 42.
    Example: 1. The arithmeticmean age of the first group of 80 boys is 10 years, and that of the second group of 20 boys is 15 years. Find the arithmetic mean of the two groups taken together. Solution: Given 𝑛1=80, 𝑥1 =10, 𝑛2=20, 𝑥2 =15 We have, 𝑥 1,2= 𝑛1𝑥 1+𝑛2𝑥 2 𝑛1+𝑛2 ⟹ 𝑥 1,2= 80)(10 + 20)(15 80+20 ⟹ 𝑥 1,2= 800+300 100 ⟹ 𝑥 1,2= 1100 100 = 11 years .
  • 43.
    2. The meanmarks got by 300 students in the subject of statistics was 45. The mean of the top 100 of them was found to be 70 and the mean of the last 100 was known to be 20. What is the mean marks of the remaining students? Solution: Given 𝑛1=100, 𝑥1 =70, 𝑛2=100, 𝑥2 = 𝑥, 𝑛3=100, 𝑥3 = 20, 𝑥 1,2,3= 45, 𝑛𝑖 = 300 We have, 𝑥 1,2,3= 𝑛1𝑥 1+ 𝑛2𝑥 2 + 𝑛3𝑥 3 𝑛1 + 𝑛2 + 𝑛2 ⟹ 45= 100)(70 + 100)(𝑥 + (100)(20) 300 ⟹ 13500=7000 + 100 𝑥 + 2000 ⟹ 13500 = 9000 + 100 𝑥 ⟹ 100 𝑥 = 4500 ⟹ 𝑥 = 45
  • 44.
    1. It isrigidly defined. 2. It is easy to understand and easy to calculate. 3. It is based upon all the observations. 4. It is capable of further statistical analysis. 5. It is more stable than any other average. Merits of Arithmetic Mean:
  • 45.
    1. It cannotbe determined by inspection nor it can be located graphically. 2. Arithmetic mean cannot be used if we are dealing with qualitative characteristics(such as, intelligence, honesty, beauty, etc.) 3. Arithmetic mean cannot be obtained if a single observation is missing or lost or is illegible unless we drop it out and compute the arithmetic mean of the remaining values. 4. Arithmetic mean is affected very much by extreme values. Demerits of Arithmetic Mean: