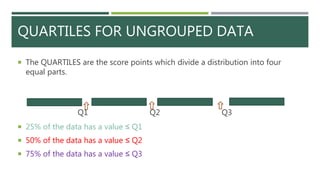
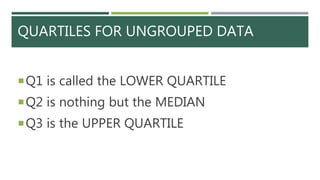
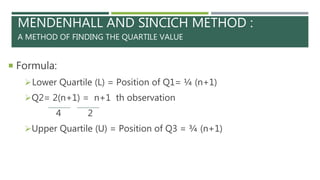
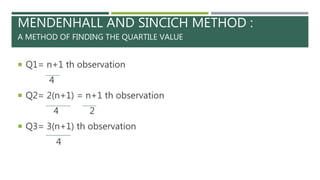
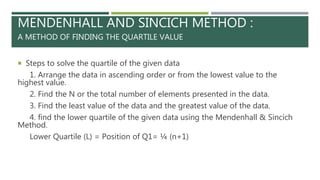
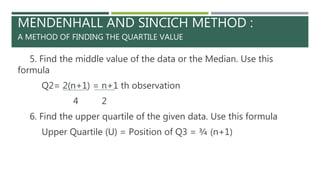
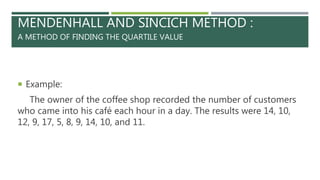
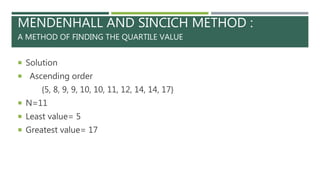
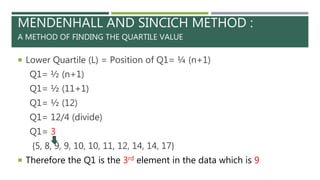
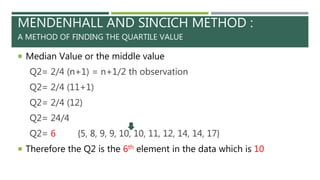
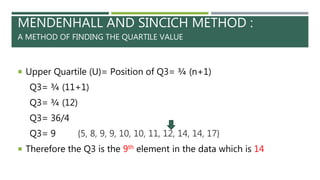
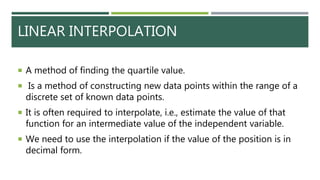
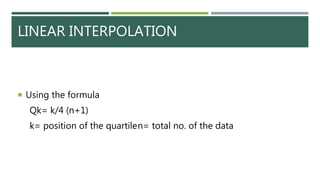
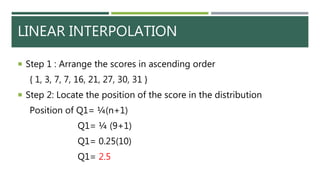
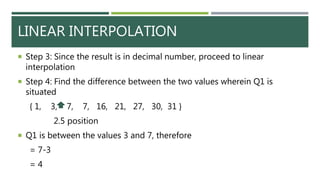
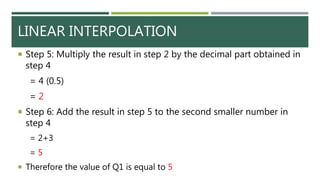
SlideShare a Scribd company logo
MEASURES OF POSITION FOR UNGROUPED DATA:
QUARTILES , DECILES , & PERCENTILES
QUARTILES FOR UNGROUPED DATA
 The QUARTILES are the score points which divide a distribution into four
equal parts.
Q1 Q2 Q3
 25% of the data has a value ≤ Q1
 50% of the data has a value ≤ Q2
 75% of the data has a value ≤ Q3
QUARTILES FOR UNGROUPED DATA
Q1 is called the LOWER QUARTILE
Q2 is nothing but the MEDIAN
Q3 is the UPPER QUARTILE
MENDENHALL AND SINCICH METHOD :
A METHOD OF FINDING THE QUARTILE VALUE
 This method is being developed by William Mendenhall and Terry
Sincich to find the position of the quartile in the given data.
MENDENHALL AND SINCICH METHOD :
A METHOD OF FINDING THE QUARTILE VALUE
 Formula:
Lower Quartile (L) = Position of Q1= ¼ (n+1)
Q2= 2(n+1) = n+1 th observation
4 2
Upper Quartile (U) = Position of Q3 = ¾ (n+1)
MENDENHALL AND SINCICH METHOD :
A METHOD OF FINDING THE QUARTILE VALUE
 N is the number of elements in the data
Example: The manager of a food chain recorded the number of
customers who came to eat the products in each day. The results
were 10,15,14,13,20,19,12 and 11.
 In this example N=8
MENDENHALL AND SINCICH METHOD :
A METHOD OF FINDING THE QUARTILE VALUE
 Q1= n+1 th observation
4
 Q2= 2(n+1) = n+1 th observation
4 2
 Q3= 3(n+1) th observation
4
MENDENHALL AND SINCICH METHOD :
A METHOD OF FINDING THE QUARTILE VALUE
 Steps to solve the quartile of the given data
1. Arrange the data in ascending order or from the lowest value to the
highest value.
2. Find the N or the total number of elements presented in the data.
3. Find the least value of the data and the greatest value of the data.
4. find the lower quartile of the given data using the Mendenhall & Sincich
Method.
Lower Quartile (L) = Position of Q1= ¼ (n+1)
MENDENHALL AND SINCICH METHOD :
A METHOD OF FINDING THE QUARTILE VALUE
5. Find the middle value of the data or the Median. Use this
formula
Q2= 2(n+1) = n+1 th observation
4 2
6. Find the upper quartile of the given data. Use this formula
Upper Quartile (U) = Position of Q3 = ¾ (n+1)
MENDENHALL AND SINCICH METHOD :
A METHOD OF FINDING THE QUARTILE VALUE
 Example:
The owner of the coffee shop recorded the number of customers
who came into his café each hour in a day. The results were 14, 10,
12, 9, 17, 5, 8, 9, 14, 10, and 11.
MENDENHALL AND SINCICH METHOD :
A METHOD OF FINDING THE QUARTILE VALUE
 Solution
 Ascending order
{5, 8, 9, 9, 10, 10, 11, 12, 14, 14, 17}
 N=11
 Least value= 5
 Greatest value= 17
MENDENHALL AND SINCICH METHOD :
A METHOD OF FINDING THE QUARTILE VALUE
 Lower Quartile (L) = Position of Q1= ¼ (n+1)
Q1= ½ (n+1)
Q1= ½ (11+1)
Q1= ½ (12)
Q1= 12/4 (divide)
Q1= 3
{5, 8, 9, 9, 10, 10, 11, 12, 14, 14, 17}
 Therefore the Q1 is the 3rd element in the data which is 9
MENDENHALL AND SINCICH METHOD :
A METHOD OF FINDING THE QUARTILE VALUE
 Median Value or the middle value
Q2= 2/4 (n+1) = n+1/2 th observation
Q2= 2/4 (11+1)
Q2= 2/4 (12)
Q2= 24/4
Q2= 6 {5, 8, 9, 9, 10, 10, 11, 12, 14, 14, 17}
 Therefore the Q2 is the 6th element in the data which is 10
MENDENHALL AND SINCICH METHOD :
A METHOD OF FINDING THE QUARTILE VALUE
 Upper Quartile (U)= Position of Q3= ¾ (n+1)
Q3= ¾ (11+1)
Q3= ¾ (12)
Q3= 36/4
Q3= 9 {5, 8, 9, 9, 10, 10, 11, 12, 14, 14, 17}
 Therefore the Q3 is the 9th element in the data which is 14
LINEAR INTERPOLATION
 A method of finding the quartile value.
 Is a method of constructing new data points within the range of a
discrete set of known data points.
 It is often required to interpolate, i.e., estimate the value of that
function for an intermediate value of the independent variable.
 We need to use the interpolation if the value of the position is in
decimal form.
LINEAR INTERPOLATION
 Using the formula
Qk= k/4 (n+1)
k= position of the quartilen= total no. of the data
LINEAR INTERPOLATION
 Steps in interpolation method
1. Arrange the scores in ascending order
2. Locate the position of the score in the distribution
3. Since the result is in decimal number, proceed to linear
interpolation
4. Find the difference between the two values wherein Q1 is
situated
5. Multiply the result in step 2 by the decimal part obtained in
step 4
6. Add the result in step 5 to the second smaller number in step 4
LINEAR INTERPOLATION
 Example:
Find the first quartile (Q1), and the third quartile (Q3), Given the
scores of 9 students in their mathematics activity using linear
interpolation
{1, 27, 16, 7, 31, 7, 30, 3, 21 }
LINEAR INTERPOLATION
 Step 1 : Arrange the scores in ascending order
{ 1, 3, 7, 7, 16, 21, 27, 30, 31 }
 Step 2: Locate the position of the score in the distribution
Position of Q1= ¼(n+1)
Q1= ¼ (9+1)
Q1= 0.25(10)
Q1= 2.5
LINEAR INTERPOLATION
 Step 3: Since the result is in decimal number, proceed to linear
interpolation
 Step 4: Find the difference between the two values wherein Q1 is
situated
{ 1, 3, 7, 7, 16, 21, 27, 30, 31 }
2.5 position
 Q1 is between the values 3 and 7, therefore
= 7-3
= 4
LINEAR INTERPOLATION
 Step 5: Multiply the result in step 2 by the decimal part obtained in
step 4
= 4 (0.5)
= 2
 Step 6: Add the result in step 5 to the second smaller number in
step 4
= 2+3
= 5
 Therefore the value of Q1 is equal to 5

More Related Content

What's hot

Measures of position
Measures of positionMeasures of position
Measures of position
Erlyn Geronimo
 
Geometric sequences and geometric means
Geometric sequences and geometric meansGeometric sequences and geometric means
Geometric sequences and geometric means
Denmar Marasigan
 
union and intersection of events.ppt
union and intersection of events.pptunion and intersection of events.ppt
union and intersection of events.ppt
Izah Catli
 
PERCENTILE : MEASURES OF POSITION FOR GROUPED DATA
PERCENTILE : MEASURES OF POSITION FOR GROUPED DATA PERCENTILE : MEASURES OF POSITION FOR GROUPED DATA
PERCENTILE : MEASURES OF POSITION FOR GROUPED DATA
Chuckry Maunes
 
MEASURES OF POSITION GROUPED DATA.pptx
MEASURES OF POSITION GROUPED DATA.pptxMEASURES OF POSITION GROUPED DATA.pptx
MEASURES OF POSITION GROUPED DATA.pptx
GeraldCorrales
 
DISTANCE FORMULA (GRADE 10 MATH)
DISTANCE FORMULA (GRADE 10 MATH)DISTANCE FORMULA (GRADE 10 MATH)
DISTANCE FORMULA (GRADE 10 MATH)
daisyree medino
 
Lesson plan (inset demo)
Lesson plan (inset demo)Lesson plan (inset demo)
Lesson plan (inset demo)
Hazel Charise Gonzales
 
measures of position - grade 10 math
measures of position - grade 10 mathmeasures of position - grade 10 math
measures of position - grade 10 math
robengie monera
 
Summative Test on Measures of Position
Summative Test on Measures of PositionSummative Test on Measures of Position
Summative Test on Measures of Position
Joey Valdriz
 
INTERPRETING MEASURE OF POSITION.pptx
INTERPRETING MEASURE OF POSITION.pptxINTERPRETING MEASURE OF POSITION.pptx
INTERPRETING MEASURE OF POSITION.pptx
HannahSheena
 
Geometric Sequence and Geometric Mean
Geometric Sequence and Geometric MeanGeometric Sequence and Geometric Mean
Geometric Sequence and Geometric Mean
Shemm Madrid
 
Permutation
PermutationPermutation
Permutation
Joey Valdriz
 
PERCENTILES FOR GROUPED DATA AND PERCENTILE RANK.pptx
PERCENTILES FOR GROUPED DATA AND PERCENTILE RANK.pptxPERCENTILES FOR GROUPED DATA AND PERCENTILE RANK.pptx
PERCENTILES FOR GROUPED DATA AND PERCENTILE RANK.pptx
rich_26
 
Arithmetic sequence
Arithmetic sequenceArithmetic sequence
Arithmetic sequence
maricel mas
 
Graphing polynomial functions (Grade 10)
Graphing polynomial functions (Grade 10)Graphing polynomial functions (Grade 10)
Graphing polynomial functions (Grade 10)
grace joy canseco
 
Measures of position. gouped data
Measures of position. gouped dataMeasures of position. gouped data
Measures of position. gouped data
Armathia Sambrano
 
permutations power point
permutations power pointpermutations power point
permutations power point
Aldrin Balenton
 
Problem solving involving polynomial function
Problem solving involving polynomial functionProblem solving involving polynomial function
Problem solving involving polynomial function
MartinGeraldine
 
Harmonic sequence and fibonacci 10
Harmonic sequence and fibonacci 10Harmonic sequence and fibonacci 10
Harmonic sequence and fibonacci 10
AjayQuines
 
QUARTILES, DECILES AND PERCENTILES
QUARTILES, DECILES  AND PERCENTILESQUARTILES, DECILES  AND PERCENTILES
QUARTILES, DECILES AND PERCENTILES
MARIA KATRINA MACAPAZ
 

What's hot (20)

Measures of position
Measures of positionMeasures of position
Measures of position
 
Geometric sequences and geometric means
Geometric sequences and geometric meansGeometric sequences and geometric means
Geometric sequences and geometric means
 
union and intersection of events.ppt
union and intersection of events.pptunion and intersection of events.ppt
union and intersection of events.ppt
 
PERCENTILE : MEASURES OF POSITION FOR GROUPED DATA
PERCENTILE : MEASURES OF POSITION FOR GROUPED DATA PERCENTILE : MEASURES OF POSITION FOR GROUPED DATA
PERCENTILE : MEASURES OF POSITION FOR GROUPED DATA
 
MEASURES OF POSITION GROUPED DATA.pptx
MEASURES OF POSITION GROUPED DATA.pptxMEASURES OF POSITION GROUPED DATA.pptx
MEASURES OF POSITION GROUPED DATA.pptx
 
DISTANCE FORMULA (GRADE 10 MATH)
DISTANCE FORMULA (GRADE 10 MATH)DISTANCE FORMULA (GRADE 10 MATH)
DISTANCE FORMULA (GRADE 10 MATH)
 
Lesson plan (inset demo)
Lesson plan (inset demo)Lesson plan (inset demo)
Lesson plan (inset demo)
 
measures of position - grade 10 math
measures of position - grade 10 mathmeasures of position - grade 10 math
measures of position - grade 10 math
 
Summative Test on Measures of Position
Summative Test on Measures of PositionSummative Test on Measures of Position
Summative Test on Measures of Position
 
INTERPRETING MEASURE OF POSITION.pptx
INTERPRETING MEASURE OF POSITION.pptxINTERPRETING MEASURE OF POSITION.pptx
INTERPRETING MEASURE OF POSITION.pptx
 
Geometric Sequence and Geometric Mean
Geometric Sequence and Geometric MeanGeometric Sequence and Geometric Mean
Geometric Sequence and Geometric Mean
 
Permutation
PermutationPermutation
Permutation
 
PERCENTILES FOR GROUPED DATA AND PERCENTILE RANK.pptx
PERCENTILES FOR GROUPED DATA AND PERCENTILE RANK.pptxPERCENTILES FOR GROUPED DATA AND PERCENTILE RANK.pptx
PERCENTILES FOR GROUPED DATA AND PERCENTILE RANK.pptx
 
Arithmetic sequence
Arithmetic sequenceArithmetic sequence
Arithmetic sequence
 
Graphing polynomial functions (Grade 10)
Graphing polynomial functions (Grade 10)Graphing polynomial functions (Grade 10)
Graphing polynomial functions (Grade 10)
 
Measures of position. gouped data
Measures of position. gouped dataMeasures of position. gouped data
Measures of position. gouped data
 
permutations power point
permutations power pointpermutations power point
permutations power point
 
Problem solving involving polynomial function
Problem solving involving polynomial functionProblem solving involving polynomial function
Problem solving involving polynomial function
 
Harmonic sequence and fibonacci 10
Harmonic sequence and fibonacci 10Harmonic sequence and fibonacci 10
Harmonic sequence and fibonacci 10
 
QUARTILES, DECILES AND PERCENTILES
QUARTILES, DECILES  AND PERCENTILESQUARTILES, DECILES  AND PERCENTILES
QUARTILES, DECILES AND PERCENTILES
 

Similar to Quartile (ungrouped)

G10 Math Q4 Week 8 Other forms of position of measure.pptx
G10 Math Q4 Week 8 Other forms of position of measure.pptxG10 Math Q4 Week 8 Other forms of position of measure.pptx
G10 Math Q4 Week 8 Other forms of position of measure.pptx
ArnoldMillones4
 
MEasures of Position.pptx
MEasures of Position.pptxMEasures of Position.pptx
MEasures of Position.pptx
RobertWariza1
 
Measures of Position.pptx
Measures of Position.pptxMeasures of Position.pptx
Measures of Position.pptx
PatrickMaravilla1
 
QUARTILES.pptx
QUARTILES.pptxQUARTILES.pptx
QUARTILES.pptx
ElamJetherTabilog
 
Quartile Deviation.pptx
Quartile Deviation.pptxQuartile Deviation.pptx
Quartile Deviation.pptx
CHIRANTANMONDAL2
 
Q4_Day 1_PPT.pptx
Q4_Day 1_PPT.pptxQ4_Day 1_PPT.pptx
Q4_Day 1_PPT.pptx
ErapUsman
 
Measures-of-PositionUngrouped.pptx
Measures-of-PositionUngrouped.pptxMeasures-of-PositionUngrouped.pptx
Measures-of-PositionUngrouped.pptx
VilDom
 
WEEK 1 QUARTER 4 MATH 10 B.pptx
WEEK 1 QUARTER 4 MATH 10 B.pptxWEEK 1 QUARTER 4 MATH 10 B.pptx
WEEK 1 QUARTER 4 MATH 10 B.pptx
AraceliLynPalomillo
 
PERCENTILE.PDF GRADE 10 MATHEMATICS.....
PERCENTILE.PDF GRADE 10 MATHEMATICS.....PERCENTILE.PDF GRADE 10 MATHEMATICS.....
PERCENTILE.PDF GRADE 10 MATHEMATICS.....
tanleyz036
 
Statics and probabilty
Statics and probabiltyStatics and probabilty
Statics and probabilty
AhmadAli647
 
QUARTER 4 topic.measures of position (quartiles)
QUARTER 4 topic.measures of position (quartiles)QUARTER 4 topic.measures of position (quartiles)
QUARTER 4 topic.measures of position (quartiles)
jessicapelones871997
 
Penggambaran Data Secara Numerik
Penggambaran Data Secara NumerikPenggambaran Data Secara Numerik
Penggambaran Data Secara Numerik
anom1392
 
Statistics " Measurements of central location chapter 2"
Statistics " Measurements of central location chapter 2"Statistics " Measurements of central location chapter 2"
Statistics " Measurements of central location chapter 2"
GanizaniBarnet
 
Statistics and probability lec006 part 1
Statistics and probability lec006 part 1Statistics and probability lec006 part 1
Statistics and probability lec006 part 1
TieeTiee
 
Mod mean quartile
Mod mean quartileMod mean quartile
Mod mean quartile
Maher Faisal Razi
 
Measures of Central Tendency of Ungroup Data-Demo.pptx
Measures of Central Tendency of Ungroup Data-Demo.pptxMeasures of Central Tendency of Ungroup Data-Demo.pptx
Measures of Central Tendency of Ungroup Data-Demo.pptx
RoquiMabugayGonzaga
 
Measure-of-Position.pptx
Measure-of-Position.pptxMeasure-of-Position.pptx
Measure-of-Position.pptx
dmanbehinddguitar
 
3.3 Measures of relative standing and boxplots
3.3 Measures of relative standing and boxplots3.3 Measures of relative standing and boxplots
3.3 Measures of relative standing and boxplots
Long Beach City College
 
measures-of-position-for-ungrouped-data_MAth 10_Part1.pptx
measures-of-position-for-ungrouped-data_MAth 10_Part1.pptxmeasures-of-position-for-ungrouped-data_MAth 10_Part1.pptx
measures-of-position-for-ungrouped-data_MAth 10_Part1.pptx
RonnelLozano
 
3. Descriptive statistics.pdf
3. Descriptive statistics.pdf3. Descriptive statistics.pdf
3. Descriptive statistics.pdf
YomifDeksisaHerpa
 

Similar to Quartile (ungrouped) (20)

G10 Math Q4 Week 8 Other forms of position of measure.pptx
G10 Math Q4 Week 8 Other forms of position of measure.pptxG10 Math Q4 Week 8 Other forms of position of measure.pptx
G10 Math Q4 Week 8 Other forms of position of measure.pptx
 
MEasures of Position.pptx
MEasures of Position.pptxMEasures of Position.pptx
MEasures of Position.pptx
 
Measures of Position.pptx
Measures of Position.pptxMeasures of Position.pptx
Measures of Position.pptx
 
QUARTILES.pptx
QUARTILES.pptxQUARTILES.pptx
QUARTILES.pptx
 
Quartile Deviation.pptx
Quartile Deviation.pptxQuartile Deviation.pptx
Quartile Deviation.pptx
 
Q4_Day 1_PPT.pptx
Q4_Day 1_PPT.pptxQ4_Day 1_PPT.pptx
Q4_Day 1_PPT.pptx
 
Measures-of-PositionUngrouped.pptx
Measures-of-PositionUngrouped.pptxMeasures-of-PositionUngrouped.pptx
Measures-of-PositionUngrouped.pptx
 
WEEK 1 QUARTER 4 MATH 10 B.pptx
WEEK 1 QUARTER 4 MATH 10 B.pptxWEEK 1 QUARTER 4 MATH 10 B.pptx
WEEK 1 QUARTER 4 MATH 10 B.pptx
 
PERCENTILE.PDF GRADE 10 MATHEMATICS.....
PERCENTILE.PDF GRADE 10 MATHEMATICS.....PERCENTILE.PDF GRADE 10 MATHEMATICS.....
PERCENTILE.PDF GRADE 10 MATHEMATICS.....
 
Statics and probabilty
Statics and probabiltyStatics and probabilty
Statics and probabilty
 
QUARTER 4 topic.measures of position (quartiles)
QUARTER 4 topic.measures of position (quartiles)QUARTER 4 topic.measures of position (quartiles)
QUARTER 4 topic.measures of position (quartiles)
 
Penggambaran Data Secara Numerik
Penggambaran Data Secara NumerikPenggambaran Data Secara Numerik
Penggambaran Data Secara Numerik
 
Statistics " Measurements of central location chapter 2"
Statistics " Measurements of central location chapter 2"Statistics " Measurements of central location chapter 2"
Statistics " Measurements of central location chapter 2"
 
Statistics and probability lec006 part 1
Statistics and probability lec006 part 1Statistics and probability lec006 part 1
Statistics and probability lec006 part 1
 
Mod mean quartile
Mod mean quartileMod mean quartile
Mod mean quartile
 
Measures of Central Tendency of Ungroup Data-Demo.pptx
Measures of Central Tendency of Ungroup Data-Demo.pptxMeasures of Central Tendency of Ungroup Data-Demo.pptx
Measures of Central Tendency of Ungroup Data-Demo.pptx
 
Measure-of-Position.pptx
Measure-of-Position.pptxMeasure-of-Position.pptx
Measure-of-Position.pptx
 
3.3 Measures of relative standing and boxplots
3.3 Measures of relative standing and boxplots3.3 Measures of relative standing and boxplots
3.3 Measures of relative standing and boxplots
 
measures-of-position-for-ungrouped-data_MAth 10_Part1.pptx
measures-of-position-for-ungrouped-data_MAth 10_Part1.pptxmeasures-of-position-for-ungrouped-data_MAth 10_Part1.pptx
measures-of-position-for-ungrouped-data_MAth 10_Part1.pptx
 
3. Descriptive statistics.pdf
3. Descriptive statistics.pdf3. Descriptive statistics.pdf
3. Descriptive statistics.pdf
 

Recently uploaded

DSSML24_tspann_CodelessGenerativeAIPipelines
DSSML24_tspann_CodelessGenerativeAIPipelinesDSSML24_tspann_CodelessGenerativeAIPipelines
DSSML24_tspann_CodelessGenerativeAIPipelines
Timothy Spann
 
STATATHON: Unleashing the Power of Statistics in a 48-Hour Knowledge Extravag...
STATATHON: Unleashing the Power of Statistics in a 48-Hour Knowledge Extravag...STATATHON: Unleashing the Power of Statistics in a 48-Hour Knowledge Extravag...
STATATHON: Unleashing the Power of Statistics in a 48-Hour Knowledge Extravag...
sameer shah
 
原版一比一多伦多大学毕业证(UofT毕业证书)如何办理
原版一比一多伦多大学毕业证(UofT毕业证书)如何办理原版一比一多伦多大学毕业证(UofT毕业证书)如何办理
原版一比一多伦多大学毕业证(UofT毕业证书)如何办理
mkkikqvo
 
一比一原版(harvard毕业证书)哈佛大学毕业证如何办理
一比一原版(harvard毕业证书)哈佛大学毕业证如何办理一比一原版(harvard毕业证书)哈佛大学毕业证如何办理
一比一原版(harvard毕业证书)哈佛大学毕业证如何办理
taqyea
 
writing report business partner b1+ .pdf
writing report business partner b1+ .pdfwriting report business partner b1+ .pdf
writing report business partner b1+ .pdf
VyNguyen709676
 
Challenges of Nation Building-1.pptx with more important
Challenges of Nation Building-1.pptx with more importantChallenges of Nation Building-1.pptx with more important
Challenges of Nation Building-1.pptx with more important
Sm321
 
原版制作(unimelb毕业证书)墨尔本大学毕业证Offer一模一样
原版制作(unimelb毕业证书)墨尔本大学毕业证Offer一模一样原版制作(unimelb毕业证书)墨尔本大学毕业证Offer一模一样
原版制作(unimelb毕业证书)墨尔本大学毕业证Offer一模一样
ihavuls
 
The Ipsos - AI - Monitor 2024 Report.pdf
The  Ipsos - AI - Monitor 2024 Report.pdfThe  Ipsos - AI - Monitor 2024 Report.pdf
The Ipsos - AI - Monitor 2024 Report.pdf
Social Samosa
 
Palo Alto Cortex XDR presentation .......
Palo Alto Cortex XDR presentation .......Palo Alto Cortex XDR presentation .......
Palo Alto Cortex XDR presentation .......
Sachin Paul
 
一比一原版(UCSF文凭证书)旧金山分校毕业证如何办理
一比一原版(UCSF文凭证书)旧金山分校毕业证如何办理一比一原版(UCSF文凭证书)旧金山分校毕业证如何办理
一比一原版(UCSF文凭证书)旧金山分校毕业证如何办理
nuttdpt
 
Population Growth in Bataan: The effects of population growth around rural pl...
Population Growth in Bataan: The effects of population growth around rural pl...Population Growth in Bataan: The effects of population growth around rural pl...
Population Growth in Bataan: The effects of population growth around rural pl...
Bill641377
 
在线办理(英国UCA毕业证书)创意艺术大学毕业证在读证明一模一样
在线办理(英国UCA毕业证书)创意艺术大学毕业证在读证明一模一样在线办理(英国UCA毕业证书)创意艺术大学毕业证在读证明一模一样
在线办理(英国UCA毕业证书)创意艺术大学毕业证在读证明一模一样
v7oacc3l
 
一比一原版(UMN文凭证书)明尼苏达大学毕业证如何办理
一比一原版(UMN文凭证书)明尼苏达大学毕业证如何办理一比一原版(UMN文凭证书)明尼苏达大学毕业证如何办理
一比一原版(UMN文凭证书)明尼苏达大学毕业证如何办理
nyfuhyz
 
Build applications with generative AI on Google Cloud
Build applications with generative AI on Google CloudBuild applications with generative AI on Google Cloud
Build applications with generative AI on Google Cloud
Márton Kodok
 
原版一比一利兹贝克特大学毕业证(LeedsBeckett毕业证书)如何办理
原版一比一利兹贝克特大学毕业证(LeedsBeckett毕业证书)如何办理原版一比一利兹贝克特大学毕业证(LeedsBeckett毕业证书)如何办理
原版一比一利兹贝克特大学毕业证(LeedsBeckett毕业证书)如何办理
wyddcwye1
 
Module 1 ppt BIG DATA ANALYTICS_NOTES FOR MCA
Module 1 ppt BIG DATA ANALYTICS_NOTES FOR MCAModule 1 ppt BIG DATA ANALYTICS_NOTES FOR MCA
Module 1 ppt BIG DATA ANALYTICS_NOTES FOR MCA
yuvarajkumar334
 
UofT毕业证如何办理
UofT毕业证如何办理UofT毕业证如何办理
UofT毕业证如何办理
exukyp
 
Monthly Management report for the Month of May 2024
Monthly Management report for the Month of May 2024Monthly Management report for the Month of May 2024
Monthly Management report for the Month of May 2024
facilitymanager11
 
DATA COMMS-NETWORKS YR2 lecture 08 NAT & CLOUD.docx
DATA COMMS-NETWORKS YR2 lecture 08 NAT & CLOUD.docxDATA COMMS-NETWORKS YR2 lecture 08 NAT & CLOUD.docx
DATA COMMS-NETWORKS YR2 lecture 08 NAT & CLOUD.docx
SaffaIbrahim1
 
原版一比一弗林德斯大学毕业证(Flinders毕业证书)如何办理
原版一比一弗林德斯大学毕业证(Flinders毕业证书)如何办理原版一比一弗林德斯大学毕业证(Flinders毕业证书)如何办理
原版一比一弗林德斯大学毕业证(Flinders毕业证书)如何办理
a9qfiubqu
 

Recently uploaded (20)

DSSML24_tspann_CodelessGenerativeAIPipelines
DSSML24_tspann_CodelessGenerativeAIPipelinesDSSML24_tspann_CodelessGenerativeAIPipelines
DSSML24_tspann_CodelessGenerativeAIPipelines
 
STATATHON: Unleashing the Power of Statistics in a 48-Hour Knowledge Extravag...
STATATHON: Unleashing the Power of Statistics in a 48-Hour Knowledge Extravag...STATATHON: Unleashing the Power of Statistics in a 48-Hour Knowledge Extravag...
STATATHON: Unleashing the Power of Statistics in a 48-Hour Knowledge Extravag...
 
原版一比一多伦多大学毕业证(UofT毕业证书)如何办理
原版一比一多伦多大学毕业证(UofT毕业证书)如何办理原版一比一多伦多大学毕业证(UofT毕业证书)如何办理
原版一比一多伦多大学毕业证(UofT毕业证书)如何办理
 
一比一原版(harvard毕业证书)哈佛大学毕业证如何办理
一比一原版(harvard毕业证书)哈佛大学毕业证如何办理一比一原版(harvard毕业证书)哈佛大学毕业证如何办理
一比一原版(harvard毕业证书)哈佛大学毕业证如何办理
 
writing report business partner b1+ .pdf
writing report business partner b1+ .pdfwriting report business partner b1+ .pdf
writing report business partner b1+ .pdf
 
Challenges of Nation Building-1.pptx with more important
Challenges of Nation Building-1.pptx with more importantChallenges of Nation Building-1.pptx with more important
Challenges of Nation Building-1.pptx with more important
 
原版制作(unimelb毕业证书)墨尔本大学毕业证Offer一模一样
原版制作(unimelb毕业证书)墨尔本大学毕业证Offer一模一样原版制作(unimelb毕业证书)墨尔本大学毕业证Offer一模一样
原版制作(unimelb毕业证书)墨尔本大学毕业证Offer一模一样
 
The Ipsos - AI - Monitor 2024 Report.pdf
The  Ipsos - AI - Monitor 2024 Report.pdfThe  Ipsos - AI - Monitor 2024 Report.pdf
The Ipsos - AI - Monitor 2024 Report.pdf
 
Palo Alto Cortex XDR presentation .......
Palo Alto Cortex XDR presentation .......Palo Alto Cortex XDR presentation .......
Palo Alto Cortex XDR presentation .......
 
一比一原版(UCSF文凭证书)旧金山分校毕业证如何办理
一比一原版(UCSF文凭证书)旧金山分校毕业证如何办理一比一原版(UCSF文凭证书)旧金山分校毕业证如何办理
一比一原版(UCSF文凭证书)旧金山分校毕业证如何办理
 
Population Growth in Bataan: The effects of population growth around rural pl...
Population Growth in Bataan: The effects of population growth around rural pl...Population Growth in Bataan: The effects of population growth around rural pl...
Population Growth in Bataan: The effects of population growth around rural pl...
 
在线办理(英国UCA毕业证书)创意艺术大学毕业证在读证明一模一样
在线办理(英国UCA毕业证书)创意艺术大学毕业证在读证明一模一样在线办理(英国UCA毕业证书)创意艺术大学毕业证在读证明一模一样
在线办理(英国UCA毕业证书)创意艺术大学毕业证在读证明一模一样
 
一比一原版(UMN文凭证书)明尼苏达大学毕业证如何办理
一比一原版(UMN文凭证书)明尼苏达大学毕业证如何办理一比一原版(UMN文凭证书)明尼苏达大学毕业证如何办理
一比一原版(UMN文凭证书)明尼苏达大学毕业证如何办理
 
Build applications with generative AI on Google Cloud
Build applications with generative AI on Google CloudBuild applications with generative AI on Google Cloud
Build applications with generative AI on Google Cloud
 
原版一比一利兹贝克特大学毕业证(LeedsBeckett毕业证书)如何办理
原版一比一利兹贝克特大学毕业证(LeedsBeckett毕业证书)如何办理原版一比一利兹贝克特大学毕业证(LeedsBeckett毕业证书)如何办理
原版一比一利兹贝克特大学毕业证(LeedsBeckett毕业证书)如何办理
 
Module 1 ppt BIG DATA ANALYTICS_NOTES FOR MCA
Module 1 ppt BIG DATA ANALYTICS_NOTES FOR MCAModule 1 ppt BIG DATA ANALYTICS_NOTES FOR MCA
Module 1 ppt BIG DATA ANALYTICS_NOTES FOR MCA
 
UofT毕业证如何办理
UofT毕业证如何办理UofT毕业证如何办理
UofT毕业证如何办理
 
Monthly Management report for the Month of May 2024
Monthly Management report for the Month of May 2024Monthly Management report for the Month of May 2024
Monthly Management report for the Month of May 2024
 
DATA COMMS-NETWORKS YR2 lecture 08 NAT & CLOUD.docx
DATA COMMS-NETWORKS YR2 lecture 08 NAT & CLOUD.docxDATA COMMS-NETWORKS YR2 lecture 08 NAT & CLOUD.docx
DATA COMMS-NETWORKS YR2 lecture 08 NAT & CLOUD.docx
 
原版一比一弗林德斯大学毕业证(Flinders毕业证书)如何办理
原版一比一弗林德斯大学毕业证(Flinders毕业证书)如何办理原版一比一弗林德斯大学毕业证(Flinders毕业证书)如何办理
原版一比一弗林德斯大学毕业证(Flinders毕业证书)如何办理
 

Quartile (ungrouped)

  • 1. MEASURES OF POSITION FOR UNGROUPED DATA: QUARTILES , DECILES , & PERCENTILES
  • 2. QUARTILES FOR UNGROUPED DATA  The QUARTILES are the score points which divide a distribution into four equal parts. Q1 Q2 Q3  25% of the data has a value ≤ Q1  50% of the data has a value ≤ Q2  75% of the data has a value ≤ Q3
  • 3. QUARTILES FOR UNGROUPED DATA Q1 is called the LOWER QUARTILE Q2 is nothing but the MEDIAN Q3 is the UPPER QUARTILE
  • 4. MENDENHALL AND SINCICH METHOD : A METHOD OF FINDING THE QUARTILE VALUE  This method is being developed by William Mendenhall and Terry Sincich to find the position of the quartile in the given data.
  • 5. MENDENHALL AND SINCICH METHOD : A METHOD OF FINDING THE QUARTILE VALUE  Formula: Lower Quartile (L) = Position of Q1= ¼ (n+1) Q2= 2(n+1) = n+1 th observation 4 2 Upper Quartile (U) = Position of Q3 = ¾ (n+1)
  • 6. MENDENHALL AND SINCICH METHOD : A METHOD OF FINDING THE QUARTILE VALUE  N is the number of elements in the data Example: The manager of a food chain recorded the number of customers who came to eat the products in each day. The results were 10,15,14,13,20,19,12 and 11.  In this example N=8
  • 7. MENDENHALL AND SINCICH METHOD : A METHOD OF FINDING THE QUARTILE VALUE  Q1= n+1 th observation 4  Q2= 2(n+1) = n+1 th observation 4 2  Q3= 3(n+1) th observation 4
  • 8. MENDENHALL AND SINCICH METHOD : A METHOD OF FINDING THE QUARTILE VALUE  Steps to solve the quartile of the given data 1. Arrange the data in ascending order or from the lowest value to the highest value. 2. Find the N or the total number of elements presented in the data. 3. Find the least value of the data and the greatest value of the data. 4. find the lower quartile of the given data using the Mendenhall & Sincich Method. Lower Quartile (L) = Position of Q1= ¼ (n+1)
  • 9. MENDENHALL AND SINCICH METHOD : A METHOD OF FINDING THE QUARTILE VALUE 5. Find the middle value of the data or the Median. Use this formula Q2= 2(n+1) = n+1 th observation 4 2 6. Find the upper quartile of the given data. Use this formula Upper Quartile (U) = Position of Q3 = ¾ (n+1)
  • 10. MENDENHALL AND SINCICH METHOD : A METHOD OF FINDING THE QUARTILE VALUE  Example: The owner of the coffee shop recorded the number of customers who came into his café each hour in a day. The results were 14, 10, 12, 9, 17, 5, 8, 9, 14, 10, and 11.
  • 11. MENDENHALL AND SINCICH METHOD : A METHOD OF FINDING THE QUARTILE VALUE  Solution  Ascending order {5, 8, 9, 9, 10, 10, 11, 12, 14, 14, 17}  N=11  Least value= 5  Greatest value= 17
  • 12. MENDENHALL AND SINCICH METHOD : A METHOD OF FINDING THE QUARTILE VALUE  Lower Quartile (L) = Position of Q1= ¼ (n+1) Q1= ½ (n+1) Q1= ½ (11+1) Q1= ½ (12) Q1= 12/4 (divide) Q1= 3 {5, 8, 9, 9, 10, 10, 11, 12, 14, 14, 17}  Therefore the Q1 is the 3rd element in the data which is 9
  • 13. MENDENHALL AND SINCICH METHOD : A METHOD OF FINDING THE QUARTILE VALUE  Median Value or the middle value Q2= 2/4 (n+1) = n+1/2 th observation Q2= 2/4 (11+1) Q2= 2/4 (12) Q2= 24/4 Q2= 6 {5, 8, 9, 9, 10, 10, 11, 12, 14, 14, 17}  Therefore the Q2 is the 6th element in the data which is 10
  • 14. MENDENHALL AND SINCICH METHOD : A METHOD OF FINDING THE QUARTILE VALUE  Upper Quartile (U)= Position of Q3= ¾ (n+1) Q3= ¾ (11+1) Q3= ¾ (12) Q3= 36/4 Q3= 9 {5, 8, 9, 9, 10, 10, 11, 12, 14, 14, 17}  Therefore the Q3 is the 9th element in the data which is 14
  • 15. LINEAR INTERPOLATION  A method of finding the quartile value.  Is a method of constructing new data points within the range of a discrete set of known data points.  It is often required to interpolate, i.e., estimate the value of that function for an intermediate value of the independent variable.  We need to use the interpolation if the value of the position is in decimal form.
  • 16. LINEAR INTERPOLATION  Using the formula Qk= k/4 (n+1) k= position of the quartilen= total no. of the data
  • 17. LINEAR INTERPOLATION  Steps in interpolation method 1. Arrange the scores in ascending order 2. Locate the position of the score in the distribution 3. Since the result is in decimal number, proceed to linear interpolation 4. Find the difference between the two values wherein Q1 is situated 5. Multiply the result in step 2 by the decimal part obtained in step 4 6. Add the result in step 5 to the second smaller number in step 4
  • 18. LINEAR INTERPOLATION  Example: Find the first quartile (Q1), and the third quartile (Q3), Given the scores of 9 students in their mathematics activity using linear interpolation {1, 27, 16, 7, 31, 7, 30, 3, 21 }
  • 19. LINEAR INTERPOLATION  Step 1 : Arrange the scores in ascending order { 1, 3, 7, 7, 16, 21, 27, 30, 31 }  Step 2: Locate the position of the score in the distribution Position of Q1= ¼(n+1) Q1= ¼ (9+1) Q1= 0.25(10) Q1= 2.5
  • 20. LINEAR INTERPOLATION  Step 3: Since the result is in decimal number, proceed to linear interpolation  Step 4: Find the difference between the two values wherein Q1 is situated { 1, 3, 7, 7, 16, 21, 27, 30, 31 } 2.5 position  Q1 is between the values 3 and 7, therefore = 7-3 = 4
  • 21. LINEAR INTERPOLATION  Step 5: Multiply the result in step 2 by the decimal part obtained in step 4 = 4 (0.5) = 2  Step 6: Add the result in step 5 to the second smaller number in step 4 = 2+3 = 5  Therefore the value of Q1 is equal to 5