Downloaded 1,092 times
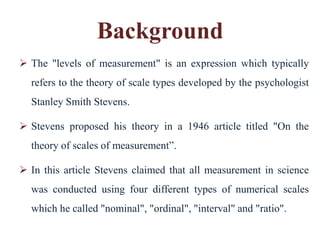
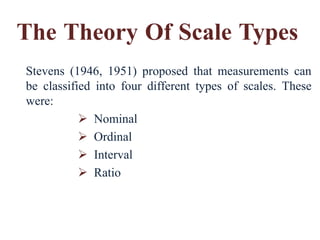


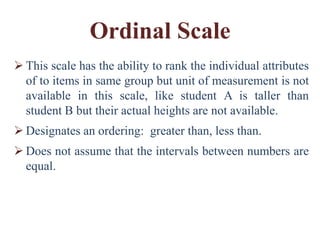


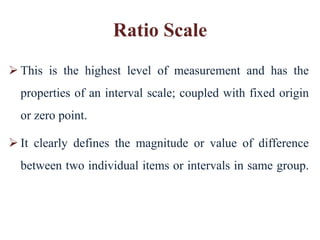


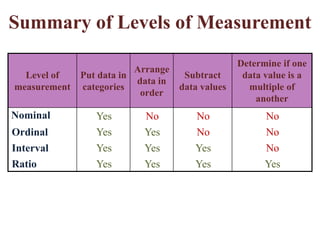


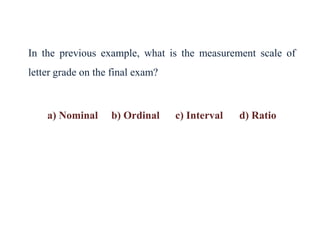


The document discusses Stanley Smith Stevens' theory of measurement scales, which proposes that there are four types of measurement scales - nominal, ordinal, interval, and ratio - that differ in their ability to determine relationships between values and perform mathematical operations. Nominal scales only categorize data, ordinal scales can rank order data, interval scales have equal intervals between values, and ratio scales have a true zero point. Proper selection of a measurement scale depends on research objectives, response types, data properties, and other factors.


