
Recommended
More Related Content
Similar to Measures of Central Tendency.pptx for UG
Similar to Measures of Central Tendency.pptx for UG (20)
More from SoniaBajaj10
More from SoniaBajaj10 (20)
Recently uploaded
Recently uploaded (20)
Measures of Central Tendency.pptx for UG
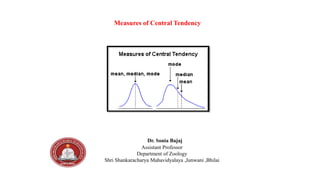
- 1. Dr. Sonia Bajaj Assistant Professor Department of Zoology Shri Shankaracharya Mahavidyalaya ,Junwani ,Bhilai Measures of Central Tendency
- 2. Measures of Central Tendency • Measure of central tendency is a typical value of the entire data. It is the average. • According to Simpson and Kafla "a measure of central tendency is a typical value around which other figures congregate". Human mind is incapable of remembering the entire mass of data. So a simple figure is used to describe the series which must be a representative number. It is generally called a measure of central tendency or average". This value always lies between the minimum and maximum values and generally it is located in the centre or middle of the distribution. The average of a data is called a measure of central tendency. Characteristics of a Good Average- 1. It should be easy to understand. 2. It should be rigidly defined. 3. It should be easy to calculate and simple to follow. 4. It should be capable of further algebraic treatment. 5. It should be based on all the observations of the Series. 6. It should not be affected by fluctuations of sampling. Three types of averages, namely-
- 4. Mean • Mean is an average. • It is a measure of central tendency. • Mean is obtained by adding all the values and by dividing the total by the number of items. • Mean is represented by the symbol X (X bar). • Mean is of two types, namely arithmetic mean and geometric mean. • The average obtained arithmetically is called arithmetic mean. Normally arithmetic mean is simply called mean. • Geometric mean is obtained by geometric progression. • Mean can be obtained for ungrouped and grouped data. • The mean can be calculated by two methods, namely-1. Direct method2. Indirect method . • In direct method, mean is calculated for ungrouped data by the following formula: X = Mean Σ = Sum of X = Value of an items N = Total number of items X =Σx/N
- 5. In indirect method, mean is calculated for ungrouped data by the following formula: X =Mean A= Assumed mean d= Deviation from assumed mean Ed = Sum of d N = Number of items For grouped data, mean is calculated by the following formula: X =Mean X= Value of an item Σ= sum of f= Frequency m= Class mark N= Number of items X=A+Σd/N
- 6. Merits of Mean • Mean is well defined. • Calculation is easy. • All the items are considered for calculation. • It is based on each and every observation. • It is used for other statistical calculations. Demerits of Mean • Mean will not be correct if certain values are very big or very small. • It may give false conclusion. • It gives absured values. For example, the mean children in families is given sometimes as 2½ children.
- 9. II. Median • Median-Median is the middle value of a data when the values are arranged in the ascending or descending onder. • Median is an average. It is a measure of central value. • Median divides a distribution into two equal halves There will be equal number of items above and below the items. • Median is represented by the symbol md. • Median can be calculated for ungrouped data and grouped data. • Mean, Median can also be calculated for- Grouped data- a ungrouped data b. discrete series c. continuous series • The formula for the calculation of median for ungrouped data is md = median N = Number of items If there are odd number of items, then median is calculated as follows: Median = Value of the 6th item, when the items are arranged in an ascending order.
- 10. When there are even number of items, the median falls between two items. The values of these two items are added and divided by 2 to get median. If there are 12 items, the median is calculated as follows: Median = Value of the 6.5th item. It is obtained by adding the values of 6th item and 7th item and dividing the sum by 2. Median of a grouped data with class interval can be calculated by the following formula: L= Lower limit of the median class. N= Total frequency. cf Cumulative frequency prior to the median class. C =Class interval of the median class. f = Frequency of the median class.
- 11. Merits of Median 1. Simple to calculate. 2. It can be calculated without knowing the values of all the items. 3. It is unaffected by extreme values. 4. It can be calculated graphically. Demerits of Median 1. It is not based on all the items. 2. 2. It is not used as a common average. 3. 3. It is not used for further statistical calculation.
- 15. Mode • Mode is the value of the variable which occurs most frequently in a distribution. • The value which occurs many times in the table is the mode. • It is represented by the letter Mo. • Mode is an average. It is a positional average. It is a measure of central value. • When a data has one concentration of frequency, it is called unimodal. • When it has two concentrations, it is called bimodal. • When it has 3 concentrations of frequency, it is called trimodal. • Mode can be calculated for ungrouped data and grouped data. Merits of Mode 1. Mode can be easily found out. 2. No calculation is needed. 3. It is not affected by extreme values. 4. It can be calculated graphically. Demerits of Mode 1. It is not clearly defined. 2. It is not based on all observations. 3. It is not reliable. 4. It is not used for further statistical calculation.
- 17. References- 1. Elements of Biostatistics- S. Prasad 2. Biostatistics -Khan & Khanam 3. Basic Concepts of Biostatistics -N. Arumugam