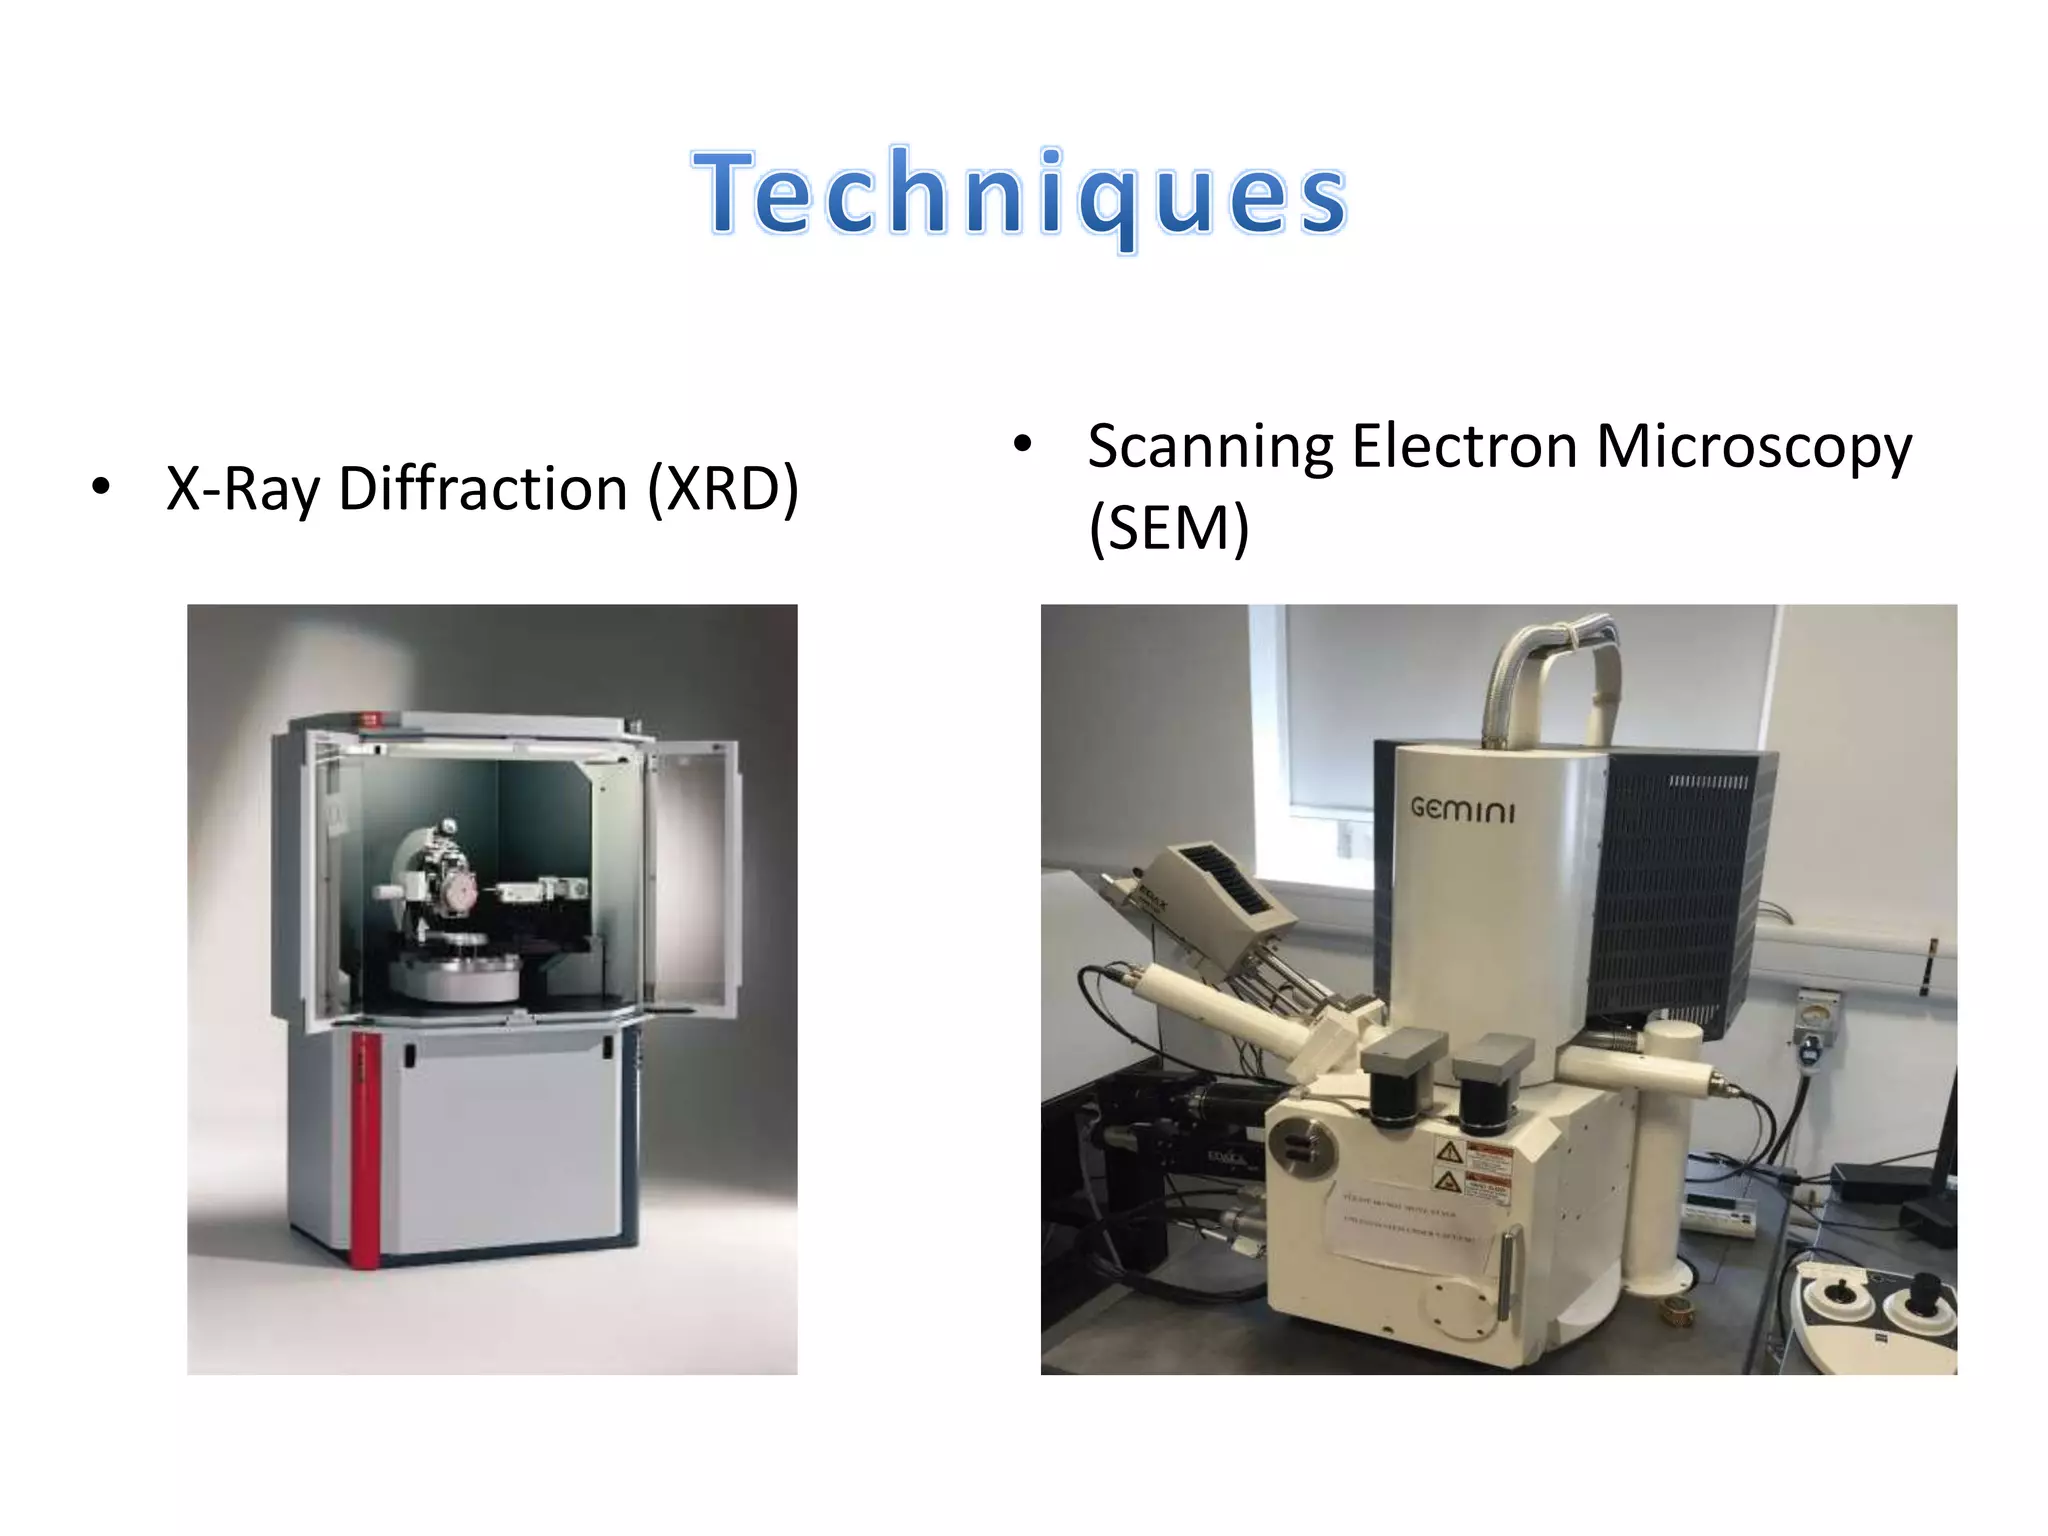
BMFB3723 MATERIAL CHARACTERIZATION
Material Analysis
By :
Carron Ting Shuang Sia B051410115
Sisubalan a/l Selvan B051410128
Muhamad Farzril bin Mohd Yusoff B051410242
To :
Dr Intan Sharhida
Material
• Threaded tensile bar
• Standard Test Methods for Tension
Testing of Metallic Materials.
ASTM E8/E8M
threaded tensile
Characterization Properties
• Surface structure: Surface morphology, topography
and crystallographic information.
• The fracture mechanics
• The composition
• X-Ray Diffraction (XRD)
• Scanning Electron Microscopy
(SEM)
Technique 1: X-Ray Diffraction (XRD)
• Analyze and identify unknown materials
• To identify the composition of the specimen
• This identification is performed by comparison of the
diffraction pattern to a known standard or to a
database such as the International Center for
Diffraction Data's Powder Diffraction File or the
Cambridge Structural Database (CSD).
• Non-destructive technique
• Sample preparation is easy and fast.
DEFINITION:
Analytical technique used for phase identification of a crystalline material and
can provide information on unit cell dimensions.
Technique 2: Scanning Electron Microscopy (SEM)
• High resolution and large depth of field: Produce a
good image (3D)
• Analyze how the atoms are arranged in the object
• See the fractured surfaces of a specimen.
• Specimens must be conductive when examined using a
SEM to provide conducting path to earth.
• For non-conductors it is required to be coated when
using a SEM.
DEFINITION:
Technique that uses an electron microscope that produces images of a sample by
scanning the surface with a focused beam of electrons.
Results : XRD
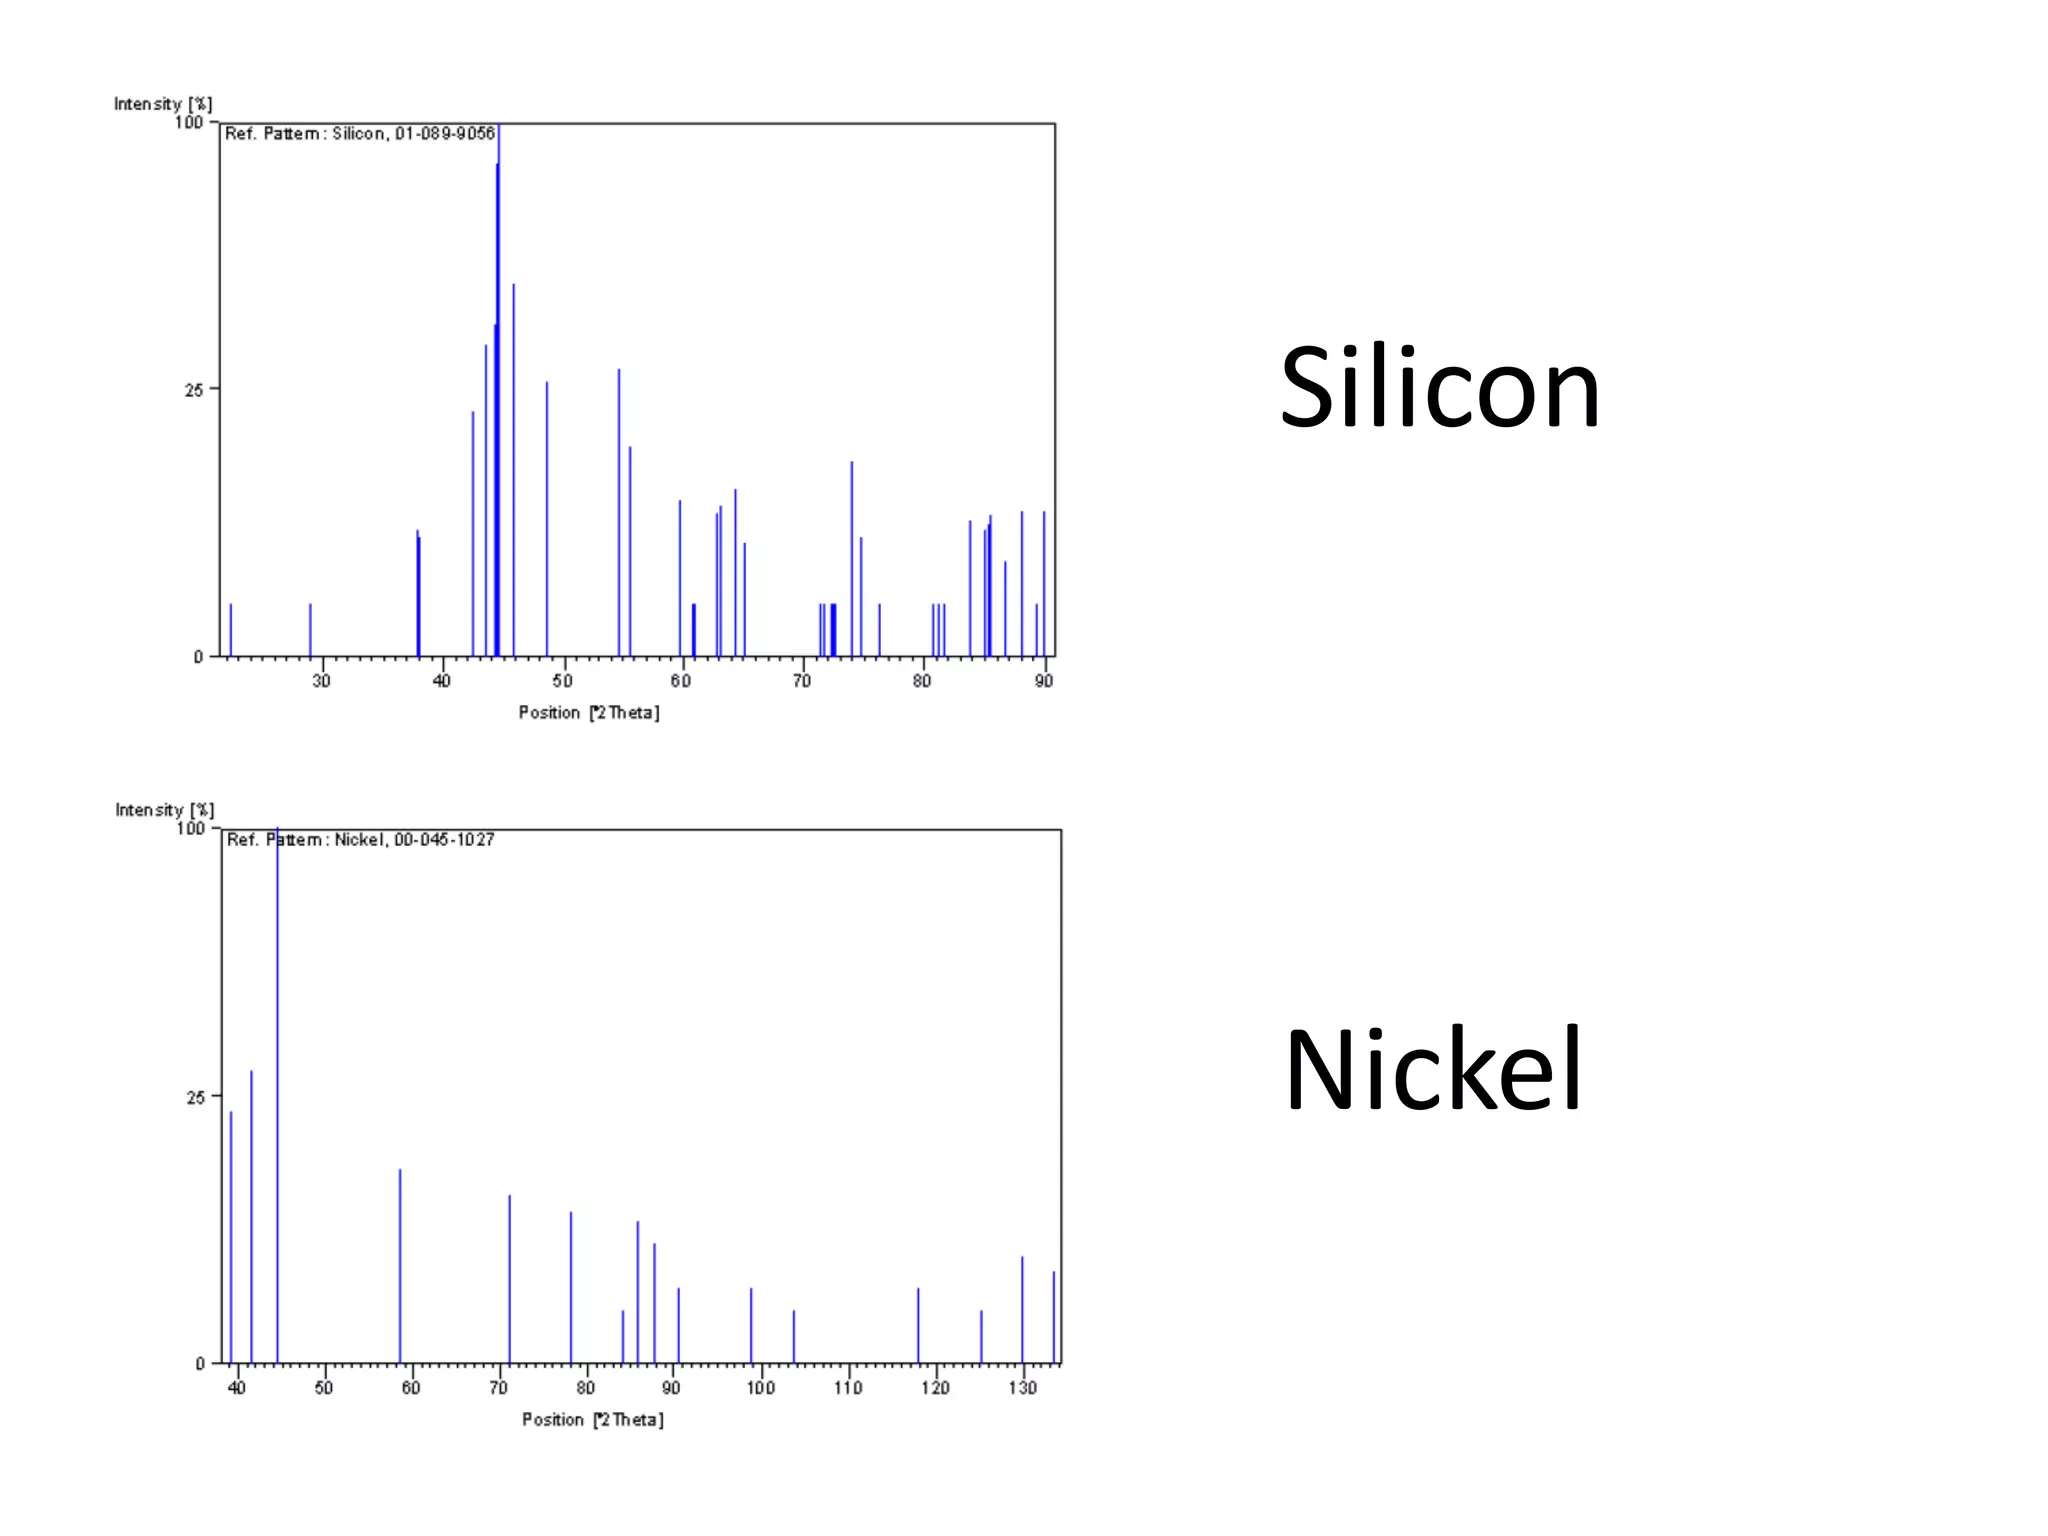
• The composition is identified by comparing the XRD pattern to the
library of known patterns.
• Aluminum, Silicon and Nickel.
Position [°2Theta] (Copper (Cu))
20 30 40 50 60 70 80
Counts
0
1000
2000
3000
4000
Al;Si
Al;Si;Ni
Al
Al;Ni
Al
Carron
Result: XRD
• The intensity is proportional to the number of x-ray photons
of a particular energy that have been counted by the detector
for each angle 2θ.
• Each peak or reflection in the diffraction pattern corresponds
to the x-rays diffracted from a specific set of planes in the
specimen.
Aluminum
• 9 peaks: low with symmetry
• 9 different positions: 9 different crystal structure of Aluminum
• For example, the miller indices or hkl plane of the highest peak would be Al[111]
which it is either be a FCC or cubic structured. Meanwhile, the lowest peak would
be Al[420]
• Highest peak (intensity of 100%), it proved that the quantity of the Al [420] is
higher compared to other different Aluminum types.
XRD: Aluminum
Silicon
Nickel
• Scanning Probe Microscopy (SPM) • Optical Microscopy
Scanning Probe Microscopy (SPM)
• Expensive tip
• Tip must be as sharp and narrow as possible
• It requires extremely clean surfaces
• Sample surface must be able to conduct
electricity
Optical Microscopy
• Low magnification and small depth of field: Small resolution
• Only able to view objects in the range of 1 mm - 300 nm.
• Requires proper and sample preparation
Optical Microscopy
• Preparation of the specimen : Change the microstructure of
the material (through heating, chemical attack, or mechanical
damage).
• The amount of damage depends on the method by which the
specimen is cut and the material itself. For example, cutting
with abrasives will cause high amount of damages.
• Friction heat can damage specimens and generate artifacts in
the microstructure.
Optical Microscopy
• Over-etching cause the small pits to grow and
obscure the main features to be observed.
Propose Other Two Techniques
1) Raman spectroscopy
Raman spectroscopy
can identify unknown materials from their
unique Raman spectral fingerprints, typically
using databases of known spectra
involves the interaction of light with matter
• study changes in the details of the spectrum
such as the height, width, and position of the
Raman bands
• In solid-state physics, Raman spectroscopy is
used to characterize materials, measure
temperature, and find the crystallographic
orientation of a sample
2) X-ray photoelectron spectroscopy (XPS)
• The XPS instrument measures the kinetic
energy of all collected electrons. The electron
signal includes contributions from both
photoelectron and Auger electron lines.
• widely used technique for studying the
properties of atoms, molecules, solids and
surfaces. It has been utilized for the study of
free atoms, free molecules, and the bulk
properties of solids and liquids.

Material Characterization of Tensile Bar (Slides)

  • 1.
    BMFB3723 MATERIAL CHARACTERIZATION MaterialAnalysis By : Carron Ting Shuang Sia B051410115 Sisubalan a/l Selvan B051410128 Muhamad Farzril bin Mohd Yusoff B051410242 To : Dr Intan Sharhida
  • 2.
    Material • Threaded tensilebar • Standard Test Methods for Tension Testing of Metallic Materials. ASTM E8/E8M threaded tensile
  • 3.
    Characterization Properties • Surfacestructure: Surface morphology, topography and crystallographic information. • The fracture mechanics • The composition
  • 4.
    • X-Ray Diffraction(XRD) • Scanning Electron Microscopy (SEM)
  • 5.
    Technique 1: X-RayDiffraction (XRD) • Analyze and identify unknown materials • To identify the composition of the specimen • This identification is performed by comparison of the diffraction pattern to a known standard or to a database such as the International Center for Diffraction Data's Powder Diffraction File or the Cambridge Structural Database (CSD). • Non-destructive technique • Sample preparation is easy and fast. DEFINITION: Analytical technique used for phase identification of a crystalline material and can provide information on unit cell dimensions.
  • 6.
    Technique 2: ScanningElectron Microscopy (SEM) • High resolution and large depth of field: Produce a good image (3D) • Analyze how the atoms are arranged in the object • See the fractured surfaces of a specimen. • Specimens must be conductive when examined using a SEM to provide conducting path to earth. • For non-conductors it is required to be coated when using a SEM. DEFINITION: Technique that uses an electron microscope that produces images of a sample by scanning the surface with a focused beam of electrons.
  • 7.
    Results : XRD •The composition is identified by comparing the XRD pattern to the library of known patterns. • Aluminum, Silicon and Nickel. Position [°2Theta] (Copper (Cu)) 20 30 40 50 60 70 80 Counts 0 1000 2000 3000 4000 Al;Si Al;Si;Ni Al Al;Ni Al Carron
  • 8.
    Result: XRD • Theintensity is proportional to the number of x-ray photons of a particular energy that have been counted by the detector for each angle 2θ. • Each peak or reflection in the diffraction pattern corresponds to the x-rays diffracted from a specific set of planes in the specimen.
  • 9.
    Aluminum • 9 peaks:low with symmetry • 9 different positions: 9 different crystal structure of Aluminum • For example, the miller indices or hkl plane of the highest peak would be Al[111] which it is either be a FCC or cubic structured. Meanwhile, the lowest peak would be Al[420] • Highest peak (intensity of 100%), it proved that the quantity of the Al [420] is higher compared to other different Aluminum types.
  • 10.
  • 11.
  • 12.
    • Scanning ProbeMicroscopy (SPM) • Optical Microscopy
  • 13.
    Scanning Probe Microscopy(SPM) • Expensive tip • Tip must be as sharp and narrow as possible • It requires extremely clean surfaces • Sample surface must be able to conduct electricity
  • 14.
    Optical Microscopy • Lowmagnification and small depth of field: Small resolution • Only able to view objects in the range of 1 mm - 300 nm. • Requires proper and sample preparation
  • 15.
    Optical Microscopy • Preparationof the specimen : Change the microstructure of the material (through heating, chemical attack, or mechanical damage). • The amount of damage depends on the method by which the specimen is cut and the material itself. For example, cutting with abrasives will cause high amount of damages. • Friction heat can damage specimens and generate artifacts in the microstructure.
  • 16.
    Optical Microscopy • Over-etchingcause the small pits to grow and obscure the main features to be observed.
  • 17.
  • 18.
  • 19.
    Raman spectroscopy can identifyunknown materials from their unique Raman spectral fingerprints, typically using databases of known spectra involves the interaction of light with matter
  • 20.
    • study changesin the details of the spectrum such as the height, width, and position of the Raman bands • In solid-state physics, Raman spectroscopy is used to characterize materials, measure temperature, and find the crystallographic orientation of a sample
  • 21.
    2) X-ray photoelectronspectroscopy (XPS)
  • 22.
    • The XPSinstrument measures the kinetic energy of all collected electrons. The electron signal includes contributions from both photoelectron and Auger electron lines. • widely used technique for studying the properties of atoms, molecules, solids and surfaces. It has been utilized for the study of free atoms, free molecules, and the bulk properties of solids and liquids.