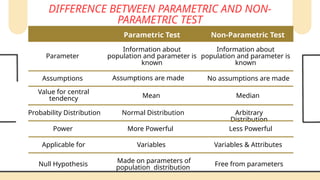
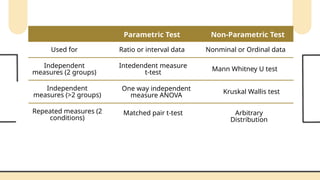
Non-parametric tests are crucial in statistical analysis as they provide a robust alternative to parametric tests when the assumptions of the latter are not met. They are particularly useful when dealing with ordinal data, data that is not normally distributed, or when the sample size is too small to assume normality.


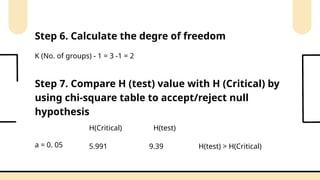
![Step 5. Calculate H (test)
(12)
N (N=1)
H
=
[
M
(
M
R) 2]
n
- 3(N + 1)
N = Total # of participants
n = # of participant in one
group
(12)
15(15 + 1)
H
= 5
- 3(15 + 1)
(53.5)2
+
5
(51.5)2
+
5
(15)2
H (test) = 9.39](https://image.slidesharecdn.com/npt-presentationstatisticsandprobability-251005130430-74ef5561/85/NPT-Presentation-Statistics-and-Probability-pptx-26-320.jpg)


![Non_parametric_test-4[1].pptx -[1] 2.pptx](https://cdn.slidesharecdn.com/ss_thumbnails/nonparametrictest-41-260115135338-f2d1eaa3-thumbnail.jpg?width=640&height=640&fit=bounds)