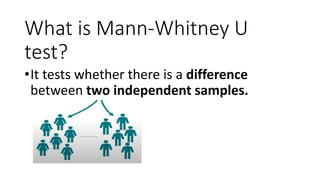
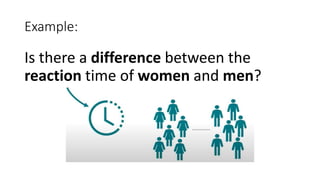
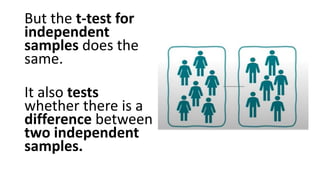
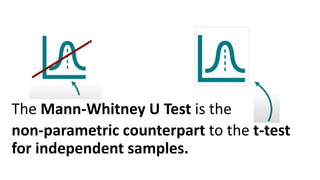
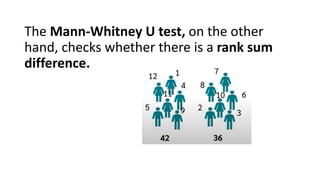
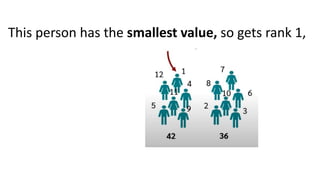
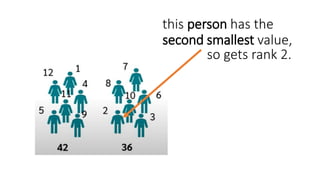
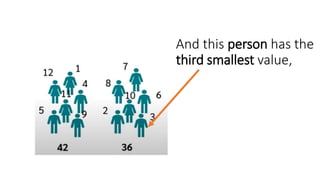
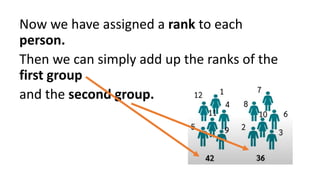
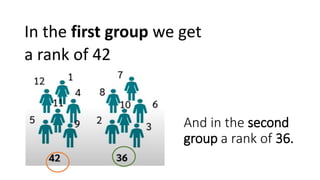
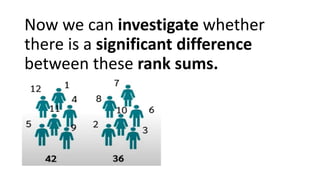
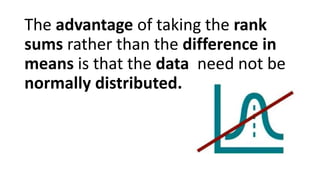
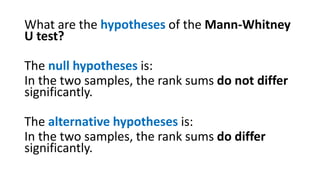
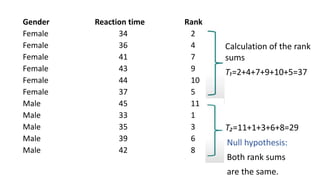
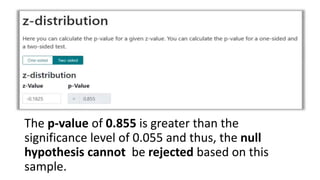
Mann-Whitney U Test
Roseclyde D. Lucasan
MTLED-Home Economics
What is Mann-Whitney U
test?
•It tests whether there is a difference
between two independent samples.
Example:
Is there a difference between the
reaction time of women and men?
But the t-test for
independent
samples does the
same.
It also tests
whether there is a
difference between
two independent
samples.
The Mann-Whitney U Test is the
non-parametric counterpart to the t-test
for independent samples.
But there is an important difference
between the two tests.
The t-test for independent samples tests whether
there is a mean difference.
For both samples, the mean value is calculated
and it is tested whether these mean values differ
significantly.
- - - - - -
- - - - - -
The Mann-Whitney U test, on the other
hand, checks whether there is a rank sum
difference.
How do we calculate the rank sum?
For this purpose, we sort all persons from
the smallest to the largest value.
This person has the smallest value, so gets rank 1,
this person has the
second smallest value,
so gets rank 2.
And this person has the
third smallest value,
Now we have assigned a rank to each
person.
Then we can simply add up the ranks of the
first group
and the second group.
And in the second
group a rank of 36.
In the first group we get
a rank of 42
Now we can investigate whether
there is a significant difference
between these rank sums.
The advantage of taking the rank
sums rather than the difference in
means is that the data need not be
normally distributed.
So, in contrast to the
t-test, the data in the
Mann-Whitney U
test do not have to
be normally
distributed.
What are the hypotheses of the Mann-Whitney
U test?
The null hypotheses is:
In the two samples, the rank sums do not differ
significantly.
The alternative hypotheses is:
In the two samples, the rank sums do differ
significantly.
Gender Reaction time
Female 34
Female 36
Female 41
Female 43
Female 44
Female 37
Male 45
Male 33
Male 35
Male 39
Male 42
Data are not
normally
distributed
no t-Test
But Mann-
Whitney U
Test
Gender Reaction time Rank
Female 34 2
Female 36 4
Female 41 7
Female 43 9
Female 44 10
Female 37 5
Male 45 11
Male 33 1
Male 35 3
Male 39 6
Male 42 8
Calculation of the rank
sums
T₁=2+4+7+9+10+5=37
T₂=11+1+3+6+8=29
Null hypothesis:
Both rank sums
are the same.
Female
Rank sum number of cases
T₁=37 n₁=6
=6∙5+6∙(6+1)/2 -37
=14
Male
Rank sum number of cases
T₂=29 n₂=5
= 6∙5+5∙(5+1)/2 -29
=16
U-value
Expected value of U
Standard error of U
Z-value
Depending on how large the sample is, the
p-value for the Mann-Whitney U test is
calculated in different ways.
For up to 25 cases the exact values
are used,
which can be read from a table.
For large samples, the
normal distribution of
the U-value can be used
as an approximation.
In our example, we
would actually use
the exact values, nevertheless, we
assume a normal
distribution.
The p-value of 0.855 is greater than the
significance level of 0.055 and thus, the null
hypothesis cannot be rejected based on this
sample.

Mann-Whitney U Test.pptx

  • 1.
    Mann-Whitney U Test RoseclydeD. Lucasan MTLED-Home Economics
  • 2.
    What is Mann-WhitneyU test? •It tests whether there is a difference between two independent samples.
  • 3.
    Example: Is there adifference between the reaction time of women and men?
  • 4.
    But the t-testfor independent samples does the same. It also tests whether there is a difference between two independent samples.
  • 5.
    The Mann-Whitney UTest is the non-parametric counterpart to the t-test for independent samples.
  • 6.
    But there isan important difference between the two tests.
  • 7.
    The t-test forindependent samples tests whether there is a mean difference. For both samples, the mean value is calculated and it is tested whether these mean values differ significantly. - - - - - - - - - - - -
  • 8.
    The Mann-Whitney Utest, on the other hand, checks whether there is a rank sum difference.
  • 9.
    How do wecalculate the rank sum? For this purpose, we sort all persons from the smallest to the largest value.
  • 10.
    This person hasthe smallest value, so gets rank 1,
  • 11.
    this person hasthe second smallest value, so gets rank 2.
  • 12.
    And this personhas the third smallest value,
  • 13.
    Now we haveassigned a rank to each person. Then we can simply add up the ranks of the first group and the second group.
  • 14.
    And in thesecond group a rank of 36. In the first group we get a rank of 42
  • 15.
    Now we caninvestigate whether there is a significant difference between these rank sums.
  • 16.
    The advantage oftaking the rank sums rather than the difference in means is that the data need not be normally distributed.
  • 17.
    So, in contrastto the t-test, the data in the Mann-Whitney U test do not have to be normally distributed.
  • 18.
    What are thehypotheses of the Mann-Whitney U test? The null hypotheses is: In the two samples, the rank sums do not differ significantly. The alternative hypotheses is: In the two samples, the rank sums do differ significantly.
  • 19.
    Gender Reaction time Female34 Female 36 Female 41 Female 43 Female 44 Female 37 Male 45 Male 33 Male 35 Male 39 Male 42 Data are not normally distributed no t-Test But Mann- Whitney U Test
  • 20.
    Gender Reaction timeRank Female 34 2 Female 36 4 Female 41 7 Female 43 9 Female 44 10 Female 37 5 Male 45 11 Male 33 1 Male 35 3 Male 39 6 Male 42 8 Calculation of the rank sums T₁=2+4+7+9+10+5=37 T₂=11+1+3+6+8=29 Null hypothesis: Both rank sums are the same.
  • 21.
    Female Rank sum numberof cases T₁=37 n₁=6 =6∙5+6∙(6+1)/2 -37 =14 Male Rank sum number of cases T₂=29 n₂=5 = 6∙5+5∙(5+1)/2 -29 =16 U-value Expected value of U Standard error of U Z-value
  • 22.
    Depending on howlarge the sample is, the p-value for the Mann-Whitney U test is calculated in different ways.
  • 23.
    For up to25 cases the exact values are used, which can be read from a table.
  • 24.
    For large samples,the normal distribution of the U-value can be used as an approximation.
  • 25.
    In our example,we would actually use the exact values, nevertheless, we assume a normal distribution.
  • 26.
    The p-value of0.855 is greater than the significance level of 0.055 and thus, the null hypothesis cannot be rejected based on this sample.

Editor's Notes

  • #10 Identify the smallest and largest value and explain the ranks
  • #13 So on and so forth.
  • #21 Now, we want to calculate the p-value for this.
  • #23 However, it should be noted:
  • #27 My reference suggested to use a website which is the DATAtab to calculate the p-value for a given z-value.