Download as PDF, PPTX


![ Planned Production Time
= [Shift Length - Breaks]
= [480 - 60]
= 420 minutes
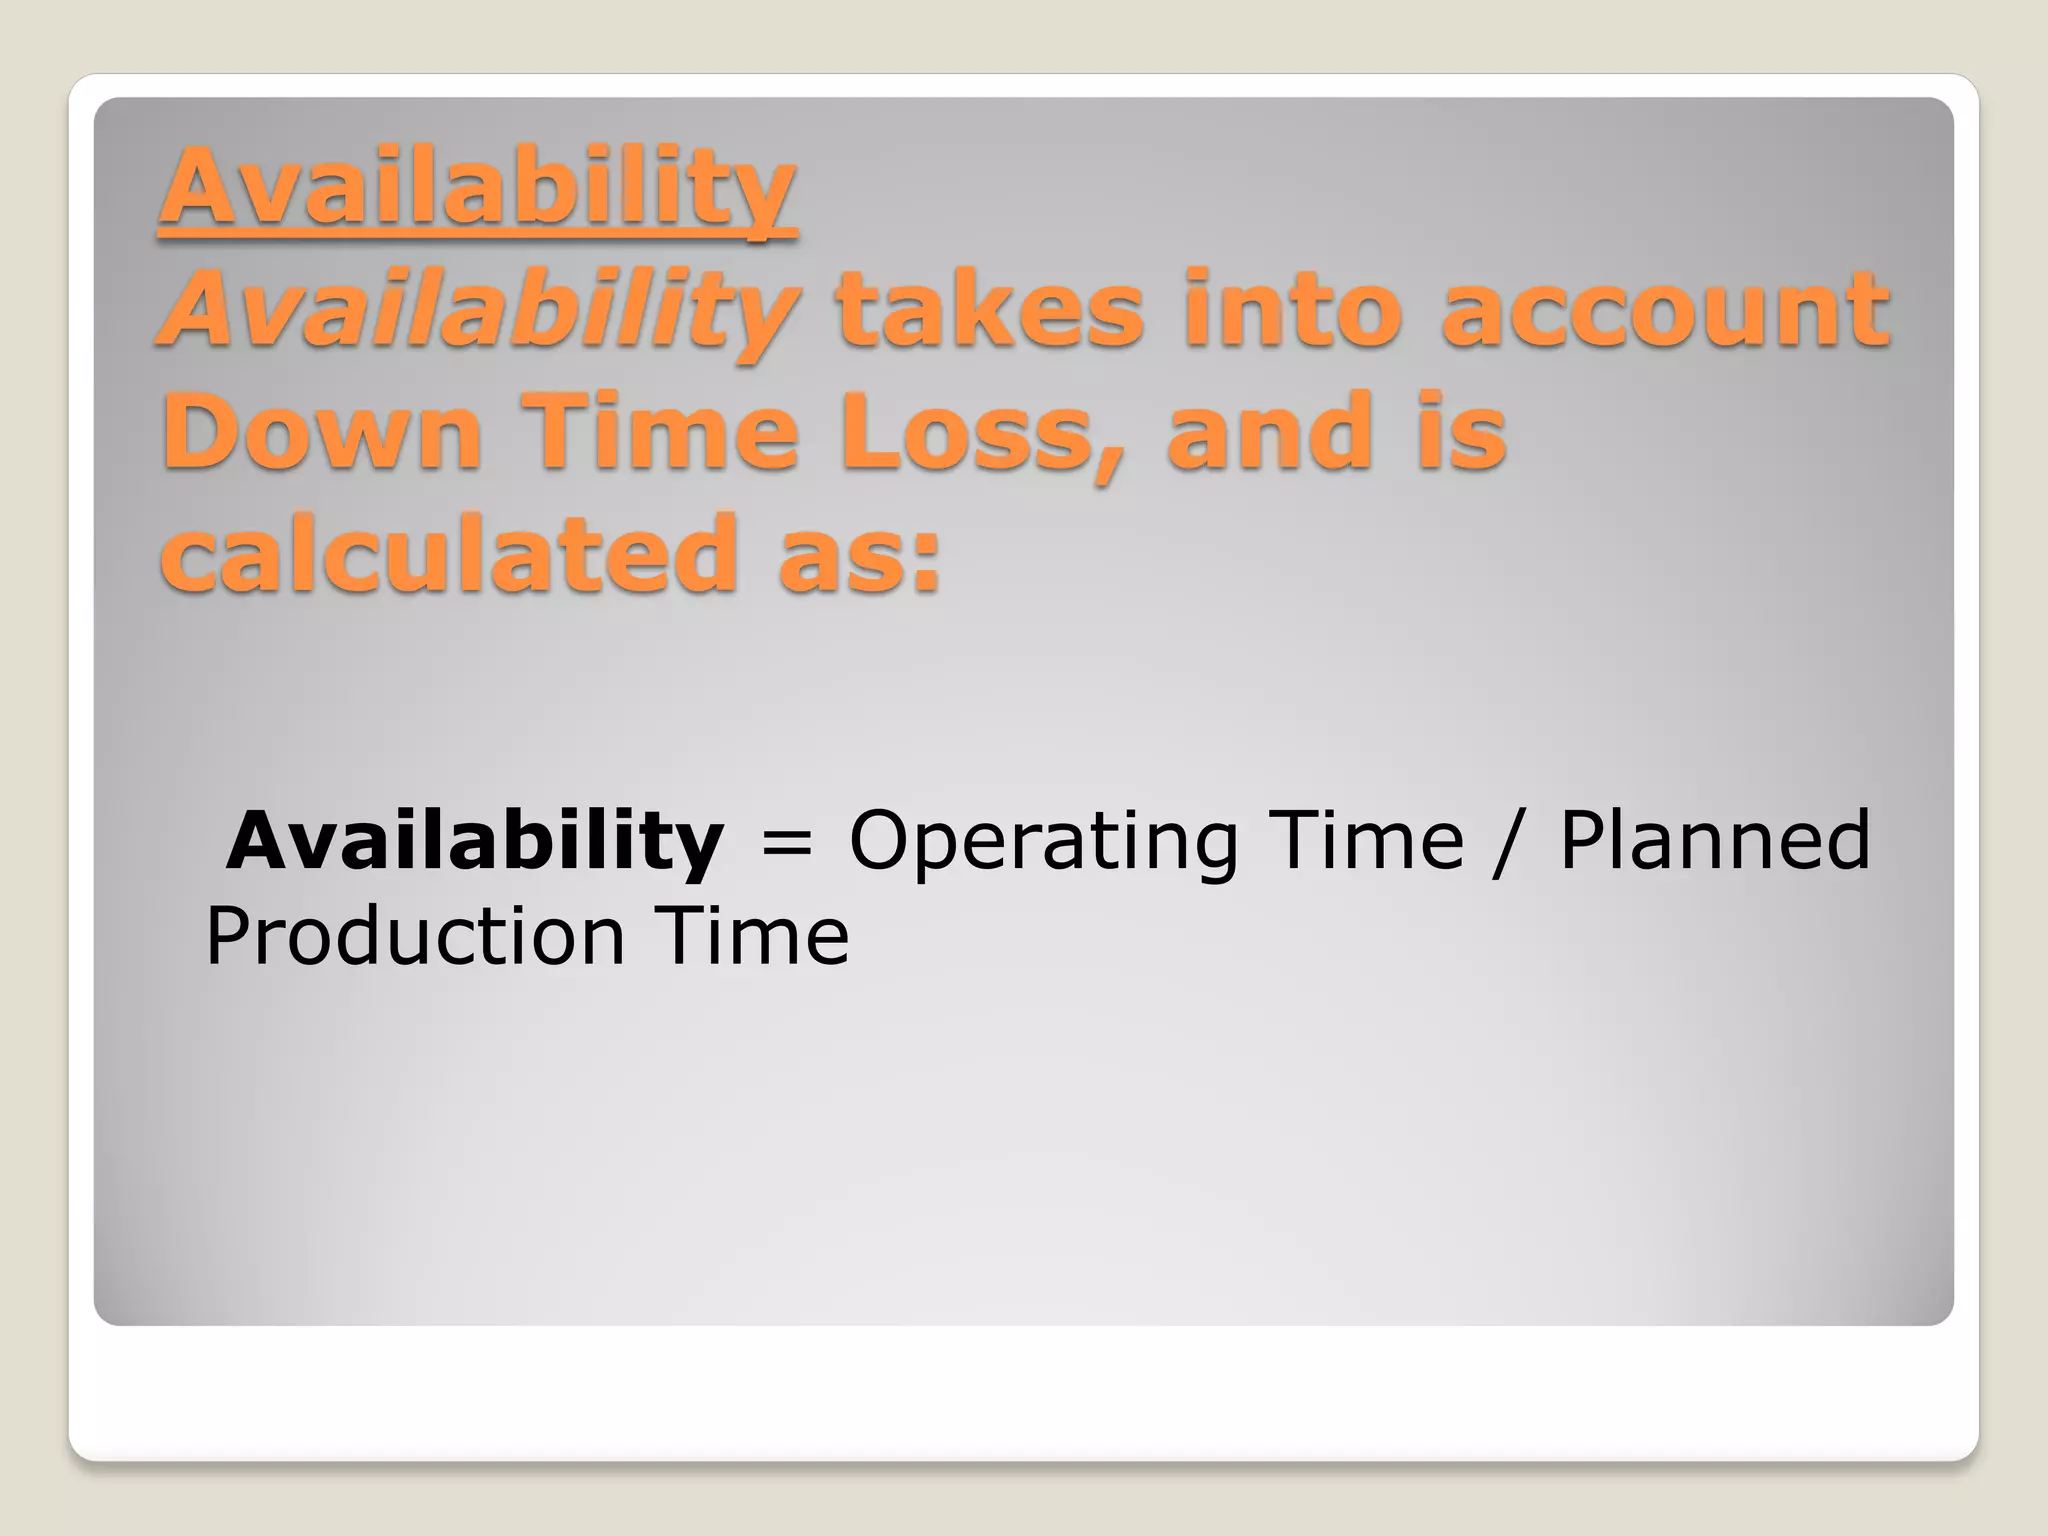
Operating Time
= [Planned Production Time - Down Time]
= [420 - 47]
= 373 minutes
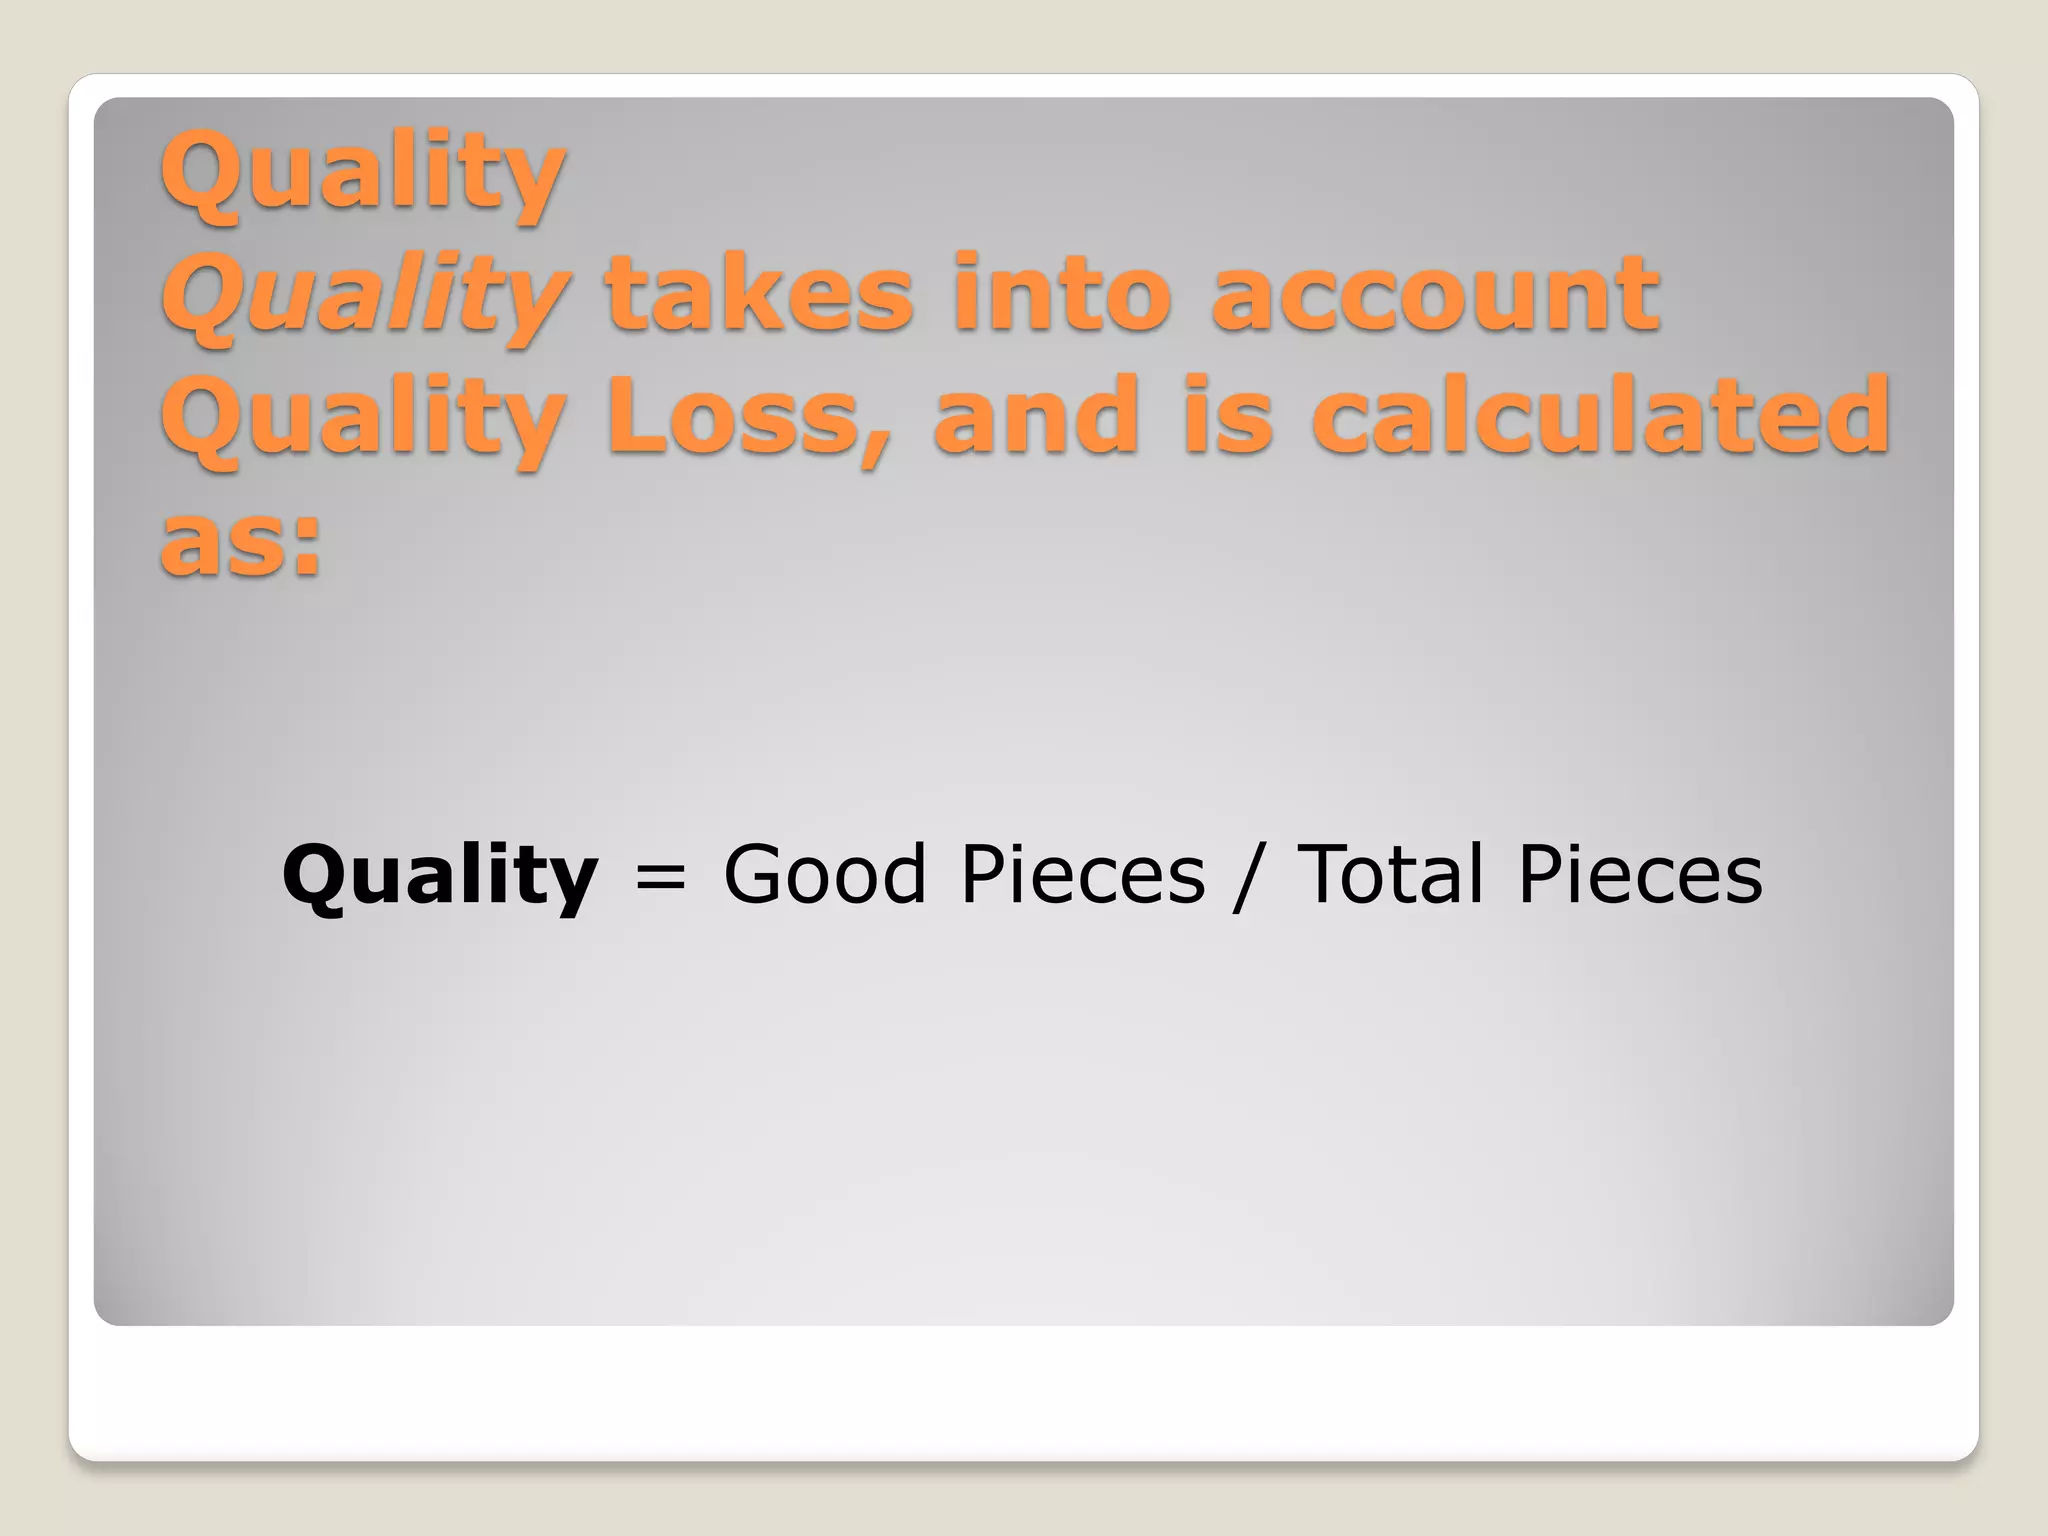
Good Pieces
= [Total Pieces - Reject Pieces]
= [19,271 - 423]
= 18,848 pieces](https://image.slidesharecdn.com/maintenance-150929123718-lva1-app6892/75/Maintenance-21-2048.jpg)


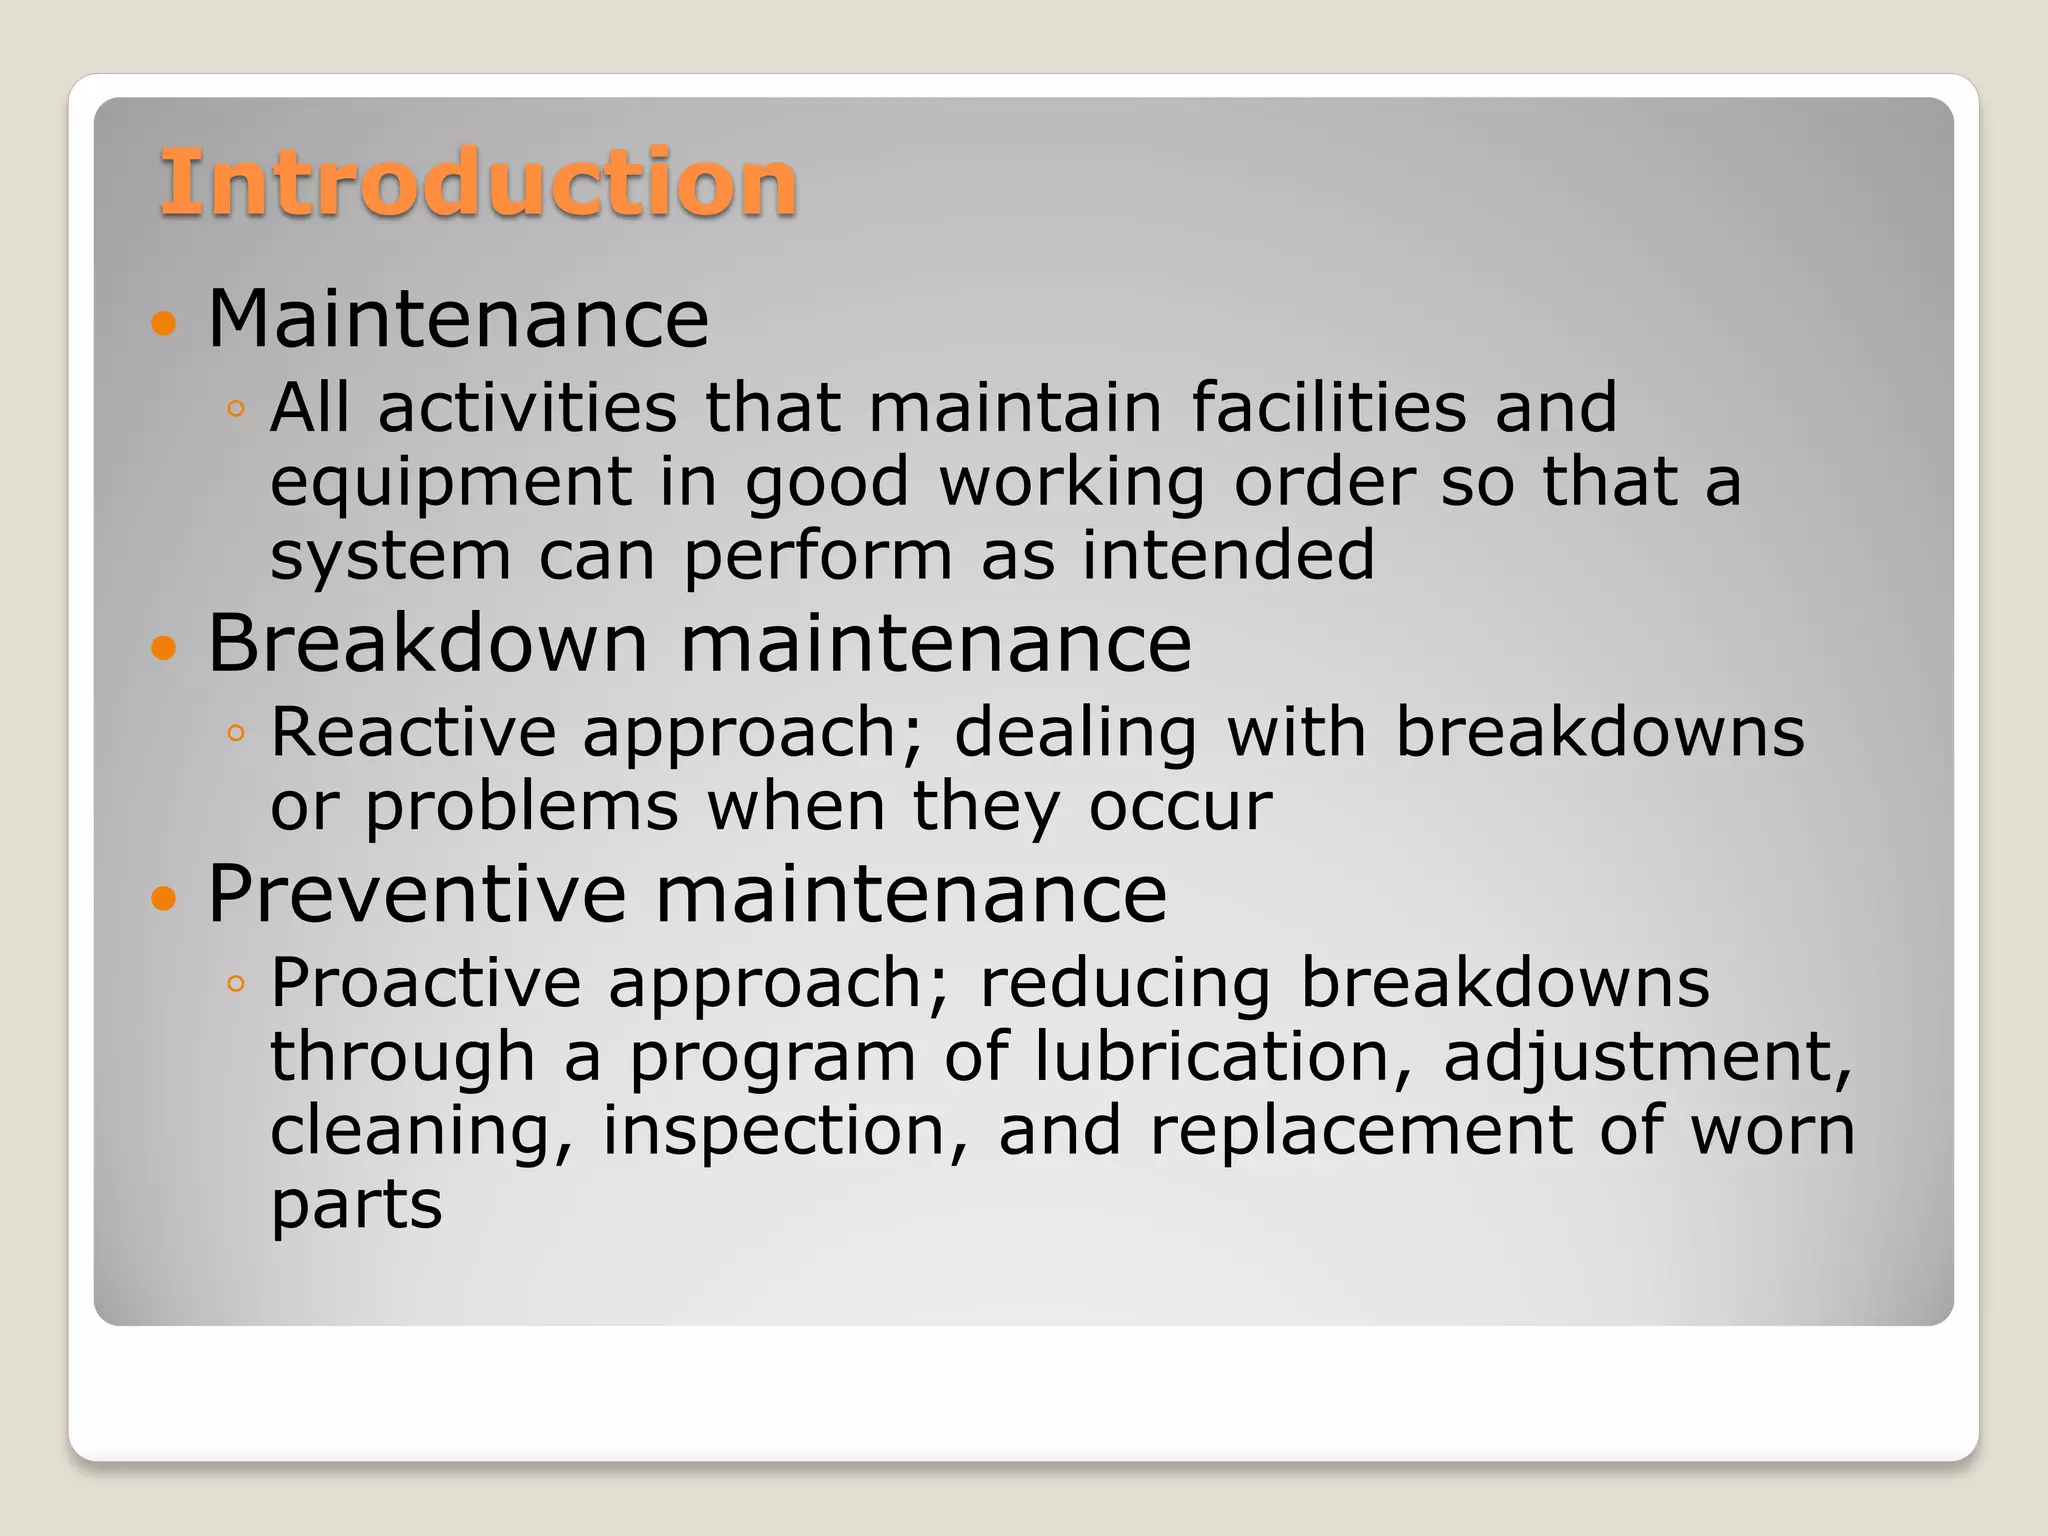
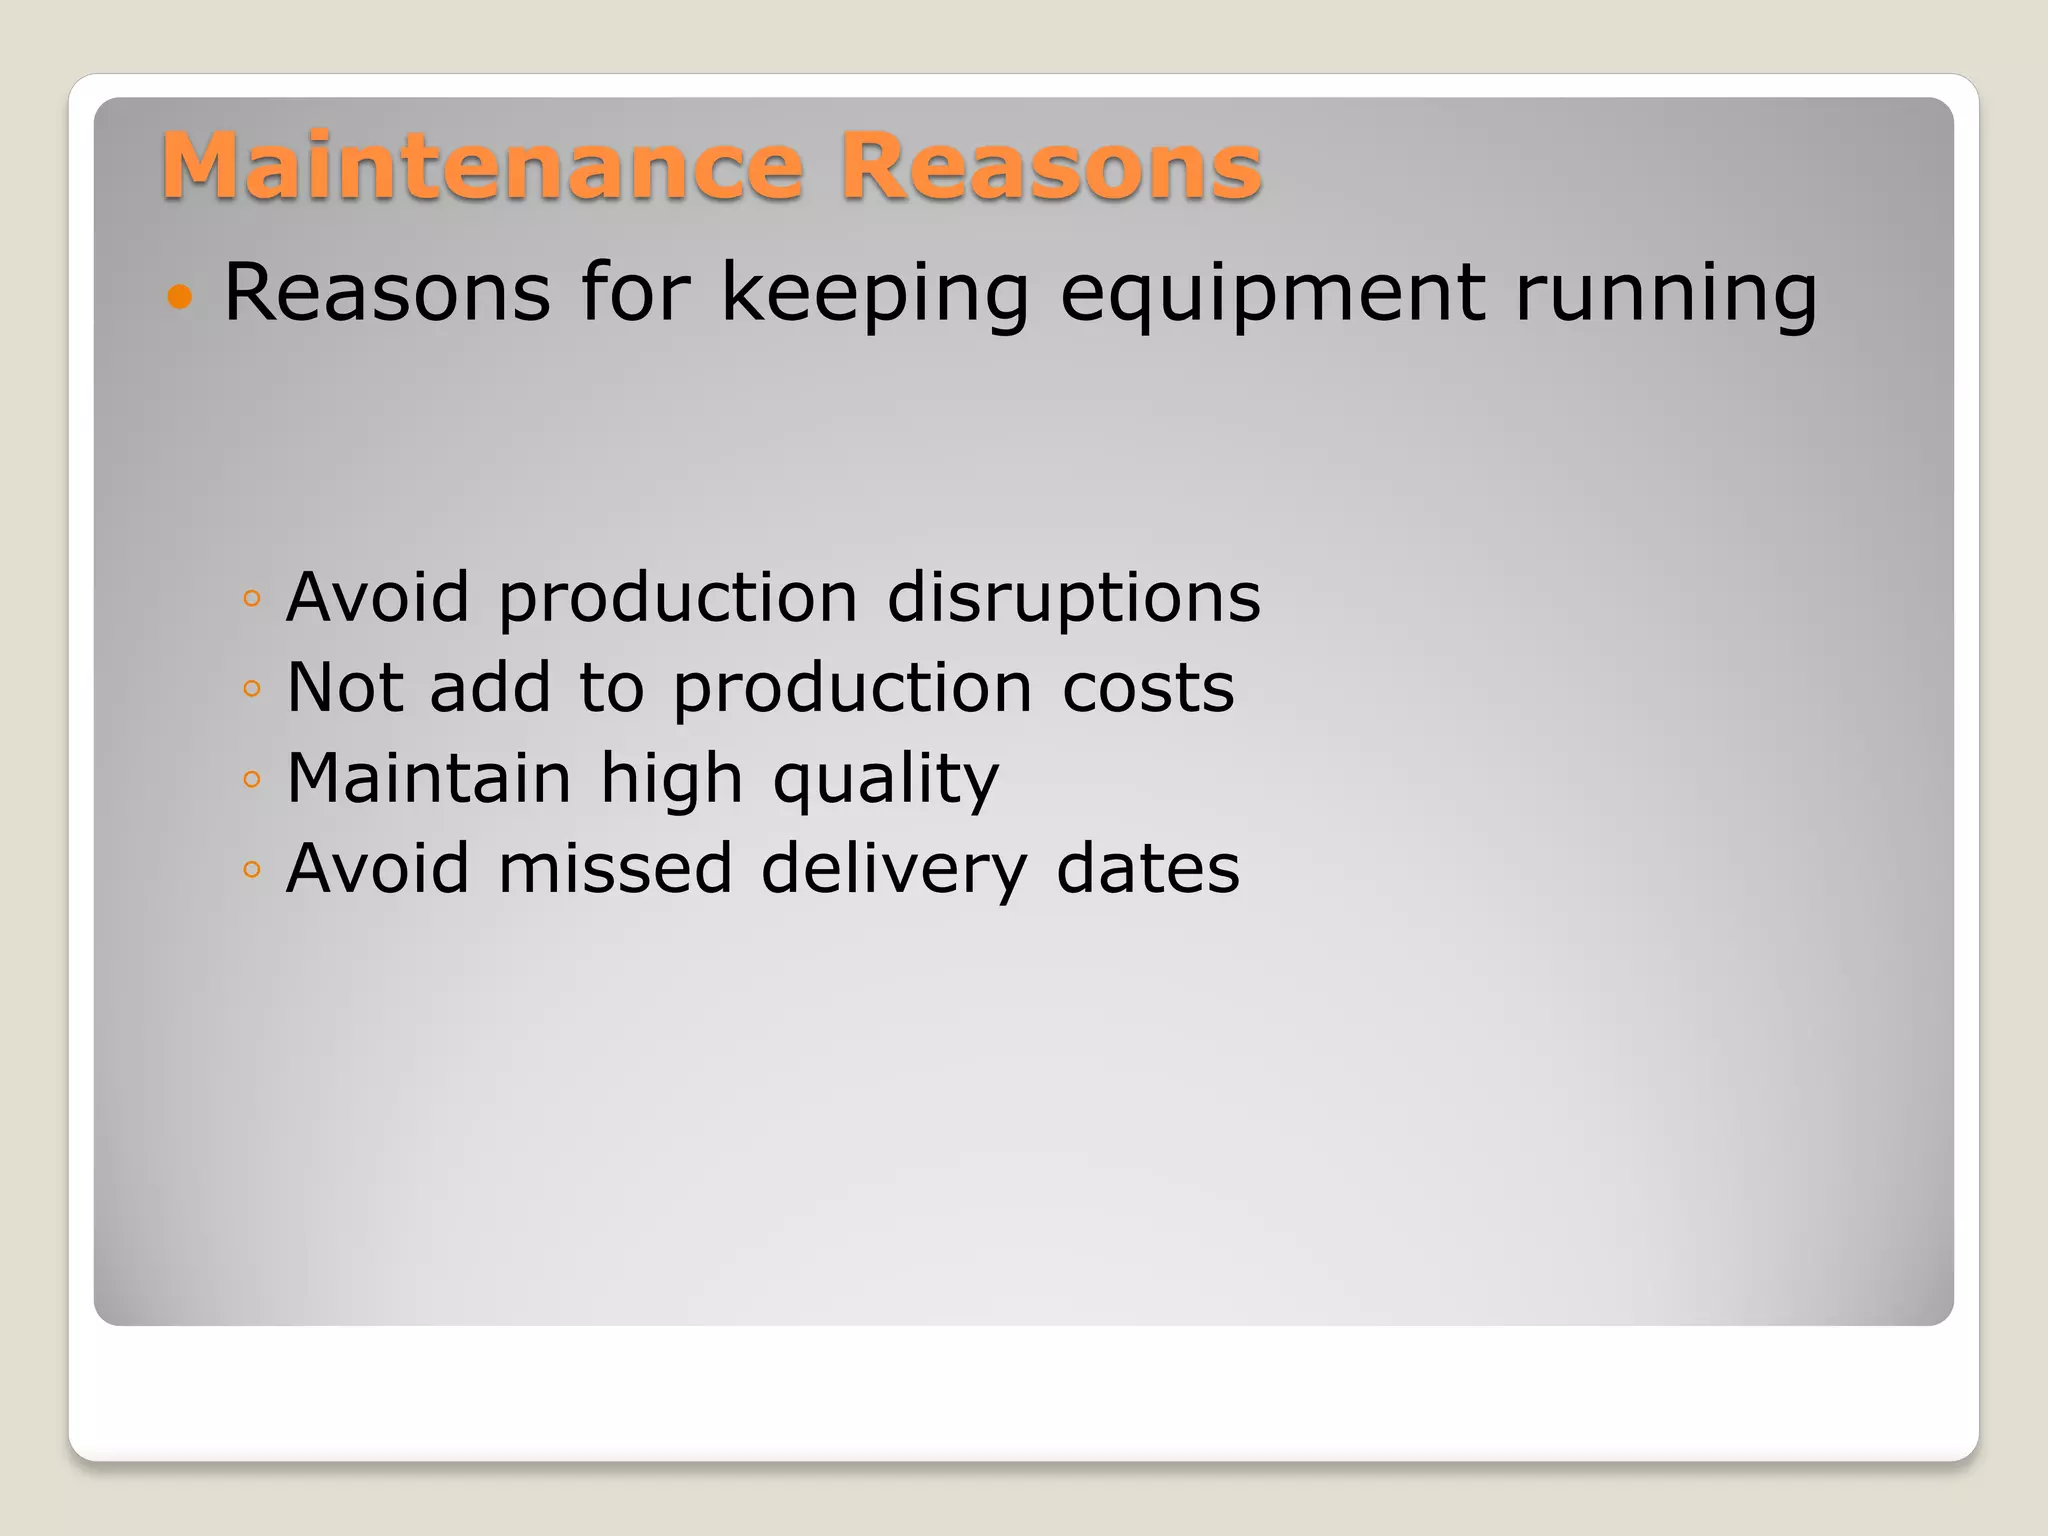
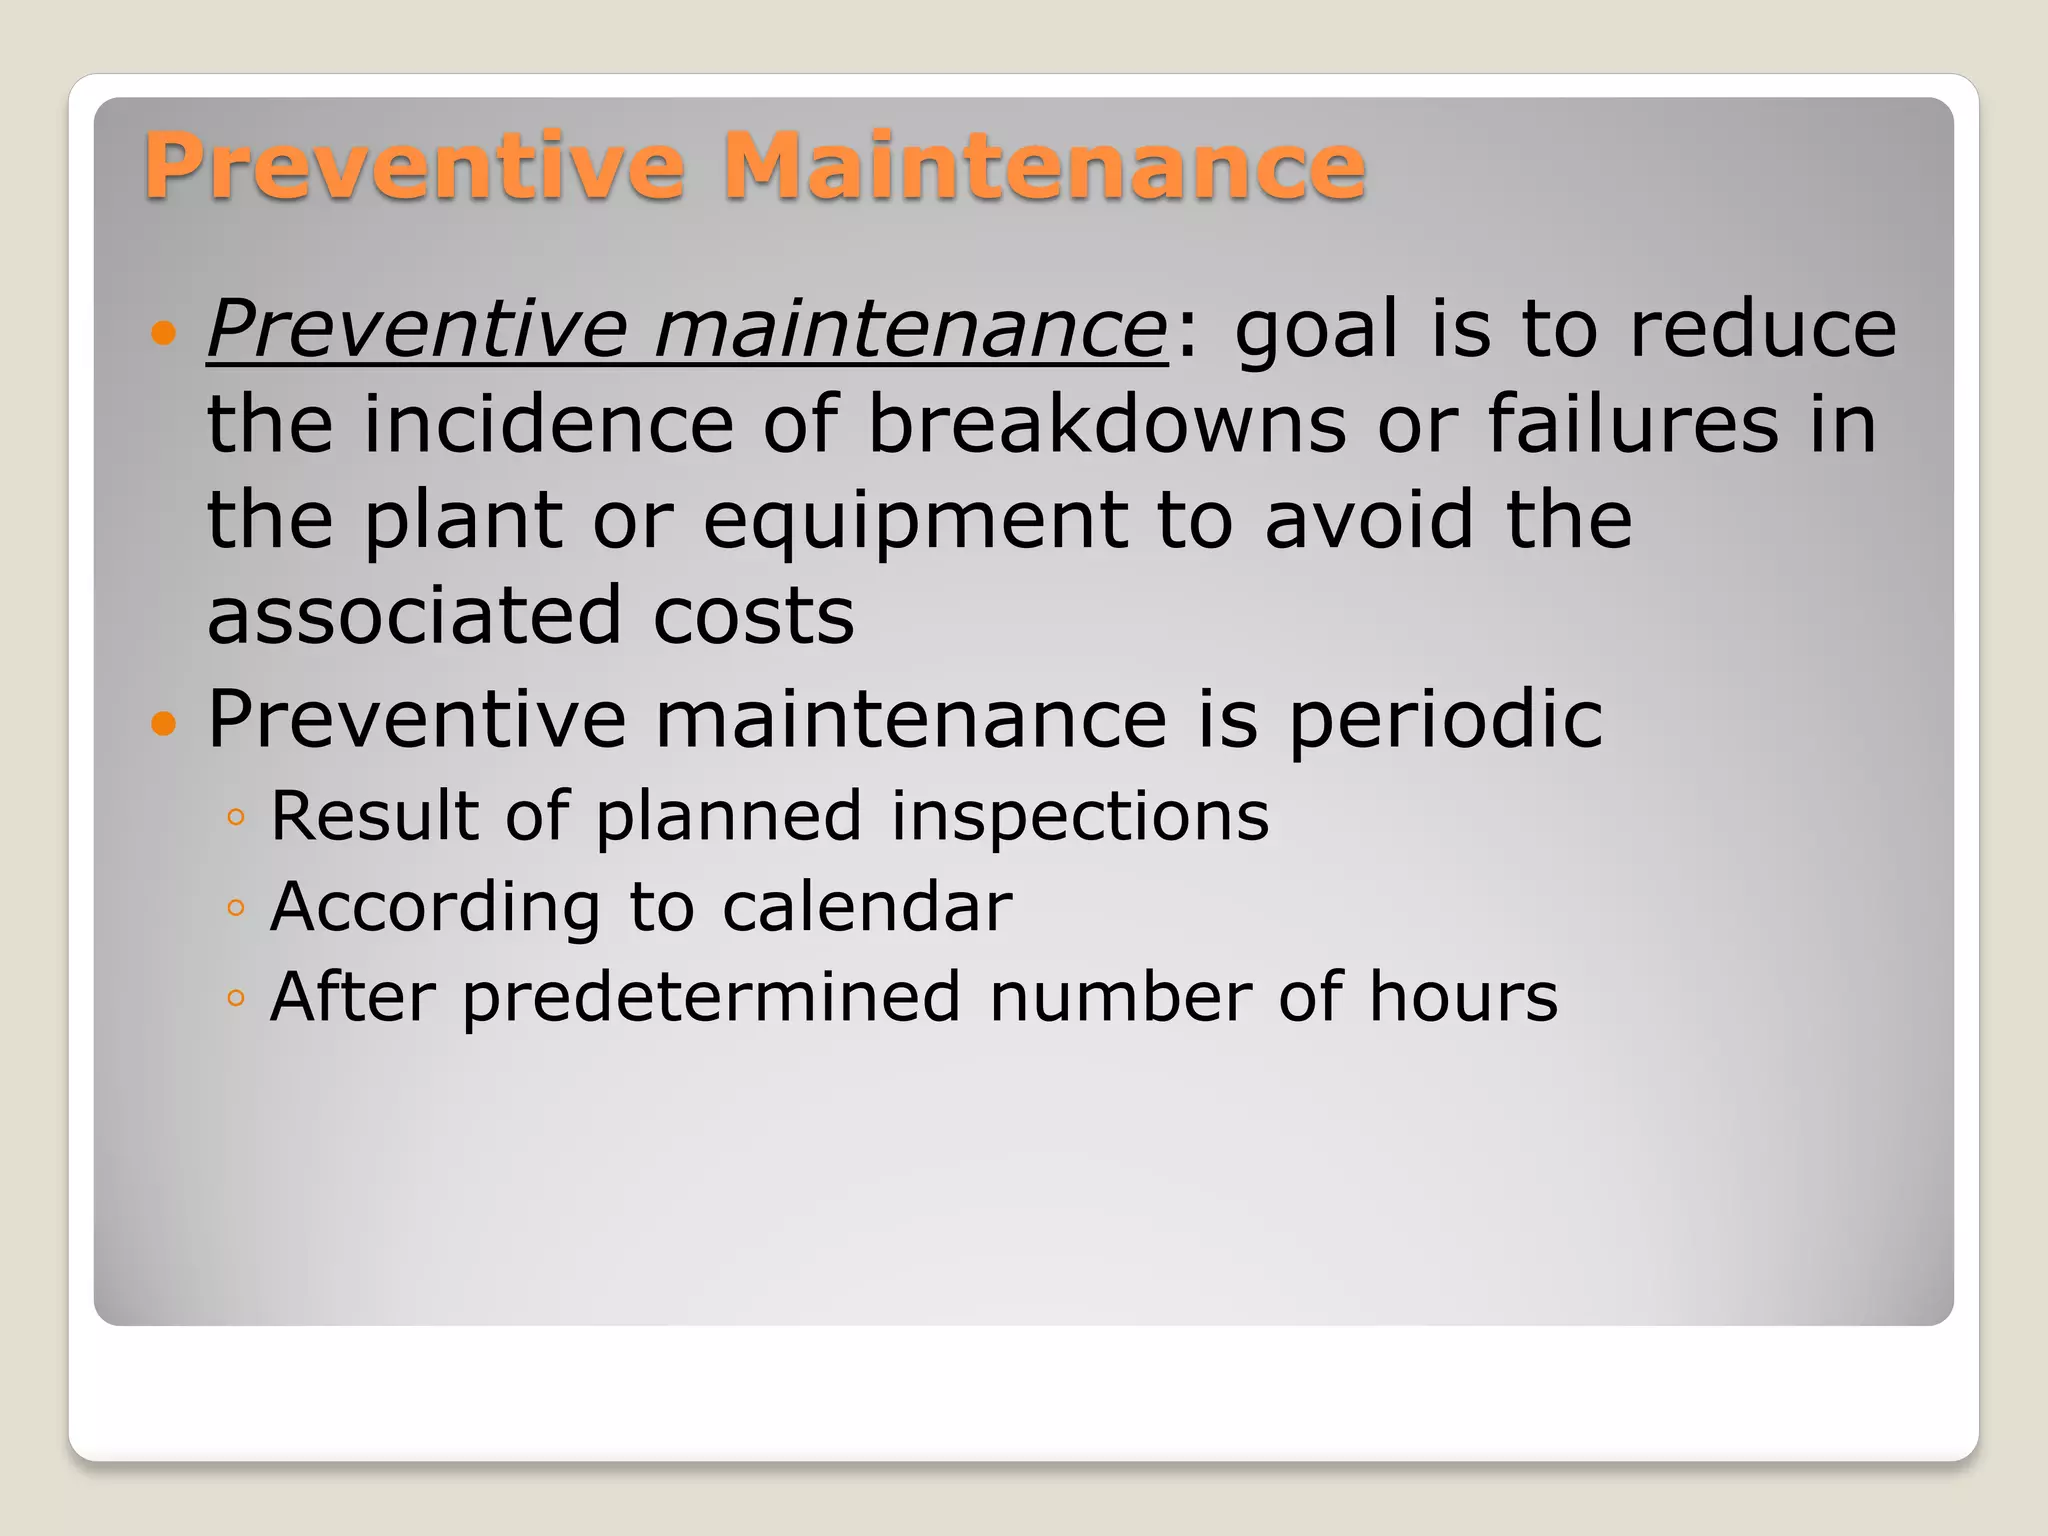
The document discusses maintenance management and key maintenance strategies including breakdown, preventative, predictive, and total productive maintenance. It defines maintenance as activities that maintain facilities and equipment in working order. Breakdown maintenance reacts to problems while preventative maintenance aims to reduce breakdowns through inspection and replacement of parts. The optimal amount of preventative maintenance balances its costs with potential costs from equipment breakdown. The document also covers replacement decisions, calculating overall equipment effectiveness (OEE), and an example OEE calculation.