Download to read offline


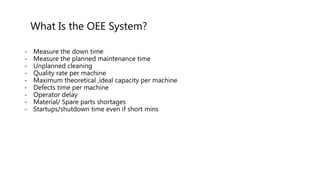
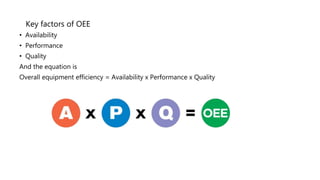
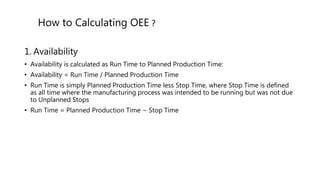
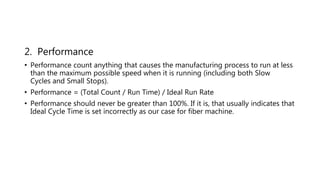
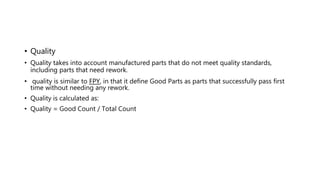
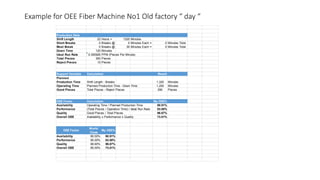
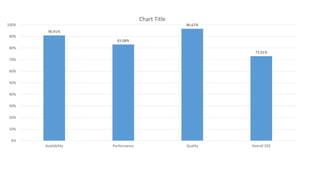


The document discusses Overall Equipment Effectiveness (OEE), a system used to measure the performance and effectiveness of equipment and processes. OEE is calculated by multiplying Availability, Performance, and Quality. Availability measures downtime. Performance measures the speed of production against the ideal rate. Quality measures acceptable output. An example calculation for a fiber machine shows its OEE of 73.01% compared to an industry standard of 85%, with opportunities to improve availability, performance, and quality. OEE analysis helps understand equipment status, support planning and improvements, and inform investment decisions.


![Process Improvements[1]](https://cdn.slidesharecdn.com/ss_thumbnails/processimprovements1-13299505097626-phpapp01-120222164206-phpapp01-thumbnail.jpg?width=640&height=640&fit=bounds)


