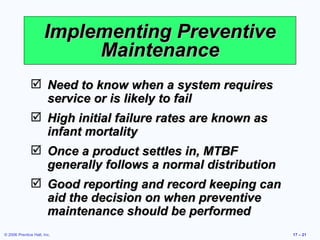
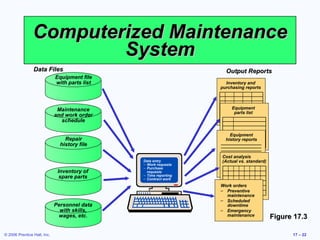
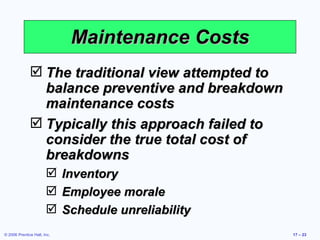
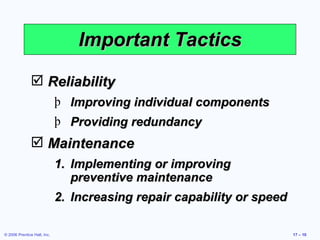
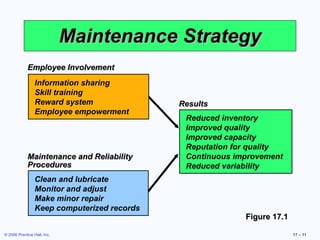
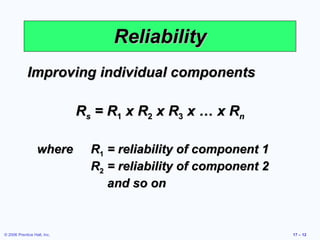
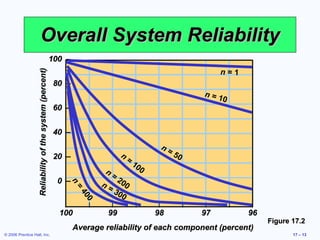
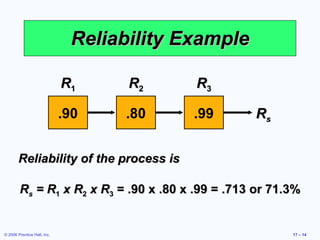
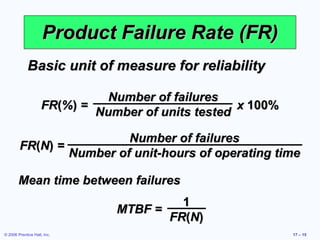
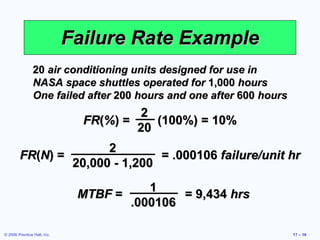
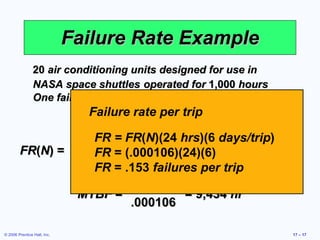
The document discusses maintenance and reliability in operations management. It covers topics like improving system reliability, preventative versus breakdown maintenance, total productive maintenance techniques, and establishing effective maintenance policies through tools like simulation and expert systems. Specific examples are provided around reliability calculations, maintenance costs, and how Orlando Utilities Commission performs plant maintenance. The overall goal of maintenance is to keep equipment functioning reliably while controlling costs.
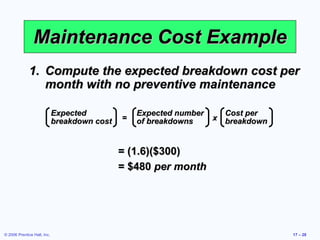
![Redundancy Example A redundant process is installed to support the earlier example where R s = .713 = [.9 + .9(1 - .9)] x [.8 + .8(1 - .8)] x .99 = [.9 + (.9)(.1)] x [.8 + (.8)(.2)] x .99 = .99 x .96 x .99 = .94 Reliability has increased from .713 to .94 R 1 0.90 0.90 R 2 0.80 0.80 R 3 0.99](https://image.slidesharecdn.com/17-maintenanceandreliability-111121140326-phpapp02/85/17-maintenance-and-reliability-19-320.jpg)