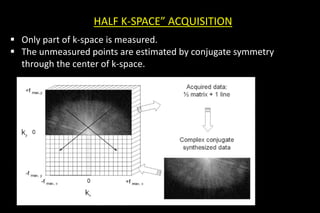
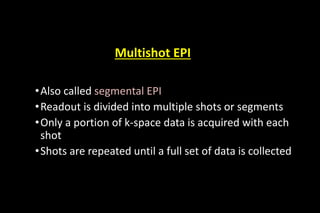
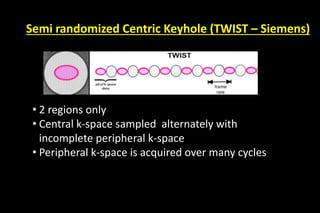
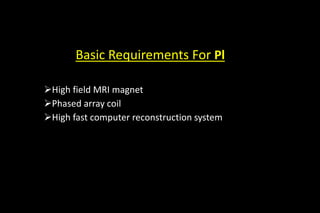
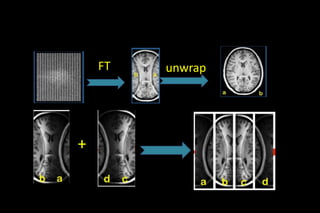
This document discusses k-space and parallel imaging techniques in MRI. It can be summarized in 3 sentences:
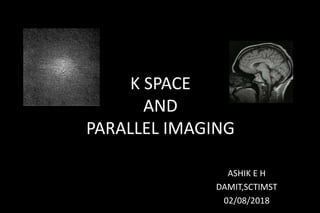
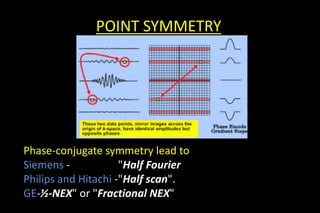
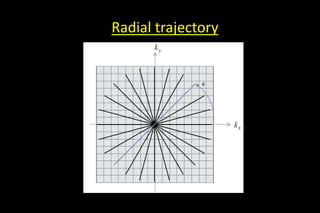
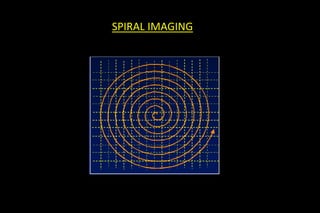
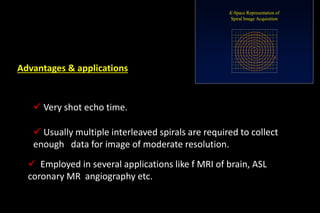
K-space is how MRI data is stored, with the center representing low spatial frequencies and edges representing high frequencies. Parallel imaging techniques like SENSE acquire undersampled k-space data using multiple receiver coils, and use the coils' sensitivity profiles to reconstruct a full k-space image without aliasing. Faster k-space filling methods like EPI acquire k-space along non-Cartesian trajectories like spirals to reduce scan time for applications like fMRI and perfusion imaging.
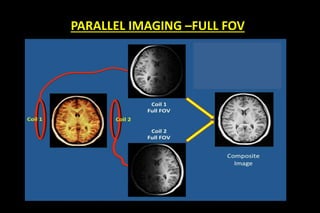
![Acceleration factor (R)
Which reduce the aquisition time
If we have M coil elements covering the FOV, we can skip up to [M-1]
lines for each line in k-space .
This can be fractional as well:
no of phase-encodes to cover k-space
R = –––––––––––––––––––––––––
no of phase-encodes used in acquisition
iPAT factor (Siemens)
ASSET factor (GE)
SENSE factor (Philips)](https://image.slidesharecdn.com/kspaceashik-180902203627/85/K-space-and-parallel-imaging-42-320.jpg)
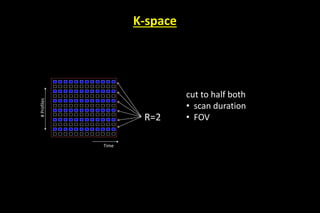
![Uses of phased array coil
In regular /Non PI imaging only problem related to spatial
sensitivity
Conventional use of
phased array [unaliased]](https://image.slidesharecdn.com/kspaceashik-180902203627/85/K-space-and-parallel-imaging-49-320.jpg)
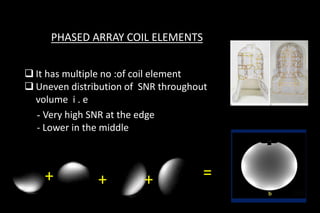
![Uses of phased array coil [PI]
•Spatial sensitivity varies for each coil element
•Along conjunction with undersampling](https://image.slidesharecdn.com/kspaceashik-180902203627/85/K-space-and-parallel-imaging-50-320.jpg)
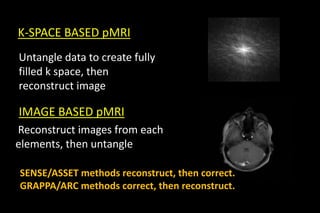
![Two Families of PAT
Image-based PAT k-space-based PAT
SENSE [Philips] SMASH
ASSET [GE] ARC [GE]
mSENSE[Siemens] GRAPPA [Siemens]
RAPID [Hitachi] iPAT [Siemens]
SPEEDER [Toshiba] SPEEDER [Toshiba]](https://image.slidesharecdn.com/kspaceashik-180902203627/85/K-space-and-parallel-imaging-52-320.jpg)
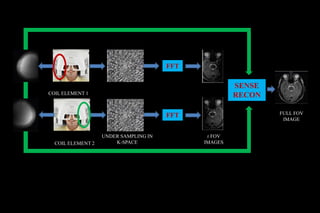
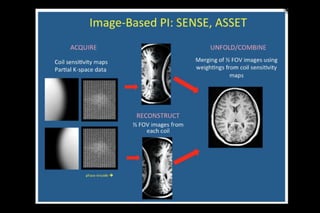
![SENSE
Introduced by Pruessmann et al
first commercially available PI method (by PHILIPS)
1 -sensitivity maps for each coil element short,low
resolution calibration scan.
2-A reduced k space is MR data formed by fewer phase
encoding gradient steps in conjunction with phased
array coil
3. Reconstruct partial FOV images from each coil
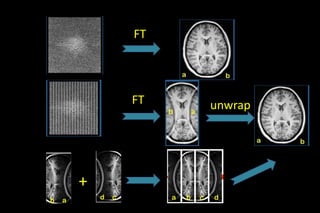
[Sub sampled k space shows aliasing]
4. Unfold/Combine partial FOV image by matrix
inversion](https://image.slidesharecdn.com/kspaceashik-180902203627/85/K-space-and-parallel-imaging-54-320.jpg)
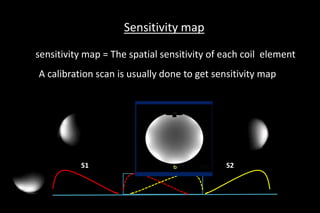
![SPATIAL SENSITIVITY MEASURED BY
A]Acquire quick images from each element of coil
B]Reconstruct the full image using all elements
C]Image (a) divided by (b) gives a noisy
sensitivity map[C]
=A
B
[C]
D]Filtering smoothes out the noise, yielding
our sensitivity map [D] [D]](https://image.slidesharecdn.com/kspaceashik-180902203627/85/K-space-and-parallel-imaging-56-320.jpg)
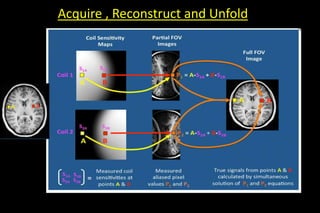
![• In pre scan calibration- calculate the point by point sensitivity
of each elements of coil
• sensitivities of Coils 1 and 2 @A =S1A and S2A
• sensitivities of Coils 1 and 2 @B =S1B and S2B
• Pixel values from Coils 1 and 2 = P1 and P2
• P1 = A•S1A + B•S1B
P2 = A•S2A + B•S2B
• 2]MATRIX INVERSION TECHNIQUE-similalar to it](https://image.slidesharecdn.com/kspaceashik-180902203627/85/K-space-and-parallel-imaging-60-320.jpg)
![• 2]MATRIX INVERSION TECHNIQUE-similalar to it
• I = (SHψ-1S + λ-1)-1SHψ-1P
• S = coarse sensitivity profiles from the individual coils,
normalized for uniform signal by the body coil
• ψ = noise covariance matrix, representing noise increase
due to patient-specific interactions between coil elements.
• P = partial FOV images with aliasing
• I = final image at full FOV](https://image.slidesharecdn.com/kspaceashik-180902203627/85/K-space-and-parallel-imaging-61-320.jpg)
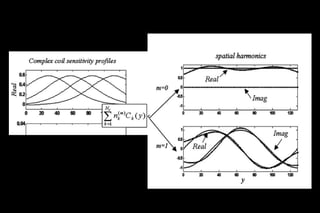
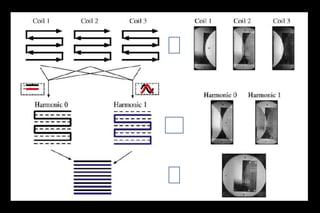
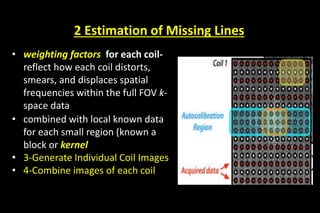
![Requires a prior estimation of the individual coil
sensitivities of the receiver array
the sensitivity values Ck(x,y) are combined with
appropriate linear weights nk (m) to generate composite
sensitivity profiles with sinusoidal spatial sensitivity
variations of the order m
sensitivity maps are fit to the desired harmonic
modulations.[m=-0,1]
Unser sampled data with desired harmonic generate full
FOV K Space
Fourier transformed to yield the full-FOV reconstructed
image
SMASH reconstruction process.](https://image.slidesharecdn.com/kspaceashik-180902203627/85/K-space-and-parallel-imaging-65-320.jpg)
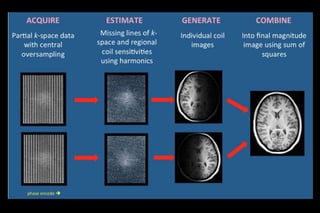
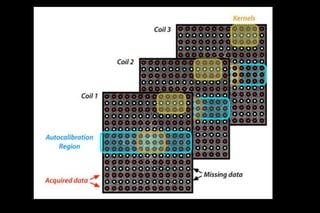
![FOUR MAJOR STEPS IN GRAPPA [ARC]
• Data Acquisition
• Estimation of Missing Lines
• Generate Individual Coil Images
• Combine images of each coil](https://image.slidesharecdn.com/kspaceashik-180902203627/85/K-space-and-parallel-imaging-69-320.jpg)
![1- DATA ACQUISITION
• Acquired MR signals are digitized,
demodulated and used to fill k space
• center of k-space with ACS caliberation
• [ACS are used to calculate weighting factors for
each coil ]
• others k space are under sampled](https://image.slidesharecdn.com/kspaceashik-180902203627/85/K-space-and-parallel-imaging-70-320.jpg)
![Choosing Of PI Method [SENSE/GRAPPA]
FACTORS
Total Imaging Time/Speed. GRAPPA/ARC is a somewhat
longer sequence than SENSE/ASSET becoz :extra time for the
self-calibration of k-space lines
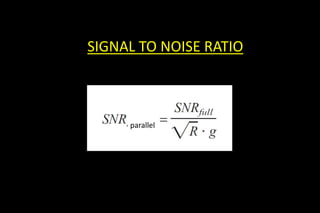
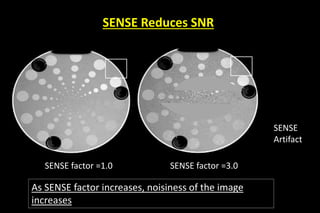
• Signal-to-noise SENSE/ASSET provides slightly higher SNR
• [ But same SNR @ R=0 ]
• Body Region accurate coil sensitivity maps may difficult to
obtain for SENSE/ASSET ;SO, GRAPPA/ARC is preffered](https://image.slidesharecdn.com/kspaceashik-180902203627/85/K-space-and-parallel-imaging-77-320.jpg)
![Choosing Of PI Method [SENSE/GRAPPA]
FACTORS
Motion: SENSE/ASSET may do poorly preferred due to
motion /recontruction artifact arise b/w calibration and
acquisition scans
difficulty suspending respiration to exactly the same degree
between SENSE/ASSET calibration and imaging
Field-of-view (FOV) GRAPPA/ARC is more tolerant toward
small FOVs
SENSE/ASSET produce aliasing/wrap around if
full FOV < OBJECT Size
Use in Single-Shot EPI : GRAPPA/ARC prefered becoz of less
distortion during reconstruction](https://image.slidesharecdn.com/kspaceashik-180902203627/85/K-space-and-parallel-imaging-78-320.jpg)
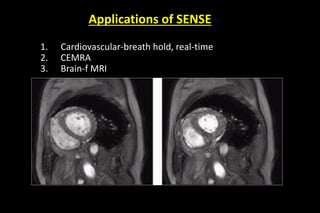
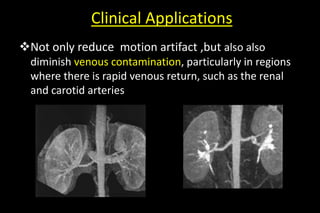
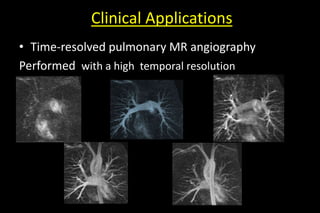
![Clinical Applications
• wide applicability: PI can be applied to nearly any pulse
sequence
• gains in acquisition speed can be used in a no: of
different ways
MR Angiography:
• Because of high acquisition speed, SNR, minimal
artifacts, and relatively high spatial resolution-it become
standard technique
Patient cooperative to hold breath [reduced aqu - time]
thus also reduce motion artifact](https://image.slidesharecdn.com/kspaceashik-180902203627/85/K-space-and-parallel-imaging-79-320.jpg)
![• The gains in speed by PI can alternatively be applied to
improve spatial resolution [so additional space encoding
steps is acquired]](https://image.slidesharecdn.com/kspaceashik-180902203627/85/K-space-and-parallel-imaging-82-320.jpg)
![Advantage of parallel imaging…
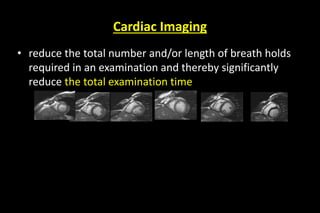
To reduce scan time
To speed up single shot MRI method
To reduce TE on long echo train methods
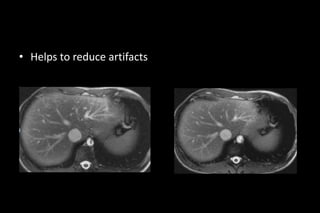
To mitigate susceptibility , chemical shift and
other artifacts
To decrease RF heating [SAR] by minimizing
number of RF pulse](https://image.slidesharecdn.com/kspaceashik-180902203627/85/K-space-and-parallel-imaging-87-320.jpg)